
Abstract
Sterile filters are ubiquitous in biopharmaceutical manufacturing processes. Because such filters are in direct contact with the process fluid, profiling of the extractables is of utmost importance. The work presented here reveals the extractables profile from filter cartridges for sterilizing-grade filtration, which were obtained from six different vendors. All filters contain a 0.2 μm polyethersulfone membrane for sterile filtration combined with a polyethersulfone pre-filter with retention rates spanning from 0.4 to 0.6 μm. These filter cartridges are designed for use in stainless steel housings which allow for in-line steam sterilization. A combination of different analytical techniques such as (headspace) gas chromatography-mass spectrometry, ultra-performance liquid chromatography–high-resolution mass spectrometry (electrospray ionization), inductively coupled plasma mass spectrometry, total organic carbon, non-volatile residue, conductivity, and pH value were applied to develop a comprehensive extractables profile on a qualitative and semi-quantitative basis. Pure ethanol and purified water were used as extraction media. The extractables profile consisted of various polyolefin-related extractables, additives such as antioxidants and degradation products thereof, hydrocarbons, and processing aids in addition to membrane-related extractables.
LAY ABSTRACT: Filter cartridges or other filter products for sterile filtration are currently most commonly made of polymeric materials such as polypropylene, and a filter membrane material such as polyethersulfone. These materials will usually release chemical substances upon extraction in the laboratory (extractables), or upon application in biopharmaceutical processing (leachables). Potential extractables and leachables are additives used to tailor the physicochemical properties and to protect the polymeric materials, or degradants of these substances, or they arise from substances used during the manufacturing of the filter cartridges. Multiple analytical techniques were applied here to investigate the concentration and chemical nature of extractables obtained upon application of two distinct extraction solvents. Typical extractables found were antioxidants or releasing agents in addition to compounds originating from the polyethersulfone membrane.
- Filter cartridges
- Sterilizing-grade filtration
- Extractables profile
- Plastic additives
- Polyethersulfone membrane
- UPLC-HRMS (QToF)
- Antioxidant degradation
Introduction
Production equipment for pharmaceutical manufacturing processes are increasingly produced from plastic materials, and the determination of extractable substances (extractables) from pharmaceutical production equipment is required by regulatory authorities or standardizing bodies (U.S. Food and Drug Administration, European Medicines Agency, USP, et al.) and organizations (Product Quality Research Institute, BioPhorum Operations Group, et al.). For many decades membrane (sterilizing-grade) filters have been used in almost all processes in the bio-pharmaceutical industries. Filters are found in upstream and downstream processes alike, for example, for the reduction of bioburden levels during processing, during cell harvest, media preparation, air filtration, and the final aseptic filtration of the drug product (1, 2). The main advantage for removal of microorganisms by filtration compared to other sterilization techniques is the absence of an energy input. No heat or radiation need be applied to the process fluid, leading to a potential degradation of a drug substance such as vaccines or antibodies (1, 3, 4). The last comprehensive peer-reviewed extraction study of filter cartridges using different membrane materials was published by O. W. Reif et al. in 1996 (5). The present study provides an update on current types of filter cartridges and employs state-of-the-art analytical techniques.
Though a large variety of membrane types exists, polyethersulfone (PES) is widely employed as the material of choice, thus only filter cartridges using this membrane material were investigated. The effective filter area ranges from 0.4 to 1.2 m2 as obtained from the product data sheets. The advantages of PES are a high level of performance (high flow rates and total throughput), a good pH compatibility, low levels of intrinsic extractables, and an excellent resistance to most sterilizing methods/agents. On the other hand, the hydrophobic nature of PES membranes leads to the need for membrane modification either by an addition of a hydrophilizing substance prior to membrane formation, or through surface modification.
Materials of Construction of the Filter Cartridges with Regard to Extractables
Polyolefins, and in general polypropylene (PP), are widely employed as materials of choice for the manufacturing of the “hardware” of the filter cartridge, such as the inner core, caps, and so forth. All cylindrical filter cartridges investigated are composed of a perforated inner core, an outer protection cage, a cap on top, and a cap at the bottom equipped with a bayonet adaptor. To the best of our knowledge, these parts were all made from PP. PP is easy to process, has excellent physical properties, and an excellent resistance to most process fluids like dilute and concentrated acids, alcohols, and bases. The limited durability of PP toward heat, UV, or gamma irradiation is overcome by the addition of stabilizers such as antioxidants (6, 7). Primary (e.g., hindered phenolic) and secondary (e.g., phosphites or thioethers) antioxidants are synergistically used to ensure durability of the material during injection molding or extrusion and for storage stability (8, 9). Other possible classes of additives for PP besides the antioxidants are (a) releasing agents such as long alkyl chain amides or stearic acid derivatives, (b) clarifying agents, and (c) hindered amine light stabilizers (HALS) (10). Other plastic additives such as dyes or pigments (besides TiO2, which is insoluble and will not migrate) or plasticizers are typically not added to the PP used in filter cartridges for biopharmaceutical applications.
The filter cartridges investigated are not designed for gamma sterilization. Therefore, gamma-induced volatiles of PP (acids, ketones, aldehydes) and other degradants (e.g., 1,3-di-tert-butyl benzene) known from the literature are not expected to be present in a measurable amount but will be investigated in the screening analyses (11, 12).
From the PES membrane material (final and pre-filter), hydrophilizing substances can be expected to be present. The hydrophilization step is a general procedure required for all membranes made from hydrophobic polymers such as polyethersulfones and fluoropolymers. Hydrophilizing agents can be polyethylene or PP glycols, polyvinylpyrrolidone, or other hydrophilic polymers. The analysis of, if, and what hydrophilizing substances are present might be relevant because they can potentially influence the stability of proteins (13). Additionally, membrane-related compounds intentionally and non-intentionally added or used during membrane production like solvents are likely extractable.
The drainage layer is commonly made of spunbonded PP but also from polyester. Therefore, only an increase in the level of the already stated additive classes is expected from these parts. The exception is polyester material, in which the extractables profile strongly depends on the monomers used. From polyethylene terephthalate (PET), dimers and trimers can be expected (14).
In general, all parts are thermally welded to form the final cartridge, and no gluing is required during manufacturing. The filter cartridges are equipped with a bayonet adaptor with silicone gaskets.
Experimental
Extraction
The extraction was carried out according to our Sartorius Stedim Biotech (SSB) approach. The surface-area–to–volume ratio (S/V) of 1:1 cm2/mL applied in this approach is not easily feasible for 10 inch filter cartridges. Therefore, as a practical approach, all filter cartridges were extracted with the same volume of extraction solvent fixed at 1500 mL (S/V ratios ranged approximately from 3 to 7 cm2/mL). Concentrations obtained were used to calculate the amount of extractables per effective filter area to allow a pragmatic comparison. The filter cartridges were extracted as received out of the box without the required steam sterilization, rinsing, and/or integrity test. Although these steps should be done before use and such procedures are described in the instruction manuals, the goal was to obtain the most complete picture of the extractables profile. Also, there are examples in which the filters are used during downstream processes (e.g., for bioburden reduction) without a prior steam sterilization or in which no rinsing can be applied.
Extraction parameters were as follows: temperature 40 ± 3 °C, horizontal shaking speed 150 rpm, extraction time 24 h (no steady-state equilibrium conditions or “asymptotic levels”). The filter cartridges were extracted separately either with ethanol (absolute, pro analysis) and purified water in a shaking water bath (Julabo SW22) using a 2 L glass extraction vessel in vertical position (see Figure 1). A blank of the solvent is prepared at the start of the extraction under the same conditions. Before the extraction, the silicon O-rings of the bayonet connectors of the cartridges were removed because these are not considered to significantly contribute to extractables, as little or no material is in contact with the process fluid during application. Any contact of plastic laboratory materials with the extraction media was avoided. The use of glass equipment was reduced to a minimum but could not be completely circumvented. This must be considered when interpreting the elemental analysis (silicon, boron, etc. as typical “glass-extractables”).

Graphical representation of the extraction of the filter cartridges; additionally, a hood was used to secure a constant temperature throughout the extraction vessel.
Instrumental Methods
Gas Chromatography-Mass Spectrometry (GC-MS) and Headspace GC-MS:
Ethanol extracts were injected into the GC-MS without pre-treatment. A GC system suitability standard (GC-SST) in 10 μg/mL was used to assess and secure system performance. The composition of the versatile GC-SST is given in Table II. In addition to the verification of the detection of typical representatives of different compound classes, the two compounds butylhydroxytoluene and 2,4-di-tert-butylphenol are critical to separate and can be used as criterion for chromatographic performance. A sample preparation was carried out for the water extracts. For this purpose, NaCl (mass fraction 0.3) and an extraction standard (heptadecanonitrile) were added to the water extracts followed by a triple extraction with dichloromethane (DCM, volume fraction 0.3). The organic extract was filled up to the starting volume with DCM (concentration factor 1). Efficiency of the sample preparation was confirmed by the extraction standard and an additional sample containing a recovery standard (GC-SST, extract concentration 10 μg/mL). Prior to measurement, an internal standard, 2-fluorobiphenyl, was added to all samples (extract concentration 10 μg/mL); it is used as injection standard and to perform semi-quantification of the analytes.
Extraction Solvents and Analytical Methods
Composition of the GC-SST, Starting Concentration 100 μg/mL in Isopropanol
Composition of the Headspace System Suitability Standard, Starting Concentration 100 μg/mL in Water/ Dimethyl Sulfoxide
Headspace GC-MS was measured on the water samples only. Approximately 5 g Na2SO4 were transferred to a headspace vial, and 10 mL of sample were added. Toluene-d8 was used as injection standard and for the semi-quantification (extract concentration 0.1 μg/mL). An in-house standard mix, headspace system suitability standard, in the concentration of 0.5 μg/mL was used to prove that the equipment was functioning correctly.
The system used was a Clarus 600GC and Clarus 600T MS Turbo with a USP G27 C18 (5% phenyl) column. For headspace sampling a Turbomatrix HS 40 was used. Operating parameters for liquid injection were as follows: injector 75 °C (0.1 min) to 250 °C (200 °C/min) with 1 μL splitless injection and helium carrier gas 1 mL/min, oven from 35 °C (0.1 min) to 300 °C (15 °C/min) and hold for 30 min, transfer line and source temperature was 250 °C with a scan range from 35 to 700 m/z. For headspace injection the injector was constant at 200 °C, oven was ramped from 35 °C (5 min) to 280 °C (10 °C/min) and hold for 10 min with helium constant flow of 0.6 mL/min, source and transfer line temperature was also 250 °C, and the scan range was from 30 to 300 m/z. A carbon trap was used to lower detection limits. Identification levels confirmed, confident, tentative, and unknown were in line with the USP <1663> recommendations (the category unknown was included if the molecule could not be classified).
Ultra-Performance Liquid Chromatography–High-Resolution Mass Spectrometry (UPLC-HRMS):
Extracts were injected directly into the UPLC-HRMS (in the following referred as LC-MS) system without sample pretreatment. An in-house standard mixture containing 30 targets of plastic additives defined in USP 661.1 and Ph. Eur. 3.1.13. or plastic additives restricted by Registration, Evaluation, Authorisation and Restriction of Chemicals (REACH) (e.g., distinct phthalates) together with other typical extractables/degradants was used for quantification during target screening. An independent quality control standard (ASTM D6042-96 Calib. Mix, concentration 0.1 μg/mL) was used to approve the calibration. The system was from Waters: ACQUITY UPLC I-Class equipped with a C18 column (BEH, 1.7 μm, 2.1 mm × 100 mm) and precolumn connected to a Xevo G2-XS QToF (quadrupole time-of-flight) [electrospray ionization (ESI) mode] as mass analyzer. Eluents were the following: A = acetonitrile and B = water with 10 mmol ammonium acetate with gradient: 0 min/A 5%; 0.5 min/A 5%; 9 min/A 99%; 39.5 min/A 99%; 39.6 min/A 5%; 40 min/A 5% with flow of 0.5 mL/min, column temperature of T = 40 °C, and injection volume 1 μL. The software for data evaluation was UNIFI v1.8.2.
Total Organic Carbon (TOC), Non-Volatile Residue (NVR), Fourier transform infrared (FTIR):
The NVR and the FT-IR spectra were determined from both extraction media. FT-IR spectra (Bruker Tensor 27) were measured when enough NVR was obtained that can be removed from the crucibles and transferred to the attenuated total reflectance FT-IR spectrometer. The NVR expresses all non-volatile substances that cannot be evaporated or sublimated at 105 °C.
Conductivity, pH:
The pH value was determined from water extracts using a ProfiLine 3210 with a Sentix 51 pH electrode from WTW. A MultiLab 540 with the conductivity-measuring cell LR 325/001 from WTW was used for measuring the conductivity. Before the pH value was determined, a small portion of NaCl was added to the sample, which is necessary in the case of pH determination of purified water.
Inductively Coupled Plasma Mass Spectrometry (ICP-MS):
ICP-MS was performed to determine inorganic elements present in the water extracts. All samples were acidified with concentrated HNO3 (5%) and diluted (10-fold). An external calibration with different multi-element standard solutions was performed, and three internal standards (yttrium, rhodium, and lutetium) were used for quantification. The system was an Agilent 7900 ICP-MS operated in helium collision mode for interference removal. In total, 40 elements were measured among all other elements stated in the ICH Q3D guideline (September 2015).
Results and Discussion
Sum Parameters and General Reference Values
To give an assessable overview of the amount of extractables present in the two different extraction media, the sum parameters TOC and NVR were determined. The TOC content is extreme valuable and indispensable in generating a “mass balance” of extracted compounds from a device to determine if the different chromatographic screening techniques applied are sufficient to obtain a “complete” picture of an extractables profile for aqueous extraction media. This was highlighted as a central theme in the literature where the TOC is used as a marker for the completeness of an extractables screening (15).
The TOC content represents only water-soluble compounds and is an essential parameter also determined during filter cartridge process validation, for example, for defining flushing volumes. Contrary to TOC, NVR covers also non-carbon containing substances like silicones or salts (elements). Additionally, the pH value and the conductivity of the extracts were measured. They are not correlated to the effective filtration area (EFA) because this is not reasonable. The results of the measurements are summarized in Table IV.
Sum Parameter TOC and Further Characteristics of the Extracts
The TOC, normalized to the EFA, varies strongly between the six different filter cartridges. No NVR was obtained for the water extracts (below the detection limit of extract concentration of 10 μg/gsolvent), indicating that the TOC is composed to some extend of volatile substances such as residual solvents. The NVR of the ethanol extracts was higher than the TOC and in the range of 10 to 80 μg/cm2. This is commonly but not always observed because there is no specific correlation between the TOC for extraction medium water and the NVR for extraction medium ethanol. This is reasonable, as the two media differ in their extraction strengths and, for example, water-insoluble compounds are discriminated in the TOC, and on the other hand, volatile compounds are discriminated in the NVR.
The content of TOC per square centimeter EFA is high and will sum up to several milligram per filter element assuming a mean EFA of 10,000 cm2 for “out-of-the-box” application. This can be explained by the fact that manufacturers inherently need solvents for the preparation of the casting solution and also use polymeric wetting agents to generate a hydrophilic surface. Though extensive rinsing/autoclaving steps commonly applied during and after the manufacturing of the filter cartridges, these solvents and polymeric compounds persist in the membrane matrix and tend to migrate to the surface during drying or storage (but also after irradiation sterilizations). This indicates the need for a flushing procedure (after in-line sterilization) before use, which is known to exponentially decrease these compounds within the first flush volumes (5). In this context, a term such as “rinsable” for these flushable compounds from filter cartridges or other single-use systems instead of extractables should be considered.
The pH value of the different water extracts was only slightly decreased—was more acidic—than for the blank (blank pH = 6.1). As purified water has no buffer capacity, the presence of very few amounts of organic acids (potentially formed as degradants or, alternatively, as the acidic phenolic antioxidants of the PP itself) would lead to a drop in the pH value, which was not observed for the extracts. Thus, the level of acidic compounds must be very low in the water extracts. The conductivity of the extracts was comparable for all filter cartridges and only slightly higher than the blank value (1.5 μS/cm). Therefore, the presence of inorganic salts, or considerable amounts of ionized organic molecules (protonated or deprotonated), in the water extracts can be excluded.
It should be emphasize again that these values cannot be linked to any realistic process application. All suppliers perform flushing studies to control and approve the recommendations given in the user manuals when parameters like TOC will meet the requirements of water for injection as described in the USP or other standards.
Headspace GC-MS Screening
With headspace GC-MS, more or less volatile compounds are detected. However, one statement should be added here: It is sometimes stated and somehow accepted that volatiles can and will diminish during time because of their volatile nature. This might be the case during storage but not during extraction (if found otherwise then the design of the extraction setup would be improper). This is also valid for the most volatile expectable substances like acetone or ethanol. Therefore, an extraction with water over a time of 24 h, as conducted in this study, will give a quite comprehensive overview of typical volatiles. Shorter extraction times such as 30 min are not useful for detecting any additional volatiles, especially at higher concentrations, as clearly shown by internal data and consistent with literature (16). The results of the headspace analysis are depicted in Table V, and quantitative results are given in micrograms per square centimeter (μg/cm2) (correction of the semi-quantitative results with the response factor of the analytes to the internal standard).
Results of the Headspace GC-MS Analysis of the Water Extracts. Concentrations are the following: a = > LOQ to 0.1; b = 0.1 to 1.0; c = 1.0 to 5.0 μg/cm2.
The amount and number of extractables found in headspace analysis are low (all compounds below 3 μg/cm2 by quantification). Alcohols such as isopropanol are typical solvents used during membrane production. The origin of the other small volatiles is unclear, but the amount per per square centimeter is generally very low. It must be considered that concentrations of water-soluble analytes obtained after semi-quantification against an internal standard such as toluene would be underestimated. Toluene has a smaller partition coefficient—a main parameter in headspace analysis—compared to the compounds found in this study (Kethanol/Ktoluene = 450). Therefore, it is more efficiently enriched in the headspace and the concentration of the water-soluble compounds is easily underestimated by a factor of <100 (17). This must always be considered when discussing semi-quantitative headspace results. From a general point of view, there is no suited single internal standard for headspace analysis, and at least a one point calibration with the analyte or a correction using the response factors of the analytes versus the internal standard should be conducted if concentrations are needed, which was done in this study.
GC-MS Screening and Target LC-MS Analysis
In order to detect semi- and non-volatile analytes, the two techniques, GC and LC coupled with a mass sensitive detector, were applied. For the GC separation, standard equipment with a quadrupole mass analyzer after ESI was used. The spectrometer generating the HRMS spectra was a QToF operating with an ESI source in positive and negative ionization mode. Mostly ESI and atmospheric pressure chemical ionization (APCI) are alternately used as main ionization techniques in extractables/leachables (E/L) studies (APPI as third alternative is not considered here). The effectiveness of an ionization (even comparing ESI) strongly depends on source design, eluent, eluent additives, and so on. We cannot confirm the statement that ESI is inferior to APCI in E/L analytics (18). For the Waters instrument, the detection of the various polymer additives (which in general possess a heteroatom and are therefore susceptible to ESI) was improved with ESI compared to the APCI source. Detection limits for typical antioxidants down to 1 ng/mL can easily be achieved with the SSB method applied even with an injection volume of 1 μL. As an example, limits of detection (LODs) for the following analytes are listed—in parentheses are the LODs found in the literature (19): Tris(3,5-di-tert-butyl-4-hydroxybenzyl) isocyanurate < 0.001 μg/mL (0.02 μg/mL) or tris(2,4-di-tert-butylphenyl) phosphite < 0.01 μg/mL (0.03 μg/mL). Findings for the Waters mass spectrometer were similar to results from another manufacturer (20). It must also be noted that only water-soluble compounds can be expected for aqueous-based extraction media such as buffers or salt solutions, water with a high and low pH, or even alcoholic solutions such as ethanol 50% (v/v) as recommended by USP <665> (draft 2017) or the BPOG proposal. Typically, these molecules always have a structural moiety making them “water-soluble” and where the ionization will occur. These moieties are polar groups such as phenols, sulfonic or other acids, amines, smaller ester, and so on. It is well known from screening investigations of aqueous samples that these compounds are ionized well with ESI, and thus this is the technique of choice for these types of LC-HRMS analyses (21, 22). One drawback of ESI compared to APCI might be a greater susceptibility of the ionization toward the sample matrix (ion suppression but also ion enhancement), but this is not the case for water and ethanol that were used in this study. On the other hand, analytes must be thermally stable to be accessible by APCI; and the “additional” classes of molecules detected by using APCI—unpolar compounds, few functional groups (e.g., alkanes, alcohols, or aromatic hydrocarbons)—are already covered by GC-MS easily with or without derivatization.
These considerations show that there is no strict rule that any particular ionization technique is better (especially in screening studies) or has a higher sensitivity or other benefits than the already mentioned techniques; the results are comparable (19, 20, 23). Performance of the LC-MS system strongly depends on the source design and method conditions, and—if justified by proper method validation—both techniques can be used. From our point of view, the use of ESI and APCI as complementary methods is not conducive in detecting more “unknowns” in routine studies when considering the cost and laboratory time-benefit calculation.
In this study the water and ethanol extracts were injected directly into the LC-MS. For GC-MS a sample preparation by liquid-liquid extraction was performed for the water extracts, whereas the ethanol extracts were injected directly. The results of the analyses are depicted in Table VI.
Summary of the Analyses with Concentration in μg/mL of the Ethanol Extracts (Water Extracts) Obtained after Semi-quantification and Quantification (GC-MS) and Quantification (Target LC-HRMS): a = < LOQ to 0.1; b = 0.1 to 1.0; c = 1.0 to 10, d = 10 to 50 μg/cm2
The chromatograms of the water extracts only a show few peaks for GC and LC analysis. Basically, only water-soluble compounds such as N-methyl-2-pyrrolidon or caprolactam were detected and confirmed. For caprolactam it is known that small amounts can be found in extractables studies of plastic materials and/or single-use systems due to the migration from a polyamide “PA 6”–containing packaging material like polyolefin/polyamide bags as already described in migration studies with food simulants (24). We confirmed the presence of polyamide in the packaging material by FT-IR (not shown), and results were in accordance with the extracts in which a small amount of caprolactam was present. However, the high levels of caprolactam in filter cartridges 2, 3, and 5 originate in the membrane production process. The same accounts for γ-butyrolactone and pyrrolidone (+ derivatives), which are typical solvents used during membrane production (casting solution) (25).
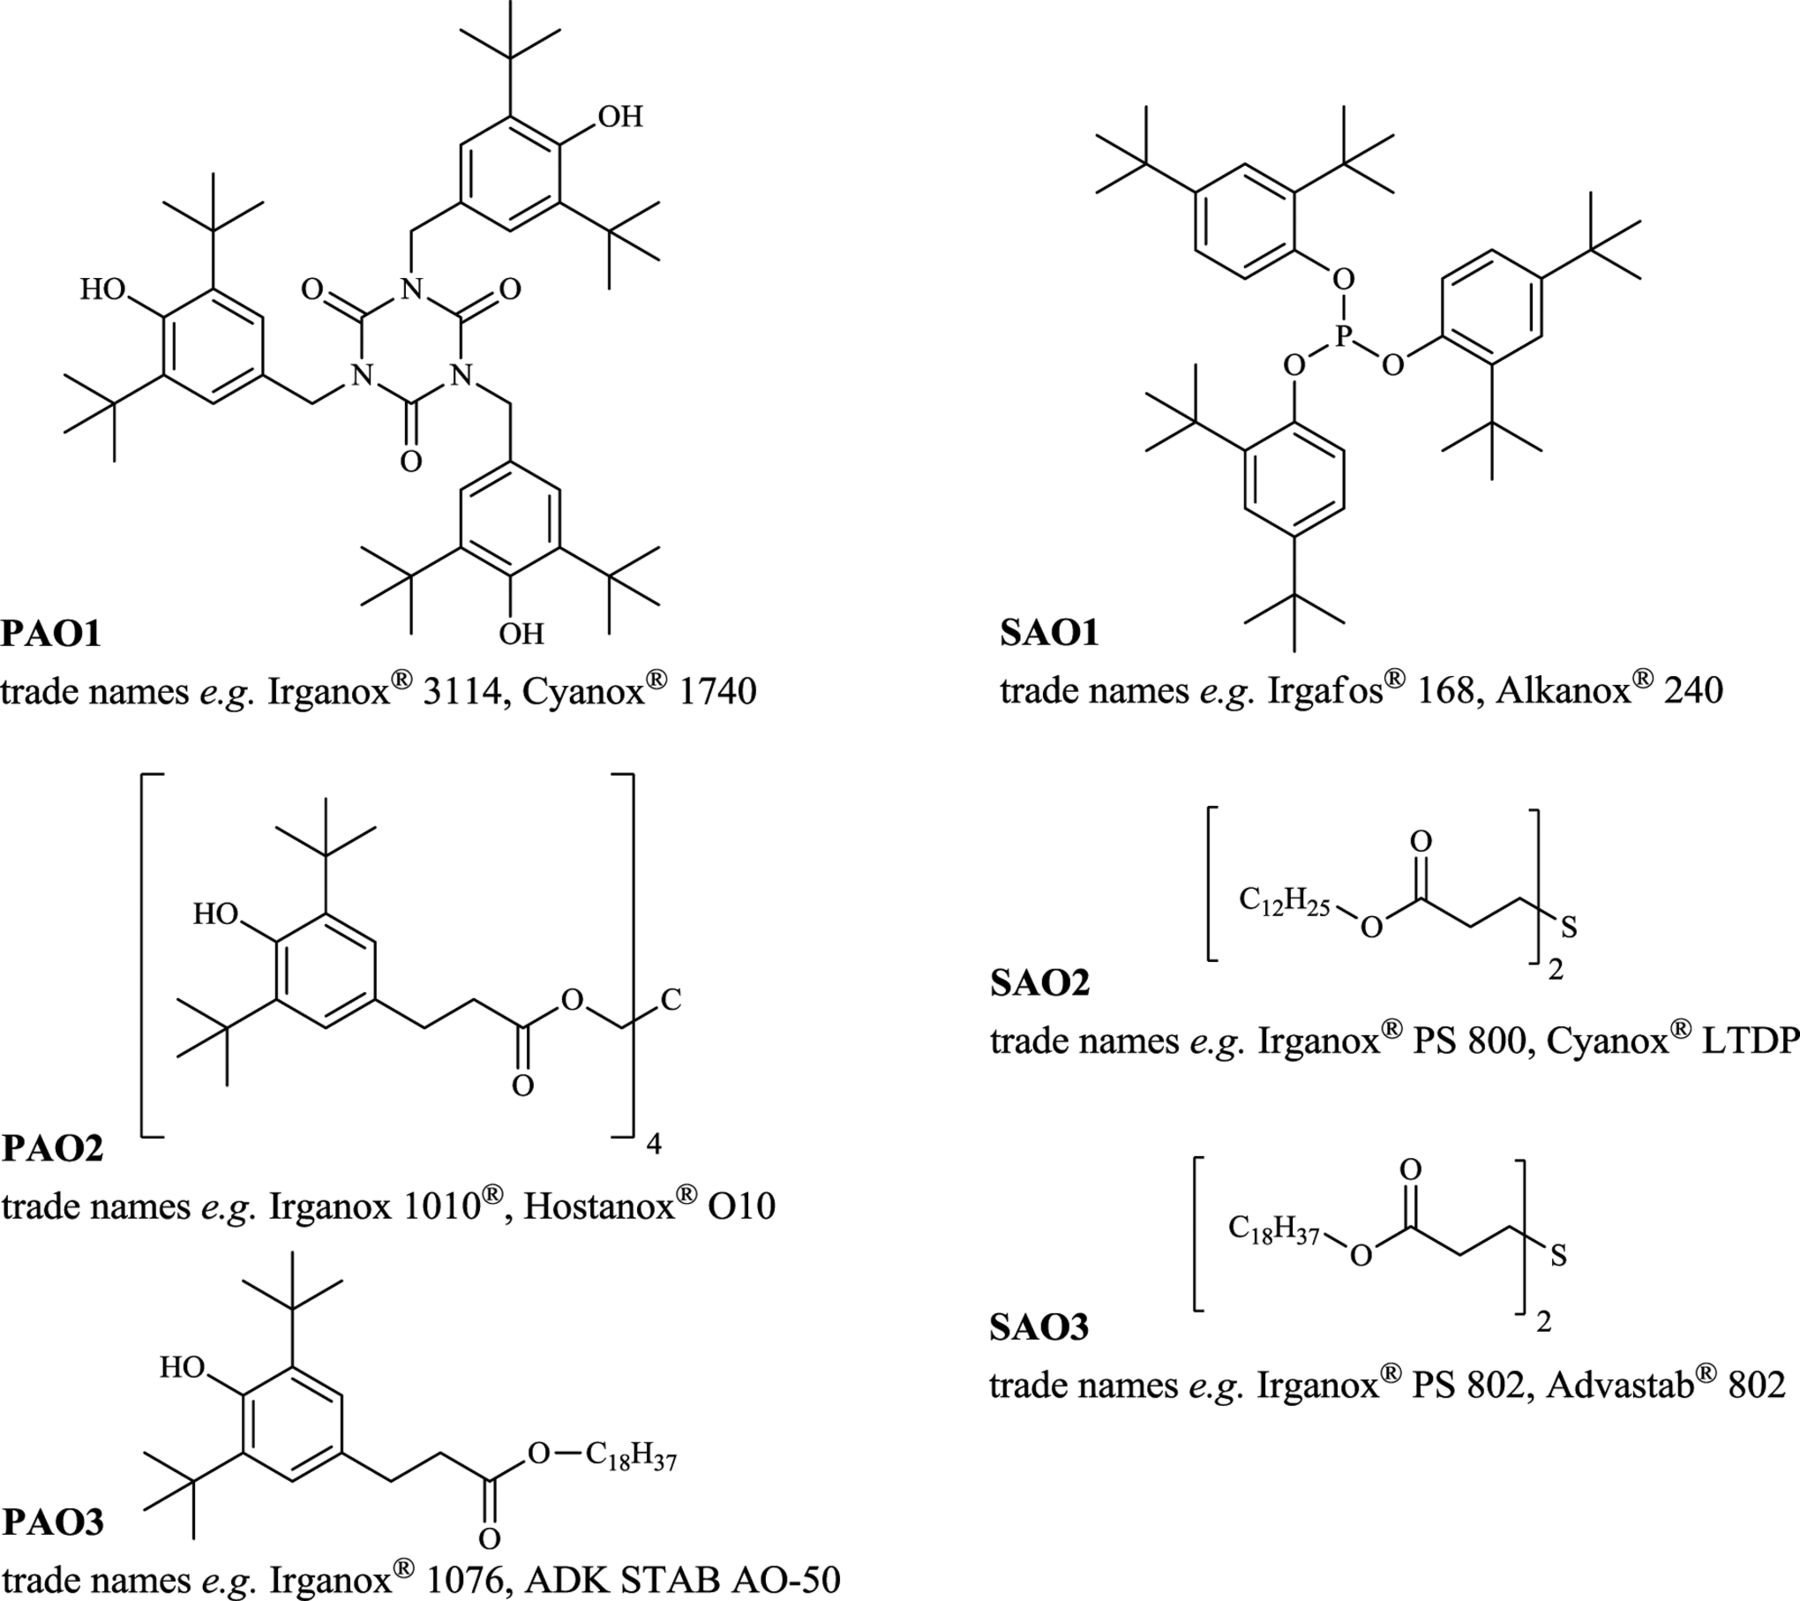
The majority (number) of the compounds found during GC and LC analyses were detected in the ethanol extracts and stem from the polyolefins used. The inner core, outer protecting cage, or the caps/connectors have the lowest influence on the extractables profile due to their small surface, as confirmed by internal studies. Therefore, the prefilter and the supporting fiber—if made from PP—contribute most to the PP-related additives and its degradants. The following primary antioxidants have been found in the ethanol extracts: Tris(3,5-di-tert-butyl-4-hydroxybenzyl) isocyanurate (27676-62-6, PAO1), pentaerythritol tetrakis(3-(3,5-di-tert-butyl-4-hydroxyphenyl)propionate) (6683-19-8, PAO2), and octadecyl 3-(3,5-di-tert-butyl-4-hydroxyphenyl)propionate (2082-79-3, PAO3). The secondary antioxidants found were the following: Tris(2,4-di-tert-butylphenyl) phosphite (31570-04-4, SAO1), didodecyl 3,3'-thiodipropionate (123-28-4, SAO2), and dioctadecyl 3,3'-thiodipropionate (693-36-7, SAO3). The latter two are used especially for high-temperature application and for long-term stability of the polyolefins. The structures of these antioxidants together with common trade names are depicted in Figure 2. All other compounds listed under “PP-related antioxidants & antioxidant degradants” in Table VI are degradants formed, for example, after oxidation, ester cleavage, or other reactions of the abovementioned substances. These are
oxidized species of the secondary antioxidants: Tris(2,4-di-tert-butylphenyl) phosphate (95906-11-9, from SAO1), didodecyl 3,3'-sulphinylbispropionate (17243-14-0, from SAO2), and dioctadecyl 3,3'-sulphinylbispropionate (27141-32-8, from SAO3)
degradants due to ester cleavage: 2,4-Di-tert-butylphenol (96-76-4, from SAO1), 3,5-di-tert-butyl-4-hydroxyphenylpropionic acid (also fenozan acid, 20170-32-5, from PAO2 and PAO3), and 1-dodecanol (112-53-8, from SAO2)
degradants due to thioether cleavage: Octadecyl acrylate (4813-57-4, from SAO3), dodecyl acrylate (2156-97-0) and dodecyl-3-mercaptopropionate (6380-71-8) both from SAO2.

Structures of the primary (PAO) and secondary (SAO) antioxidants found with common trade names.

Degradants of SAO2 found in the GC-MS and LC-HRMS screening.
The fenozan acid ethyl ester (36294-24-3) is one type of artifact found, and it is easily formed after esterification of the free acid with the extraction solvent ethanol. Ethyl 3-mercaptopropionate (5466-06-8) is most likely formed after thioether cleavage and transesterification of the ester group with ethanol from SAO2 or SAO3. The degradants of the thioether cleavage reaction (point iii) are often observed in extractables studies of polyolefins doped with thiodipropionate derivatives. Their presence in the authentic reference standards was also confirmed by injection a highly concentrated standard. Most likely they are present as impurity in the original additive as well as being formed during processing (especially heating) and storage of the PP material. A reaction describing the formation of these degradants is the well understood reversible reaction between thiols and alkenes (26, 27).
The critical cell growth inhibitor bis(2,4-di-tert-butylphenyl)phosphate (bDtBPP, 69284-93-1) was only detected in two ethanol extracts in extreme low quantity near the LOQ of 0.01 μg/mL extract concentration, which is below the limit at which this substance can cause cell growth inhibition as described by Hammond et al. (28). This finding, even in low concentrations, confirms the findings from Hammond et al. that this compound is not only produced after gamma irradiation. The starting point is the oxidized form of SAO1—always present in SAO1 containing PP after heat impact (e.g., molding)—which then undergoes hydrolysis to form the bDtBPP. No bDtBPP was detected in the water extracts.
The common degradants for the abovementioned phenolic additives like 7,9-di-tert-butyl-1-oxaspiro[4.5]deca-6,9-diene-2,8-dione (82304-66-3) or 2,6-di-tert-butyl-1,4-benzoquinone (719-22-2) were not observed in any sample. Their formation in significant concentrations is typically correlated to a previous irradiation of the PP material containing antioxidants such as AO2 or AO3 (29).
Another group of compounds identified using GC-MS and LC-MS are the lubricants or releasing agents oleamide (301-02-0), erucamide (112-86-7), stearic acid (57-11-4, e.g., origin calcium stearate), or ethyl stearate (111-61-5) (30). Also, branched and linear alkanes were found and are frequently present in ethanol extracts (or other organic solvents) of polyolefins. These might be short oligomers produced during production, but more likely they are formed by the ongoing and unavoidable degradation reactions (chain scission) of the polymer chains.
Analytes that were assigned as potentially originating from the membrane were already partly discussed. One further confirmed compound was diphenyl sulfone (127-63-9), which is used as a high-temperature solvent for the polymerization reaction to the PES polymer (31). Additionally, short chain and or fragments of polyethylene glycol (PEG) derivatives—typical wetting agents—were observed in GC-MS screening.
The assignment of the laurolactam (947-04-6) found and its corresponding dimer 1,14-diazacyclohexacosane-2,13-dione (30204-68-3) to any particular component is not possible. Laurolactam is the starting material and is extracted from polyamide 12 “PA 12” (similar to caprolactam, which is usually observed as extractable from “PA 6”). Thus, this polymer must be present somewhere in the filter cartridges of supplier 5. The detected adipate and terephthalates are typical extractables from polyesters and can be attributed to this material group. The number of unknowns in the GC-MS chromatograms are remarkably low, indicating that most of the compounds are known and listed in the National Institute of Standards and Technology (NIST), literature, internal database, or can be derived and attributed to the different starting materials/molecules.
It must be mentioned that ethanol as an extraction solvent is not inert, and the formation of ethyl esters via (trans)esterification, for example, is possible and was observed. This is not necessarily disadvantageous and can, for example, be beneficial in detecting compounds like fenozan acid as its ethyl ester derivative (simply a derivatization). In the free acid form, fenozan acid would not be detectable by GC-MS. This of course must then be considered in interpreting the data and for the semi-quantification.
LC-HRMS Suspected-Target and Non-Target Screening
In addition to the target analysis by LC-MS, a suspect screening and a non-target screening was performed. LC screening using a high-resolution mass spectrometer has recently received tremendous attention in E/L investigations. Nonetheless, a thorough, non-target screening is still exceptionally time-consuming and relies heavily on the experience of the operator, the established internal and also external database, and also the processing software (32⇓–34). Contrary to an ideal scenario, even with the best method some peaks will still remain unknowns, which is almost unavoidable. The reason are (1) molecular ion remains unknown, (2) no or too many potential sum formulas can be calculated, (3) several hundred potential candidates can be attributed to one sum formula (35), or (4) the compound is not described in any database. One must remain aware that during a real chemical structure determination of an unknown, HRMS spectra are only one piece of the puzzle and further methods such as nuclear magnetic resonance, x-ray crystallography, and others are commonly applied. In addition, a semi-quantification, which is common practice for GC-MS with electron ionization, should not also be carried out for LC-MS with ESI and APCI ionization likewise. The ionization efficiencies and response factors can easily differ by a factor of 100 for structurally similar compounds, limiting even a semi-quantification via a more or less “similar” internal standard. To the best of our knowledge, there is no technical guidance or standard describing the analysis process in detail from non-target screening to structure elucidation for E/L studies, or even how to perform the non-target screening itself (i.e., method parameters). To overcome this, we established the following rational: Only the mass of the most dominant monoisotopic exact mass of the molecular ion adduct is reported, as not all analysis software algorithms can determine (and sometimes it is challenging to manually identify) the neutral monoisotopic mass. UV/Vis detection should be carried out in 3D full-scan mode from approximately 210–500 nm, and/or at fixed channels including around 220 nm. Usually, it can be observed that more or less all peaks detected in 3D full-scan mode are also present (frequently with a better response) at around 220 nm, an absorption wavelength of aromatic compounds (aromatic π-π* transitions). Therefore, we consider a wavelength of 220 ± 5 nm as most reasonable for detecting unknown UV active substances that might not or are only weakly ionized by ESI or other sources. For interpreting the chromatograms a visual comparison of the base peak ion (BPI) chromatogram is performed, and peaks are recognized as sample-related peaks when they exceed the blank response by 50%. Note that in the BPI representation, polymeric substances (wetting agents) can be suppressed completely due to the absence of an intense main peak (peak distribution), and they can only be detected in the total ion chromatogram (TIC). In the method applied the eluent additive ammonium acetate was used, which might be considered an all-purpose additive that allows sufficient detection of acidic (e.g., phenolic antioxidants), neutral, and basic compounds all at the same time (36). Formic acid was not used as an eluent additive because sensitivity to phenolic targets decreases dramatically for the system used. A positive aspect is that only one LC method is needed, and thus the same retention times of the compounds are observed for both ionization modes (the mass spectrometer used can run in one mode during measurement). A summary of the results of the suspect target and the non-target screening for the most intense peaks in the mass and UV/Vis chromatograms are given in Table VII. As this information is quite unique and supplier-dependent, an assignment of the compounds to a filter cartridge vendor is not reported. Because the water extracts did not reveal any major additional signal besides to the targeted molecules, the results of the ethanol extracts are given. Compounds identified showing a strong signal were, for example, (a) antioxidant degradants like the already mentioned oxidized forms of SAO2 and SAO3 or pentaerythritol tris(3,5-di-tert-butyl-4-hydroxyhydrocinnamate) (84633-54-5) from AO2 after ester cleavage, (b) additional antioxidant tris(4-tert-butyl-3-hydroxy-2,6-dimethylbenzyl) isocyanurate (40601-76-1), (c) other processing aids or additives like palmitic acid (57-10-3), or (d) clarifying agent such as the sorbitol-based 1,3:2,4-bis(3,4-dimethylobenzylideno) sorbitol (135861-56-2). In three samples a HALS hydrolysis product, 1-(2-hydroxyethyl)-2,2,6,6-tetramethyl-4-piperidinol (52722-86-8), was found; it is commonly observed as a degradant from USP plastic additive 11 (65447-77-0). Additional degradants of SAO2/SAO3, for example, with a higher oxidation of the sulfur or after disulfide formation as described in a very comprehensive publication by Beißmann et al. (26), were not found in a reliable signal quality. All these analytes listed in Table VII are not necessarily seen as peaks in the BPI, but they are found during the developed internal suspect screening performed by the software algorithm and, if commercially available, the reference compound was measured for confirmation. One main peak visible in UV/Vis and hardly in the mass chromatograms was attributed to diphenylsulfone, which was already detected in GC-MS. Furthermore, all UV/Vis chromatograms exhibit the same three peaks certainly assigned to the PES membrane material (see Figure 4; also confirmed by only extracting common PES used for membrane manufacturing). The mass spectra of these strong UV/Vis signals are difficult to interpret. They show several mass peaks with a high intensity. It is assumed so far that these are due to linear oligomers of the PES material (trimers to pentamers). Peaks of the acetate derivatives with the typical loss of water as fragmentation reaction can be observed for the suggested structures. For the potential linear trimer derivative the following signals are observed: m/z = 755.073 and 758.047 low collision energy (CE) and 695.052 high CE. Signals are only detected in ESI negative ionization only in accordance with a phenolic moiety(ies). Also, the strong UV/Vis absorption observed would be explained by the structure due to the presence of aromatic groups. The assignment remains confident because no reference materials are available (further chemical structure determination is underway). The cyclic version of these oligomers can likely be excluded, as they would not be ionized in ESI negative polarization mode.
Example of the LC-HRMS Suspect and Non-Target Screening Results of the Major Peaks in the Ethanol Extracts

LC-UV/Vis chromatogram (insert showing region 4.5 to 10 min) of the ethanol blank (black) and a typical ethanol sample (blue). The long run time is used because one known target (SAO3) elutes at 35 min.
In all samples a strong early eluting and broad peak or peak pattern at varying retention times is clearly observed (BPI and/or TIC). From the peak pattern (repeating units) or the retention time toward a standard, these peaks were identified either as based on polypropylene glycol (PPG) or polyethylene glycol (PEG) (see Figure 5) or as polyvinylpyrrolidone (PVP) copolymer, respectively.

LC-HRMS BPI chromatogram (ESI-positive) of the water extract of filter cartridge 2; the inlet shows the different assigned PEG homologues.

FT-IR spectra of the NVR of the ethanol extract of the filter of filter cartridge 2.
ICP-MS Trace Metal Analysis
Elemental analysis of the water samples was carried out to verify the absence of any element listed in ICH Q3D (December 2014) and to further characterize the extractables profile. The main outcome of the analysis is that no critical class 1 and 2 element was found in any of the extracts. Only in one sample was nickel (class 2A) detected in low amounts (extract concentration 20 ng/mL). Of course, typical elemental extractables such as zinc, calcium, or magnesium (e.g., from stearate mold releasing agents); silicon or boron (laboratory glass ware); and sodium have been measured in amounts <1 μg/mL. As these are of no concern and are ubiquitously present, they were not further specified and assigned to any filter cartridge.
Extractable Profile Mass Balance
In 2014, Jenke et al. described the use of TOC as a sum parameter to check the completeness of an extractable profile. For this purpose, the mass balance was calculated from the measured TOC as a function of the calculated sum TOC of the individual extractables obtained during the screening analysis; for details on the calculations, see the original publication (15). If extractables were found in more than one technique the highest concentration was used, and for unknowns a carbon fraction of 0.6 was assumed. The results (Table VIII) showed that the “completeness” of the extractable profiles are on the upper level for the TOC reconciliation for sterile filters compared to results from the literature (TOC “reconciliations” from approximately <5 to 40%).
Mass Balance of the Sum TOC Obtained for the Different Analytical Techniques versus the Parameter TOC Measured
Only for one filter cartridge the reconciliation was only 4%. The main question that arises is, what are these missing extractables and how can they be found and qualified? Complementary techniques that might give additional quantitative information are, for example, size exclusion chromatography for the polymeric compounds such as the hydrophilizing agents, but also ion chromatography for low molecular weight organic acids, which are not easily detected by GC-MS. Also, nuclear magnetic resonance spectroscopy, as described in the literature, might be used to determine rinsibles from polyvinylidene fluoride membrane filters (38). From a qualitative perspective, there are techniques providing additional information which all must be gathered together and considered holistically in order to verify the type of TOC that is “missing” as the best possible approach. In our study the TOC not detected or quantified by single-substance analytics such as GC- and LC-MS are very likely the hydrophilizing agents. They can easily be seen in the LC-HRMS chromatograms of the water extract (see Figure 5 showing PEGs in an extract of filter cartridge vendor 2). A correlation to the FT-IR spectrum obtained of the NVR of the ethanol extracts of the same cartridge is reasonable because the hydrophilizing substances are non-volatile, obviously present in significant amounts, and also soluble in ethanol. The FT-IR spectrum mainly showed typical absorptions bands that can be assigned to —OH- stretching vibrations of an alkyl alcohol (3600 to 3200 cm–1), —CH2- and —CH3-stretching vibrations of an aliphatic alkyl (≈ 2870 cm–1), the —C=O-stretching vibration of a carboxylate ester or amide (≈1660 cm–1), and the —C—O—C-bending vibration of an alkyl ether (≈ 1100 cm–1) group. This is in accordance with the LC-HRMS analysis and the presence of PEGs and caprolactam as dominating substances. Single analytes in low amounts can of course not be identified by FT-IR; nonetheless, the information obtained should be used as additional information to identify the main component(s). Similar observations were made for the other filter cartridge extracts.
Eventually, it is not probable, and—supposing one knows what the missing TOC is—it is maybe not needed that an E/L study of filter cartridges will result in a TOC reconciliation of 100% on a quantitative level using standard chromatographic analytical methods.
Conclusion
The extractable profile of six filter cartridges using a variety of analytical techniques was compiled. Volatile compounds such as residual solvents were identified by headspace GC-MS analysis. Typical polyolefin-related additives such as releasing agents or antioxidants and their degradation products were found in the ethanol extracts of all filter cartridges using GC-MS and LC-MS. All these compounds in the original, undegraded form are known, accepted, and specified plastic additives in the USP <661.1> or Ph. Eur. 3.1.13. The extractables from the membrane were basically similar for all vendors, with the exception of some specific compounds such as caprolactam or diphenylsulfone due to slight differences in the polyethersulfone and membrane production processes. Some PET-related extractable were found for one of the filter cartridge examined. ICP-MS did not detect any critical elements classified as class 1 or 2, except in one example were Ni was found in low quantity. The hydrophilizing agents found were PEG or a PVP copolymer. They are widely used as inert and non-toxic excipients in the food and pharmaceutical industries. Generally, the levels of the quantified single analytes for the water extracts were below 0.1 μg/cm2 (exceptions are the residual solvents and caprolactam). No substance of very high concern—as referred to in Annex XIV of REACH (16 June 2017)—or any substance with a high associated risk—see Jenke and Carlson (39)—was found in any of the extracts.
Conflict of Interest Declaration
The authors declare that they have no conflict of interest.
- © PDA, Inc. 2018


