
Abstract
Cytotoxic drugs can be encapsulated in liposomes vesicles, which act as drug delivery vehicles and reduce the risk of exposure of drug to healthy cells. The sterility of such liposome solutions is typically ensured using 0.2 μm–rated sterilizing-grade membranes, but due to the high viscosity and low surface tension of these formulations, they can cause premature blocking and increased risk of bacterial penetration through a 0.2 μm sterilizing-grade membrane. The low surface tension of liposome solutions affects the contact angle with membrane and reduces bubble point, leading to bacterial penetration through the membrane. This poses a great challenge to select an appropriate sterilizing-grade membrane for a given process and for filter manufacturers to develop a sterilizing-grade membrane that specifically addresses these needs. In this study, the influence of different variables that could affect the total throughput and bacterial retention performance of different membrane types on processing of liposome solutions was evaluated. Based on the results, we conclude that the membrane properties, for example, surface porosity, surface tension, pore size, symmetry/asymmetry, hydrophilicity and liposome properties (e.g., composition, lipid size, and concentration) affect bacterial retention and total throughput capacity. Process parameters such as temperature, pressure, and flow should also be optimized to improve process efficiency.
LAY ABSTRACT: Cytotoxic drugs can be encapsulated in liposomes vesicles, which act as drug delivery vehicles and reduce the risk of exposure of drug to healthy cells. Liposome solution cause premature blocking and increased risk of bacterial penetration through a 0.2 μm sterilizing-grade membrane due to their high viscosity and low surface tension. In this study, we demonstrated the total throughput and bacterial retention performance of different sterilizing-grade membranes with liposome solution. Based on the results, we conclude that some sterilizing-grade membranes yield less throughput and bacterial retention compared to other membranes. This is due to liposome formulation and membrane properties. Therefore, it is important to identify the product formulation and membrane properties before selection of a suitable sterilizing-grade filter for a given process application to ensure expected throughput and bacterial retention.
Introduction
Cytotoxic drugs can be encapsulated in liposomes vesicles, which act as drug delivery vehicles and reduce the risk of exposure of drug to healthy cells (1). The sterility of such liposome solutions is typically ensured using 0.2 μm–rated sterilizing-grade membranes, but due to the high viscosity and low surface tension of these formulations, they can cause premature blocking and increased risk of bacterial penetration through a 0.2 μm sterilizing-grade membrane (2). The low surface tension of liposome solutions affects the contact angle with membrane and reduces bubble point, leading to bacterial penetration through the membrane. This poses a great challenge to select an appropriate sterilizing-grade membrane for a given process and for filter manufacturers to develop a sterilizing-grade membrane that specifically addresses these needs.
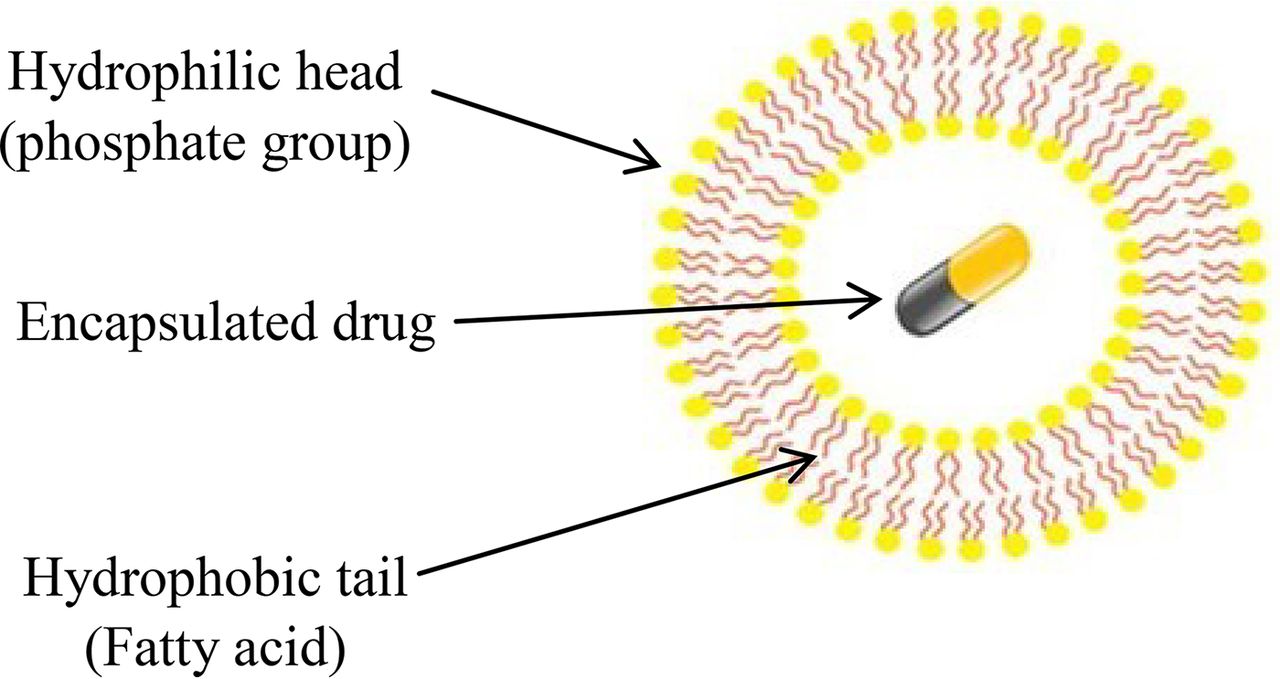
Adjuvants are commonly used in vaccine and other drug formulations to enhance the immune response to an antigen and to increase the therapeutic response. Novel adjuvants are often based on emulsions or liposomes, which are suspensions of small droplets made up of surfactant or lipid particles. In general, liposomes are lipid vesicles used as vehicles for the administration of cytotoxic drugs with enhanced clinical efficacy and reduced toxicity (3). Unlike micelles that encapsulate the drug with a single lipid monolayer, liposomes contain phospholipids and cholesterols as their components that form a phospholipid bilayer, which encases the drug (4) (Figure 1).

Structure of liposome.
Liposomes exist as either small unilamellar or multilamellar vesicles, and their size usually varies from 20 nm to 3 μm. The external surface of liposome vesicles can be modified to enhance the attachment of liposome vesicles to target sites for drug delivery. There are three generations of liposomes that can be identified based on their surface modifications:
First Generation Liposomes: These are conventional liposomes and are non-PEGylated.
Second Generation Liposomes: These are PEGylated liposomes with reduced toxicity.
Third Generation Liposomes: PEGylated liposomes with targeted ligands on their surface.
In this study, filterability and bacterial retention trials were conducted with different sterilizing-grade membranes from different membrane manufacturers using a non-PEGylated liposome solution prepared by an independent laboratory.
Materials and Methods
Materials
1. Test Membranes:
Shown in Table 1.
List of Single-Use Pleated Membranes [Effective Filtration Area (EFA) = 150–230 cm2]
2. Membrane Specifications:
Shown in Table 2.
Pore Size Rating and Membrane Configurations
3. Media and Chemicals.
List of Media and Chemicals
4. Liposome Solution:
The liposome solution used for throughput studies was a non-PEGylated, multilamellar liposome having size of 0.05–0.1 μm and composed of cholesterol and 1, 2-distearoyl-sn-glycero-3-phosphoethanolamine (DSPE). The liposome solution was pre-filtered through a Sartoclean (3 μm + 0.8 μm)-rated two-layer membrane filter and used for the trials. This pre-filtration removed large multilamellar vesicle aggregates and provided a uniform distribution of liposome molecules. For filterability and bacterial retention studies, the liposome solution was diluted to 10 mg/mL using an isotonic solution of sucrose and ammonium sulphate. The liposome solution was diluted to 10 mg/mL in order to have more filtrate volume and therefore reduce systematic errors, as high concentrations of liposome cause premature blocking of membranes.
Methods
1. Surface Porosity Measurement:
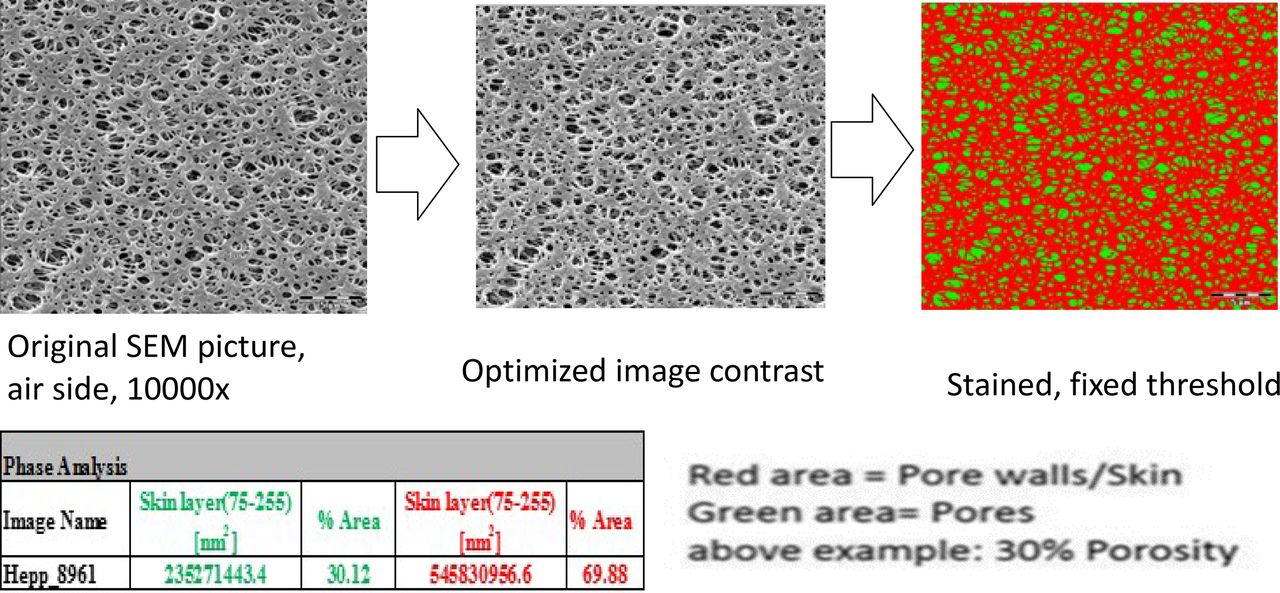
The surface porosity of both 0.1 μm– and 0.2 μm–rated sterilizing-grade membranes (Table I) was determined. The surface porosity of a membrane indicates the number of open pores available on the upstream surface of membrane. The measurement was done using the image-processing software “Scandium”. This image-processing software was used in conjugation with a scanning electron microscopy (SEM) image of the membrane to convert the image into red and green areas. The green area represents membrane pores, and the red area is the the solid polymer structure of the membrane. The software measures the percentage of red and green area in the polymer, and the percentage of the green area is referred to as the surface porosity of the membrane. The color combination of area can be changed in the Scandium software as shown in Figure 2 with the red and green areas.

Estimation of surface porosity using Scandium image processing software.
2. Surface Tension Measurement:
The surface tension of all membranes (Table I) was measured; this represents the variation in intermolecular forces of molecules on the membrane surface. Surface tension measurement is done by the calcium chloride drop test method. Each concentration of calcium chloride salt solution has a defined surface tension at 25 °C temperature as given in Table IV.
Standard Calcium Chloride Concentration versus Surface Tension
A drop of a particular concentration of calcium chloride with respective surface tension is placed on the membrane, and the concentration of calcium chloride that wets the membrane immediately is considered as the surface tension of the membrane.
3. Bubble Point Measurement:
The integrity of membranes was evaluated in terms of the bubble point test using a Sartocheck® integrity tester. In brief, the bubble point test is performed on wet filter membranes where the wetting liquid is held inside the porous structure by capillary forces. This force increases as the pore size decreases. A specific gas pressure dependent on the pore size of the membrane is necessary to force out the liquid from the pores. This is called the bubble point. The test parameters for bubble point measurement of each membrane type are given in Table V.
Test Parameters for the Bubble Point Test
4. Water Flow Rate Measurement:
Water flow rate was measured for each membrane type by using reverse osmosis (RO) water. The test membrane was connected after flow meter and flow rate was performed at a differential pressure of 1.0 bar in duplicate measurements. The test membrane was wetted for 5 min at 0.3 bar differential pressure before flow measurement to ensure no air bubbles are entrapped in membrane pores which can influence the water flow measurement.
5. Throughput Test Method:
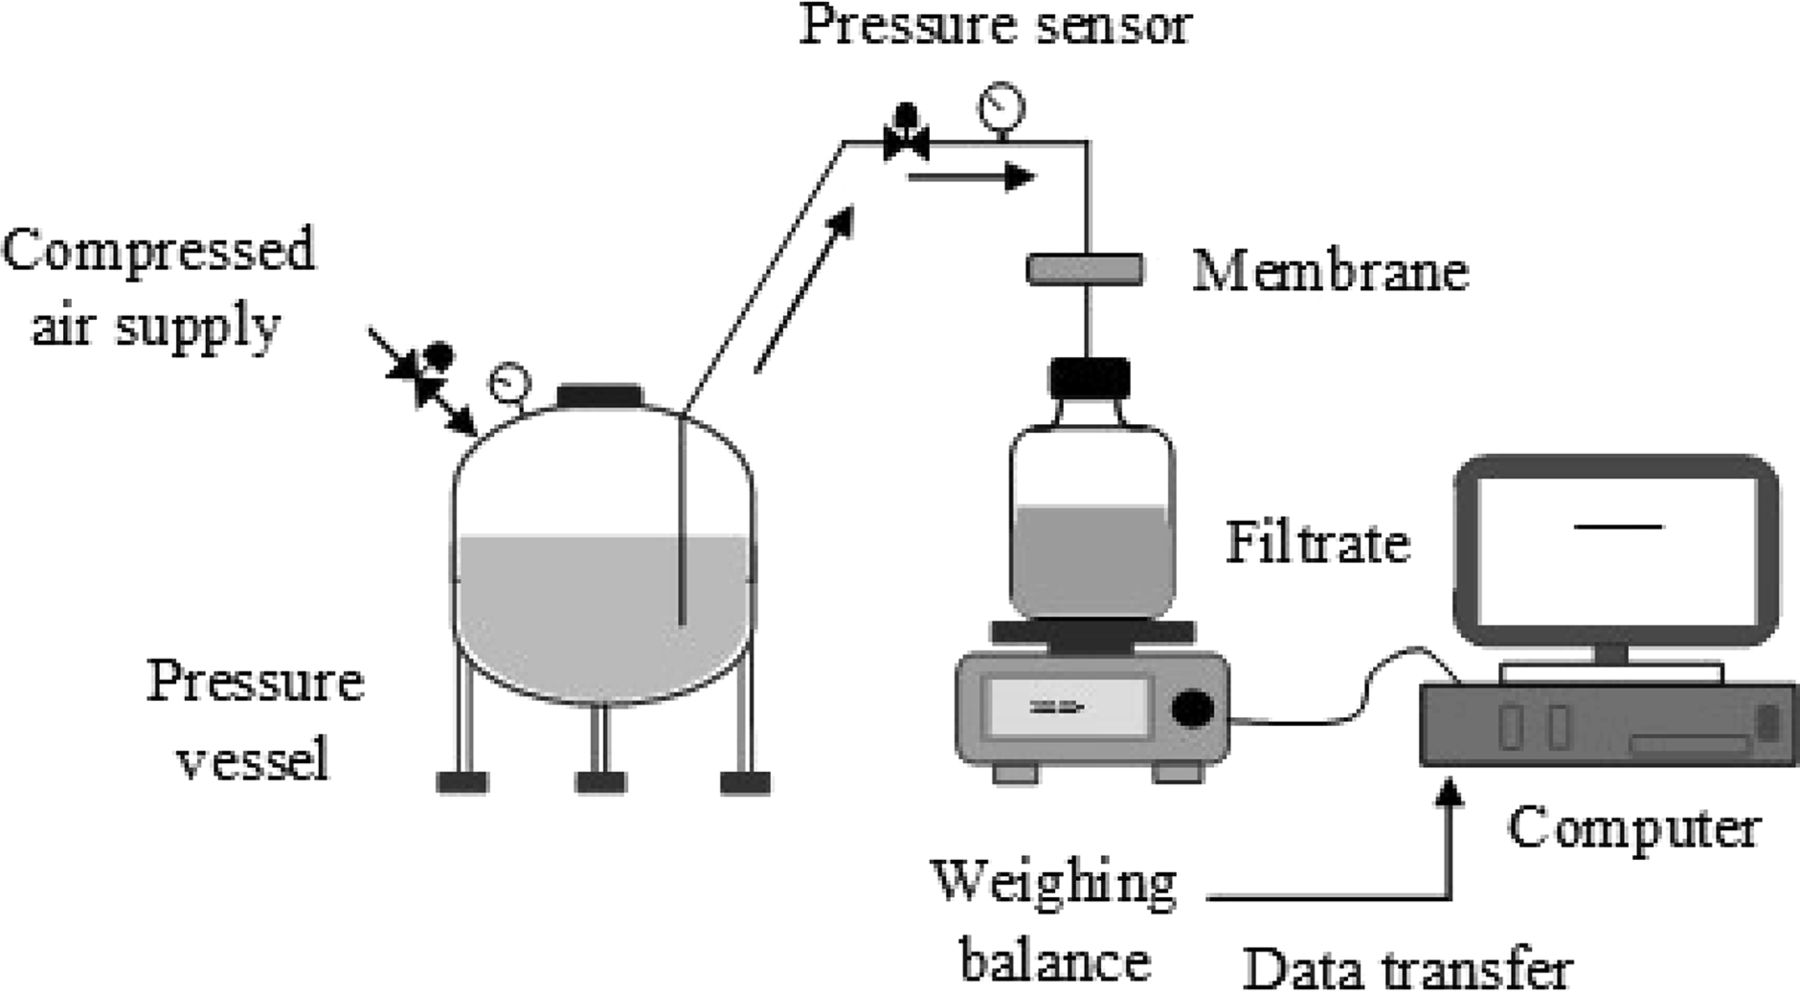
The throughput of both 0.1 μm and 0.2 μm sterilizing-grade membranes was evaluated at a constant pressure of 2.0 bar using single-use process-scale pleated membrane devices [effective filtration area (EFA): 150–230 cm2]. The criterion for defining membrane blocking was when the flow rate dropped to below 20% of the initial flow. All the data was collected by using the multi-total throughput system shown in Figure 3.

Test setup for throughput studies.
6. Bacterial Challenge Test (BCT) Method:
• Preparation of Test Culture
A Brevundimonas diminuta culture ATCC No 19146 was prepared by inoculating 1 mL of pre-culture in 100 mL of saline lactose broth (SLB) medium and incubating for 24 h at 30 ± 2 °C. The optical density (OD) of the suspension was measured using a spectrophotometer at 590 nm to ensure a minimum of 5 × 10⁸ cfu/mL. This was used as the bacterial test suspension.
• Bacterial Challenge Test (BCT)
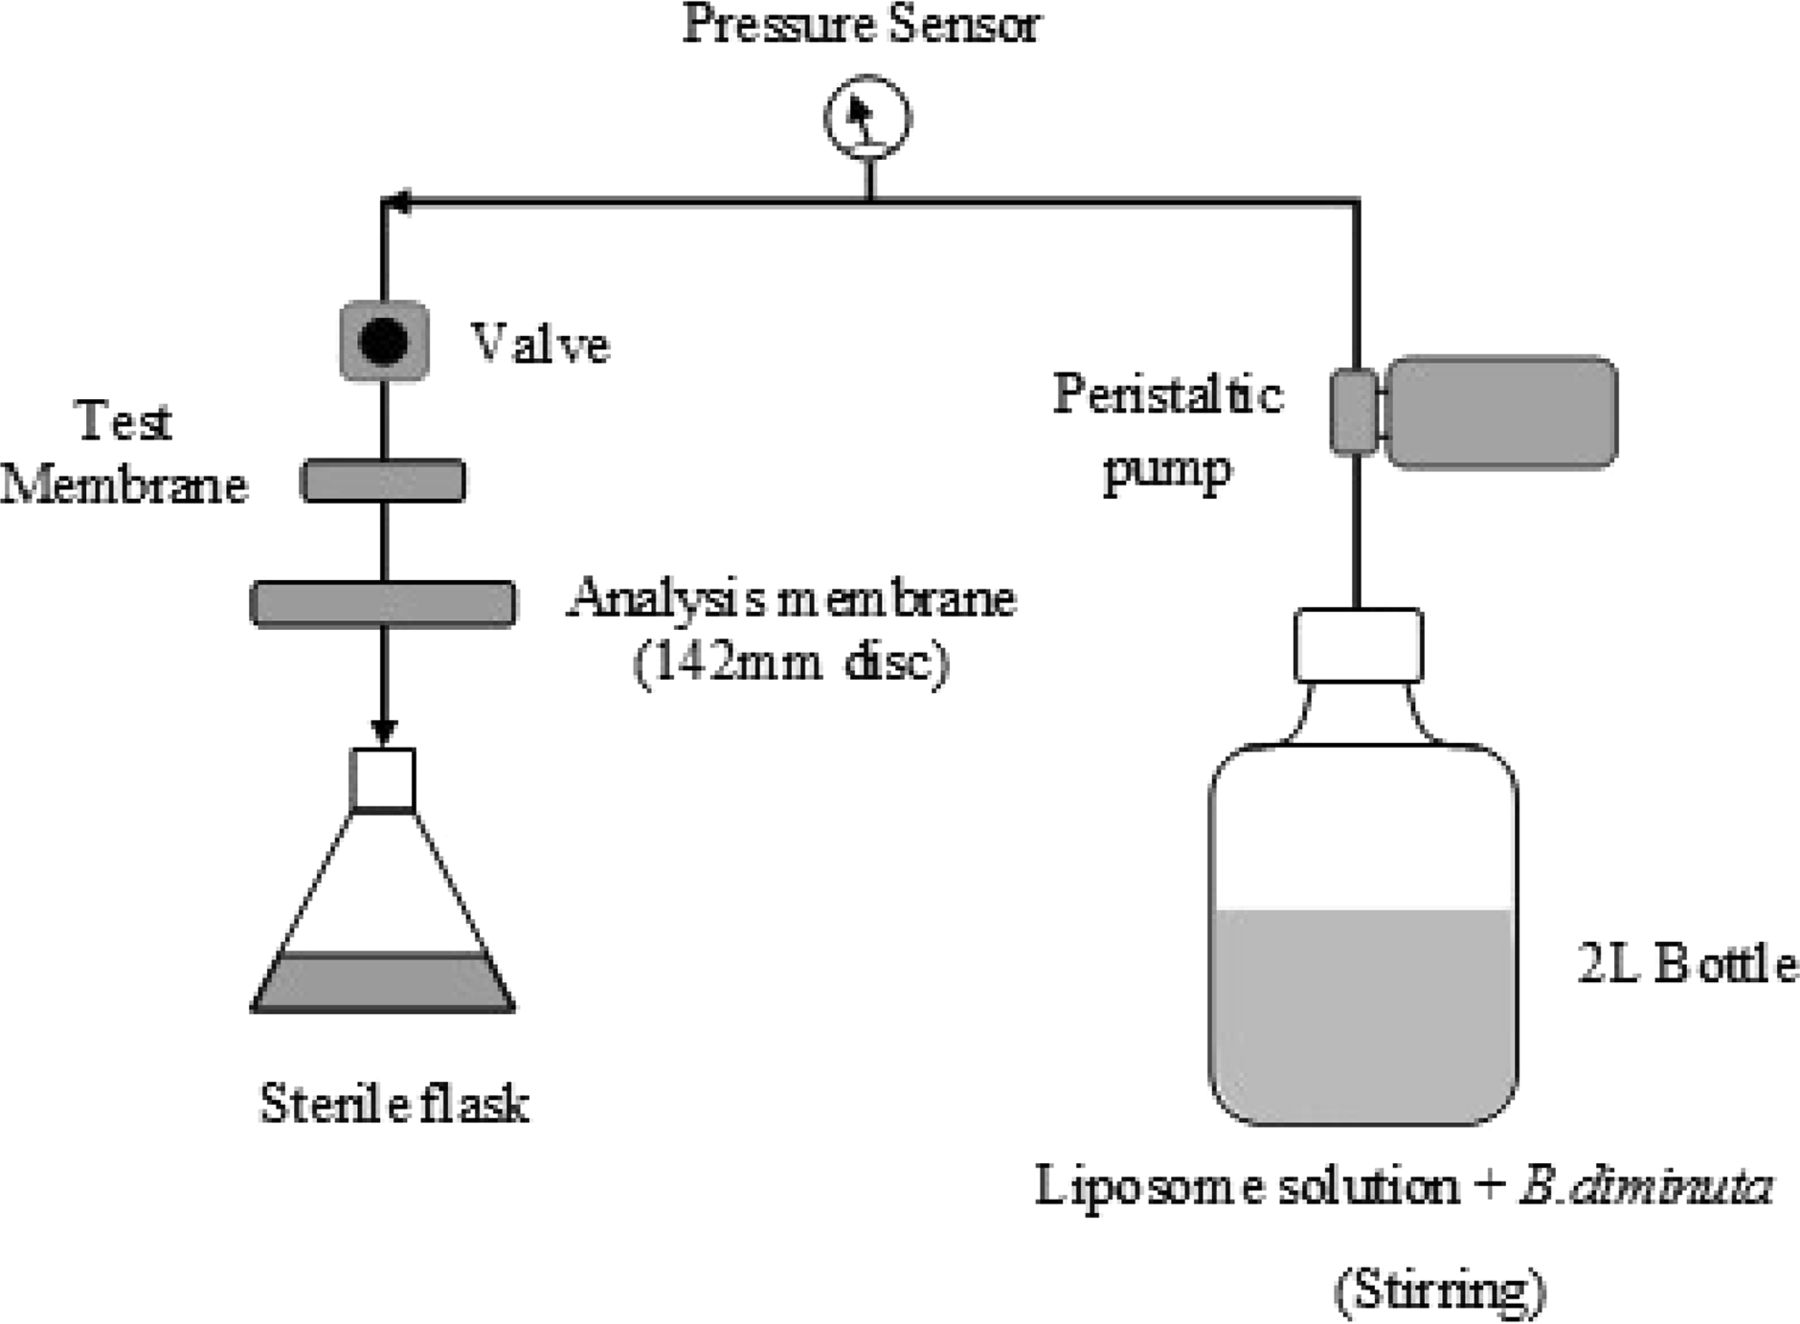
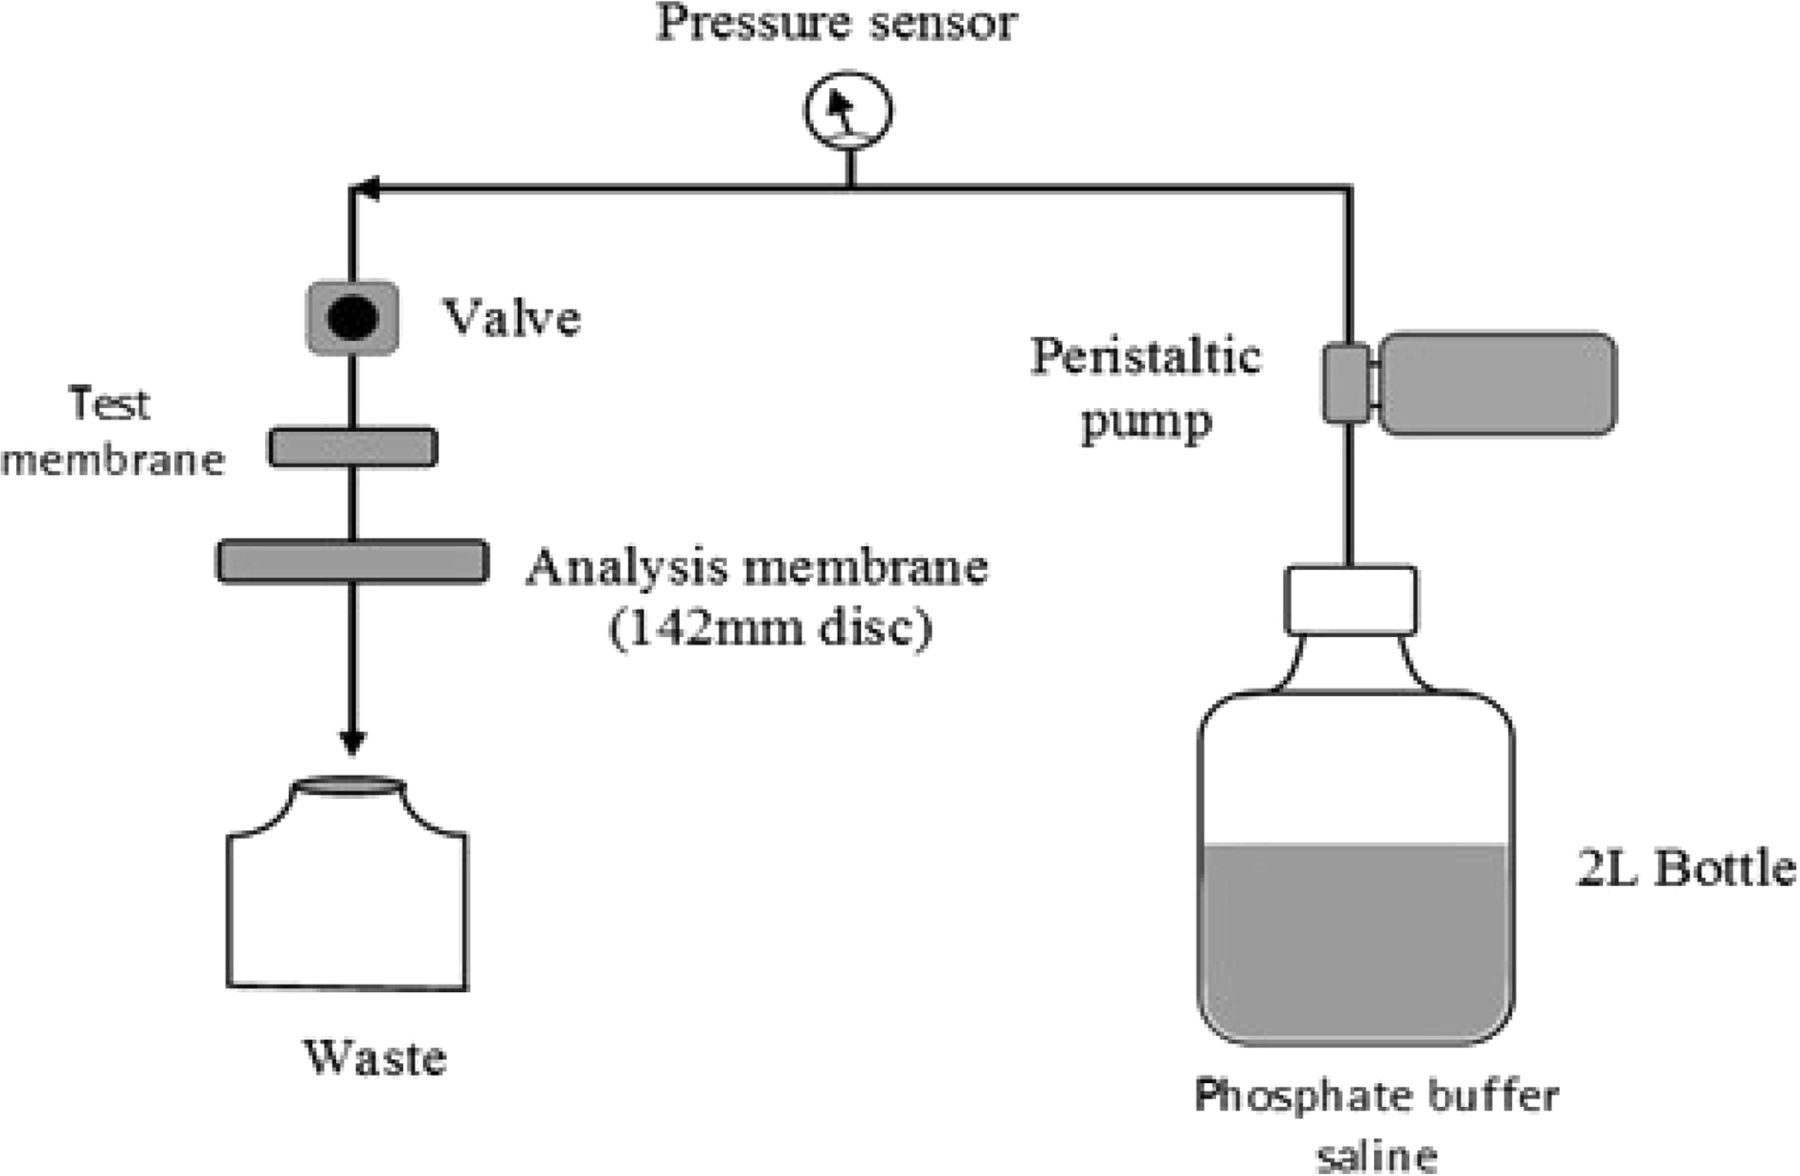
Prior to the BCT, a viability test was performed over a 30 min interval to confirm the viability of B. diminuta in liposome solution. Bacterial challenge test was performed in duplicates in single-pass filtration mode at room temperature (25 ± 2 °C) and at a differential pressure of 0.5 bar using a peristaltic pump. The pressure was monitored using manometers. All test membranes were single-use pleated devices (150–230 cm2) and were challenged with 1 × 10⁷ cfu/cm2 using the BCT setup as depicted in Figure 4.

Test setup for the bacterial challenge test (BCT).
The filtrate was collected in a sterile flask. Each membrane was flushed with 5 L per 150 cm2 membrane area using 1× phosphate-buffered saline (PBS) buffer after the BCT to remove the product from the membrane followed by water flushing. This was performed so that the product does not interfere with the bubble point measurement of membranes post-BCT. The test equipment for flushing is illustrated in Figure 5.

Flushing setup for the bacterial challenge test (BCT).
A sample was collected from the challenge suspension reservoir upstream of the test membrane to determine the titer pre- and post-challenge. A sample of main culture suspension was also evaluated for cell dispersion. The analysis membranes were aseptically transferred on tryptic soy agar (TSA) plates and incubated at 30 ± 2 °C for 3–5 days. The post-BCT bubble point of the test membrane was determined.
Results
1. Surface Porosity Measurement
The upstream surface porosity of each membrane combination, which includes the first layer and second layer of membrane, was calculated in terms of percentage surface porosity using the image-processing Scandium software and is given in Table VI.
Percentage Surface Porosity of Membrane Combination
In order to receive a parameter considering both membranes of a dual-layer membrane combination, a mean porosity of the two respective layers was calculated. The surface porosity of membrane combination is highest in Membrane H followed by Membranes G, B, C, A, E, F, and D (Table VI).
2. Surface Tension Measurement
The surface tension of membranes was measured using the calcium chloride drop test method, and the results are summarized in Table VII in terms of millinewtons per meter (mN/m).
Surface Tension of Membrane Combination
In order to receive a parameter considering both membranes of a dual-layer membrane combination, a mean surface tension of the two respective layers was calculated. Membranes A, B, and C have overall low surface tension compared to Membranes D, E, F, G, and H (Table VII). Hydrophilic surface modifications increase the surface tension of the membranes irrespective of their material of construction. Therefore, Membranes D, E, F, G, and H, which are surface-modified, have higher surface tension in comparison to Membranes A, B, and C, which are not surface-modified. As we measure the surface tension of membrane with defined concentrations of calcium chloride, we observe that surface-modified membranes (higher hydrophilicity) are spontaneously wettable within 1 s by higher concentrated calcium chloride solutions than non-surface-modified membranes (lower hydrophilicity). The higher the concentration of the calcium chloride salt solution that is able to spontaneously wet the membrane, the higher the hydrophilicity of the sample membrane. It is a qualitative test, which is useful to identify trends between different membrane samples.
3. Bubble Point Measurement
Bubble point measurement of test membranes was performed at 25 °C using RO water as a wetting medium. The bubble point values were measured with Sartocheck® integrity tester. The bubble point values are illustrated in Table VIII.
Bubble Point (bar) of Membrane Combinations
The bubble point value of each membrane was correlated to the mean flow pore size value. The mean flow pore size is determined by applying gas pressure to the upstream side of a liquid-filled membrane, said gas pressure gradually displaces the liquid from the pores, and increasing gas flow occurs at increasing gas pressure, which is measured versus the pore size. The mean flow pore size is the pores size of mean flow occurring in this test procedure. The mean flow pore sizes and the nominal pore sizes of the membranes are given in Table IX.
Mean Flow Pore Size (μm) of Membrane Combinations
As the bubble point increases, the mean flow pore size decreases because the membrane pore diameter decreases and membrane pores become tighter (Tables VIII and IX). For example, Membrane C has least mean flow pore size value of 0.204 μm in the second layer compared to other membrane types, and it has the highest bubble point value of >6.0 bar (Table VIII).
4. Water Flow Rate Measurement
Water flow rate of each membrane type was measured at a differential pressure of 1.0 bar using a liquid flow meter, and flow was normalized to LMH (liters per square meter) as given in Figure 6.

Water flow rate of 0.1 μm and 0.2 μm sterilizing-grade membrane combination at 20 °C.
Membrane B exhibits the highest water flow rate compared to other membrane types, whereas Membrane C display lowest flow rate. Water flow rate depends upon the hydrodynamic resistance caused by the membrane combination (Figure 6).
5. Filterability Studies
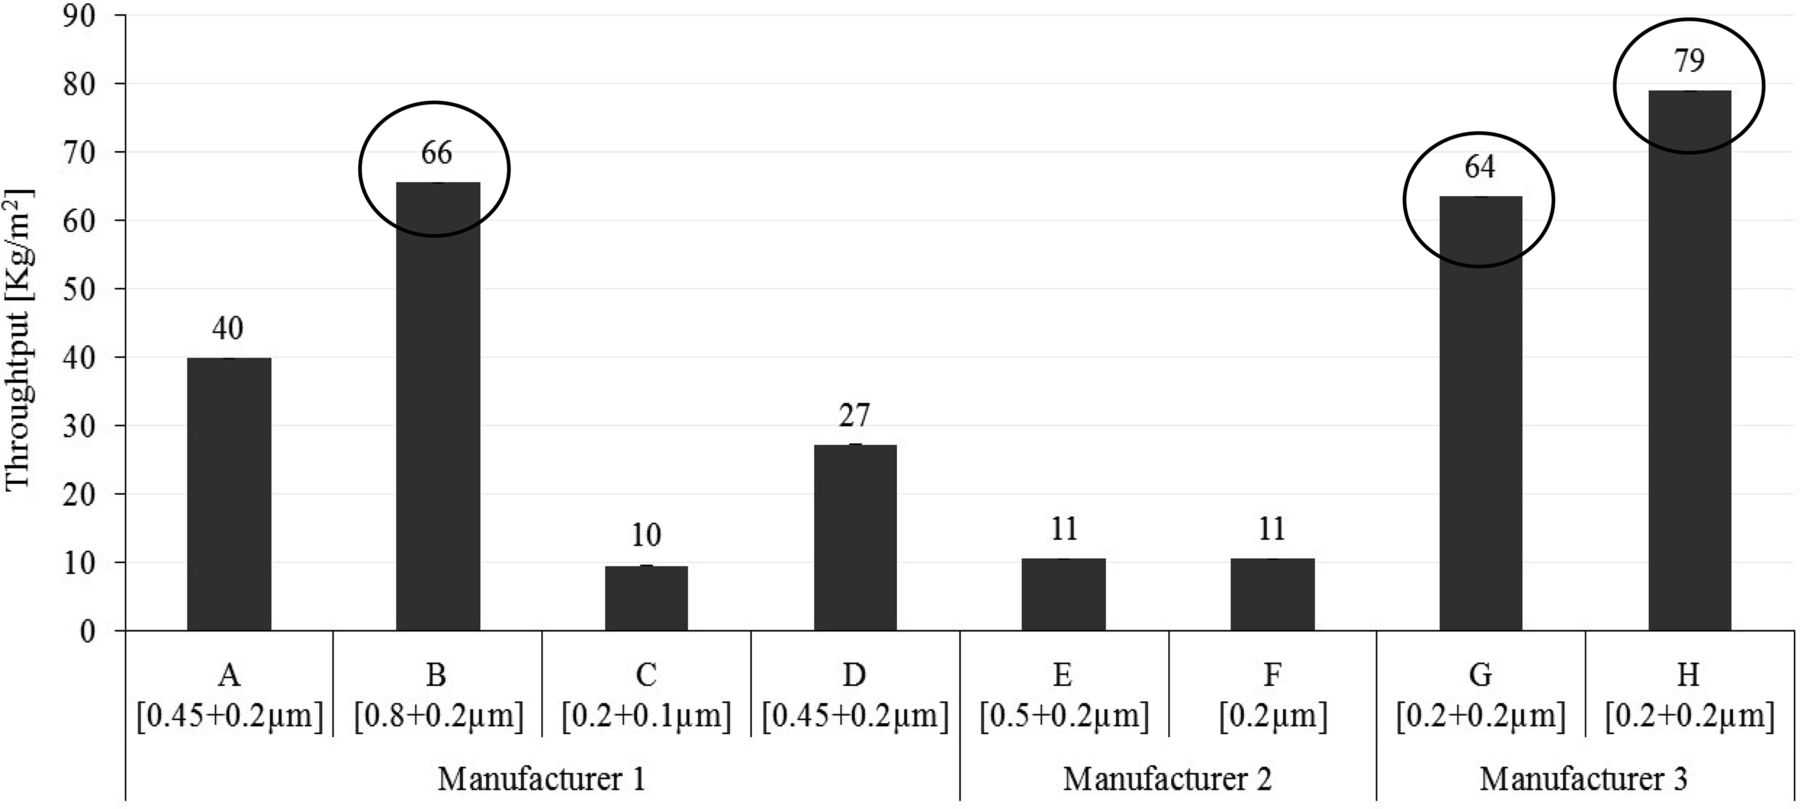
Initial throughput feasibility studies were conducted using a 34 mg/mL concentration of liposome solution and caused premature blocking (data not shown here). Therefore, the solution was diluted using an isotonic solution of sucrose and ammonium sulphate to 10 mg/mL concentration and used for throughput trials. Throughput studies were performed using seven different 0.2 μm–rated and one 0.1 μm–rated sterilizing-grade membranes at a constant pressure of 2.0 bar. The filtrate data was collected using Multi Total Throughput Software at 80% blocking criteria, and normalized throughput data in terms of kilograms per square meter (kg/m2) is depicted in Figure 7.

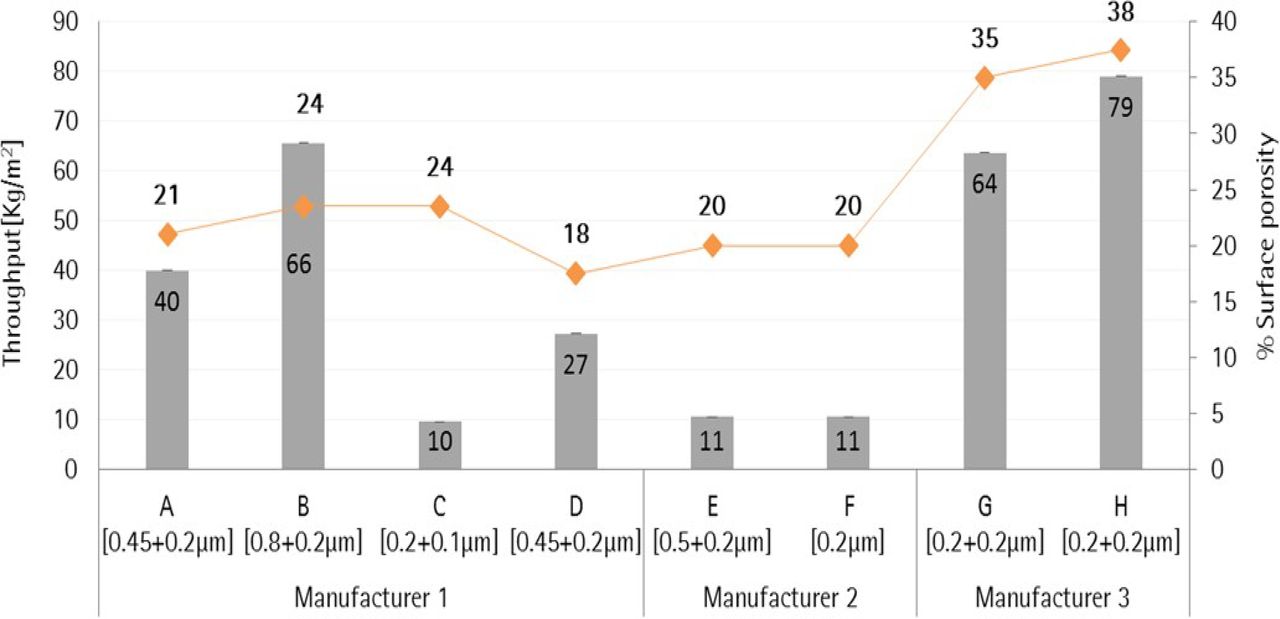
Total throughput of 0.1 μm and 0.2 μm sterilizing-grade membrane combination with liposome (10 mg/mL).
As depicted in Figure 7, Membrane H yields highest throughput followed by Membrane B and Membrane G when filtering a 10 mg/mL liposome solution. Membranes H, G, and B have high throughput results with liposome solution due to high surface porosity of their membrane combinations. Membrane H yields 19% high throughput compared to Membrane G because of 3% higher surface porosity (38%) in Membrane H compared to Membrane G (35%) in the 0.2 μm–rated membrane combinations. In contrast, Membrane B yields the next highest throughput although the surface porosity of Membrane B is 24%.This enhanced throughput in Membrane B is due to its largest pore-rated 0.8 μm first-layer membrane. This indicates that high surface porosity and a large pore size-rated first layer membrane of a sterilizing-grade membrane combination help in increasing throughput capacity with liposome-based formulations. However, no significant effect of membrane configurations (Table II) was observed in enhancing throughput with liposome solution. For example, membrane E yields up to 87% lesser throughput compared to Membrane B, G, and H even though it has a highest grade of 0.5 μm–rated asymmetric first-layer membrane. Furthermore, Membrane C, a 0.1 μm–rated membrane, yields comparable throughput to 0.2 μm–rated Membranes E and F due to high surface porosity in its membrane combination (21%), which is similar to the surface porosity (20%) of Membranes E and F.
Bacterial Retention Studies
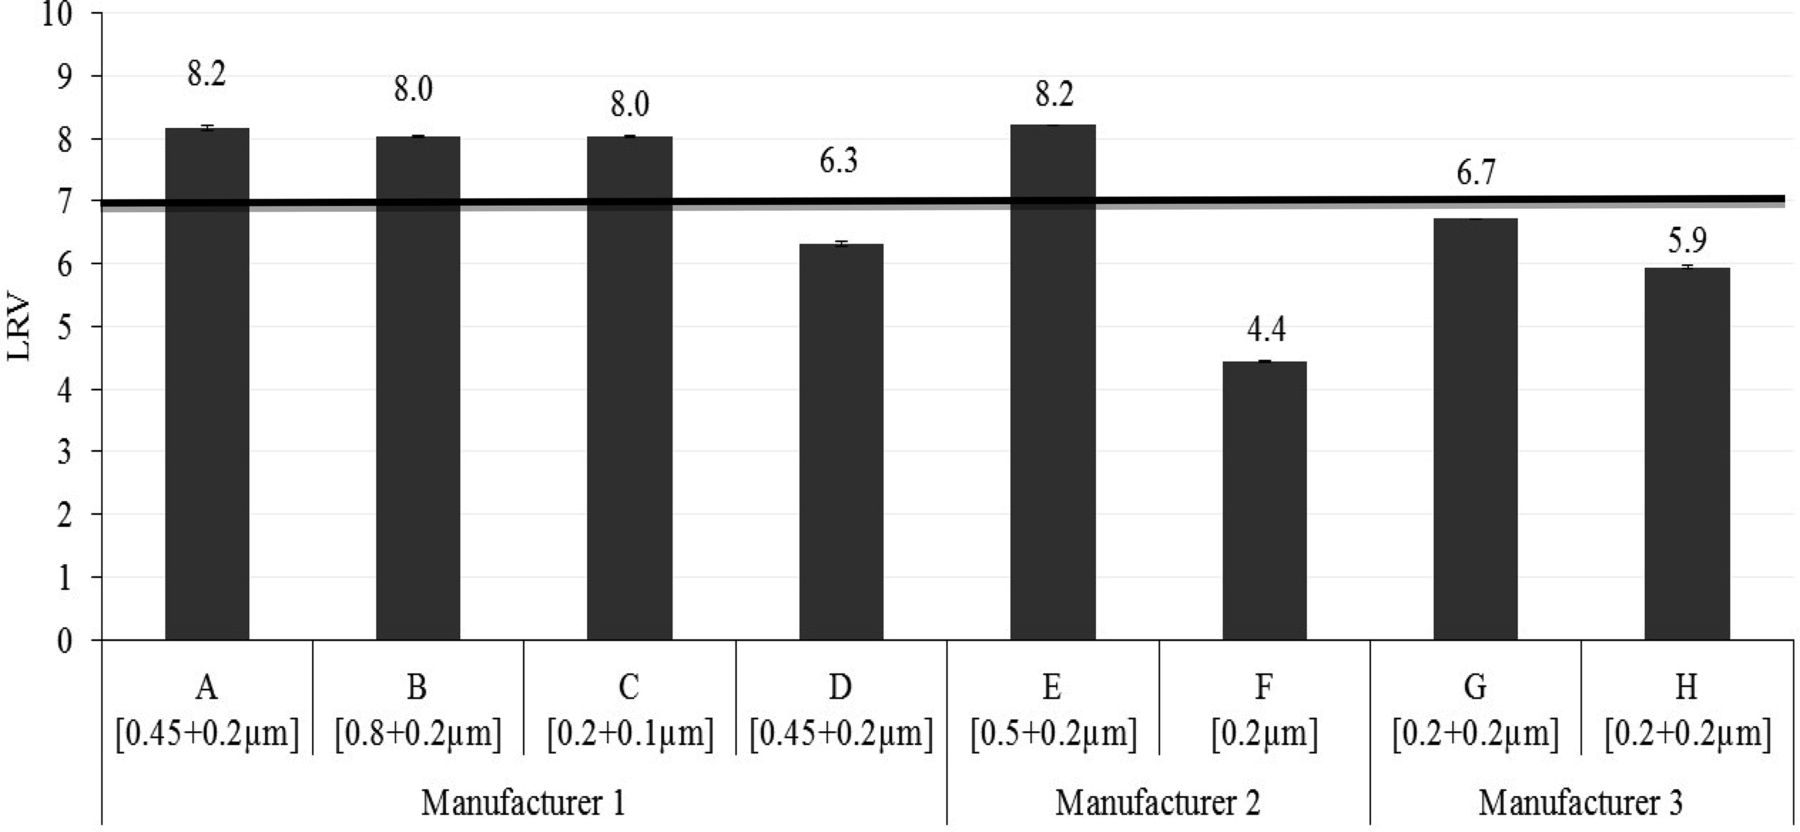
The BCT was conducted with seven different 0.2 μm and one 0.1 μm sterilizing-grade pleated membranes (EFA 150–230 cm2) using 10 mg/mL liposome solution in single-pass filtration mode to reach a minimum challenge level of 1 × 10⁷ cfu/cm2 at a differential pressure of 0.5 bar. The bacterial retention performance was calculated in terms of log reduction value (LRV), as depicted in Figure 8.

Bacterial retention of 0.1 μm and 0.2 μm sterilizing-grade membrane combinations with liposome (10 mg/mL).
Membranes A, B, C, and E provided 100% bacterial retention with LRV ≥8, whereas bacterial breakthrough was observed with membranes D, F, G, and H (Figure 8).The high hydrophilicity caused by surface modifications in Membranes D, F, G, and H correlates to the bacterial breakthrough. The effect of hydrophilicity in membrane is further confirmed by the retention performance of membrane D, which has the same polymer as Membrane A but failed in retaining bacteria unlike Membrane A because Membrane D is surface-modified and Membrane A is unmodified.
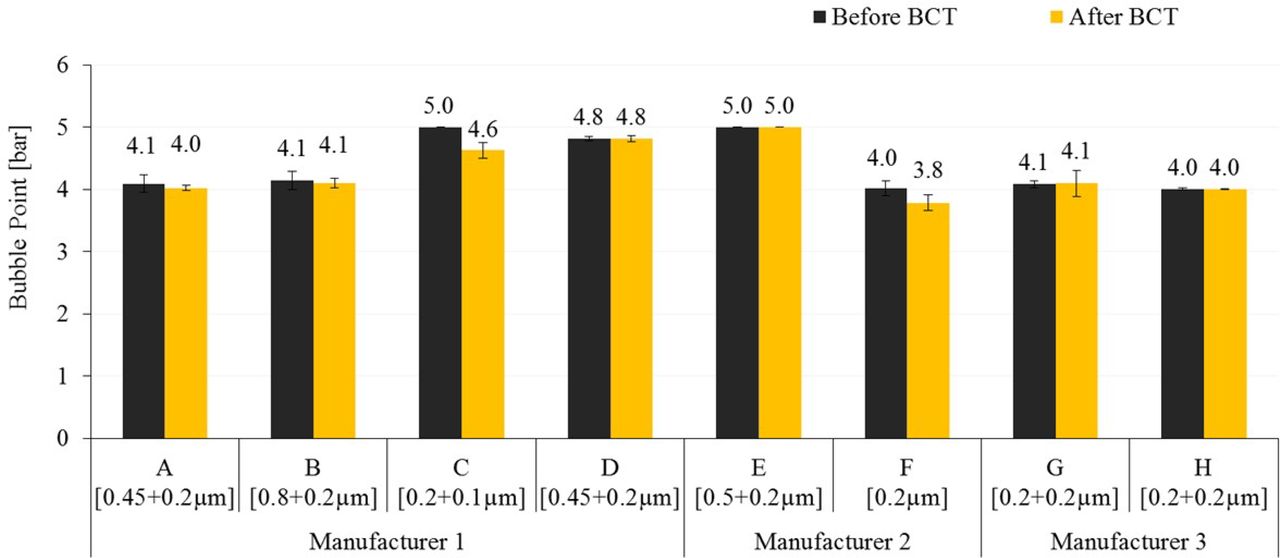
The bacterial retention of surface modified Membrane E with LRV 8.2 is due to its lower pore size of the second-layer retentive membrane, which is evident from its high bubble point and low mean flow pore size values (Table VIII and Table IX). This suggests that hydrophilicity and mean flow pore size of membranes play a significant role in bacterial retention with liposome-based formulations. Furthermore, each membrane was flushed with a defined volume of buffer followed by water after the BCT to recover the original bubble point, and the bubble point was measured to ensure the integrity of membranes, as shown in Figure 9.

Bubble point of 0.1 μm and 0.2 μm sterilizing-grade membranes after flushing.
Membranes A, B, D, E, G, and H recovered 100% of their original bubble point values, while Membrane C and F recovered 92% and 95%, respectively, which ensures their integrity after the BCT as presented in Figure 9.
Discussion
Filterability Studies
Initial throughput feasibility studies were conducted using a 34 mg/mL concentration of liposome solution (data not shown). Due to high lipid content, it resulted in low throughput and caused premature blocking, which means throughput capacity also depends on the liposome concentration being used. Therefore, a diluted liposome solution of 10 mg/mL concentration was used for further trials. The throughput capacity is dependent on membrane configurations, the pore size rating of the first layer (Table II), and the mean surface porosity of membrane combination (Table VI) with liposome-based formulations. The correlation of pore rating and surface porosity of membrane combination is presented in Figure 10.

Correlation of throughput with pore rating and percentage surface porosity.
It is observed that Membranes B, G, and H with symmetric membrane combination display high-throughput performance compared to other membrane types (Figure 10). The high-throughput performance of Membranes G and H is due to high mean surface porosity of membrane combinations (Figure 10). The high throughput achieved with Membrane B is due to the largest 0.8 μm pore–rated first-layer membrane apart from the high surface porosity of membrane combination (24%).This large pore–rated first-layer membrane traps the large aggregates of liposomes and protects the second layer of membrane from premature blocking. This suggests that the higher pore–rated-first layer and high surface porosity of membrane combination enhance the throughput capacity with liposome-based formulations.
Bacterial Retention Studies
Bacterial retention through a membrane is dependent on the second layer of membrane combination, which defines the absolute rating of sterilizing-grade membranes. The bacteria retention with liposome solution depends upon the pore size of the second layer of membrane and the hydrophilicity of the membrane combination. The pore size of a membrane is measured in terms of its bubble point (Table VIII), and the hydrophilicity is measured in terms of the surface tension of the membrane combination (Table VII). The bubble point is further correlated with the mean flow pore size (Table IX) of the second layer of the membrane and is inversely proportional. It was observed that some of the 0.2 μm–rated sterilizing-grade membranes did not provide complete bacteria retention with liposome solution (Figure 8) even though the diameter of B. diminuta is 0.2–0.3 μm (5). The correlation of bacteria retention in terms of LRV with the bubble point of the second layer of the membrane combination is given in Figure 11.

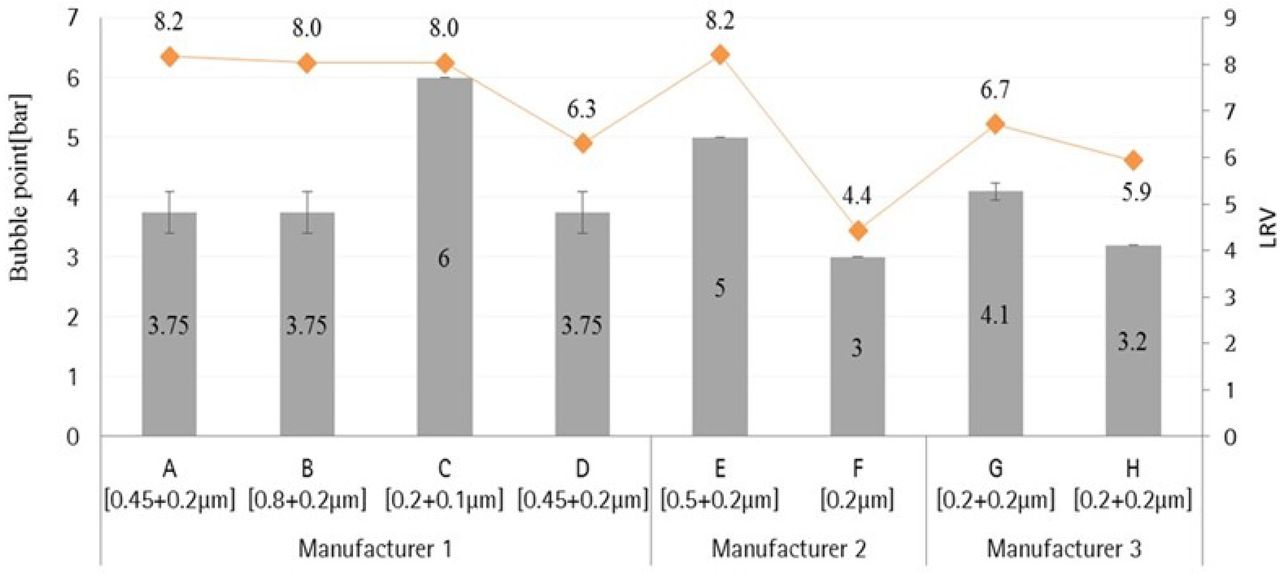
Bubble point versus LRV of the second layer of membrane combination.
The second layer of membrane combinations of Membranes A, B, and D have a bubble point value of 3.75 bar. The complete retention of B. diminuta was observed with unmodified membrane A and B with LRV ≥7 (Figure 11), unlike surface-modified membrane D, which is made of the same polymer as Membrane A and failed in retaining bacteria (LRV = 6.3) during liposome filtration. This is because of less hydrophilicity in unmodified Membranes A and B with relatively low surface tension values (75 mN/m) compared to surface-modified Membrane D, which has high hydrophilicity with high surface tension value of (79 mN/m) in the membrane combination. Similarly, surface-modified Membranes F, G, and H were not able to retain bacteria completely because they have a lower bubble point and high hydrophilicity (Figure 11). However, surface-modified Membrane E provided complete bacterial retention due to its high bubble point value (5 bar) and lower mean flow pore size value (0.27μm). The unmodified Membrane C also retained bacteria due to its high bubble point value (6 bar) and lower mean flow pore size (0.20 μm). Furthermore, liposome vesicles are made up of phospholipid molecules, which are amphipathic in nature, having a hydrophilic phosphate head and hydrophobic fatty acid tail (Figure 1). This hydrophilic phosphate group of the liposome molecule is oriented outside and makes a weak interaction with the membrane surface. These interactions cause adsorption of liposome vesicles to the surface of modified hydrophilic membranes and leads to slipping of bacteria from the membrane surface that allows bacterial penetration. The liposome vesicle and bacteria undergo competitive binding to the membrane interface. The liposomes undergo stronger adsorption to the membrane surface compared to bacteria, and the slipping of bacteria occurs due to repulsion between phosphate groups of the phospholipid bilayer of bacteria oriented outside with the phosphate group of the liposome molecules. This suggests that bubble point of the second layer and hydrophilicity of a membrane combination play an important role in bacterial retention with liposome-based formulations.
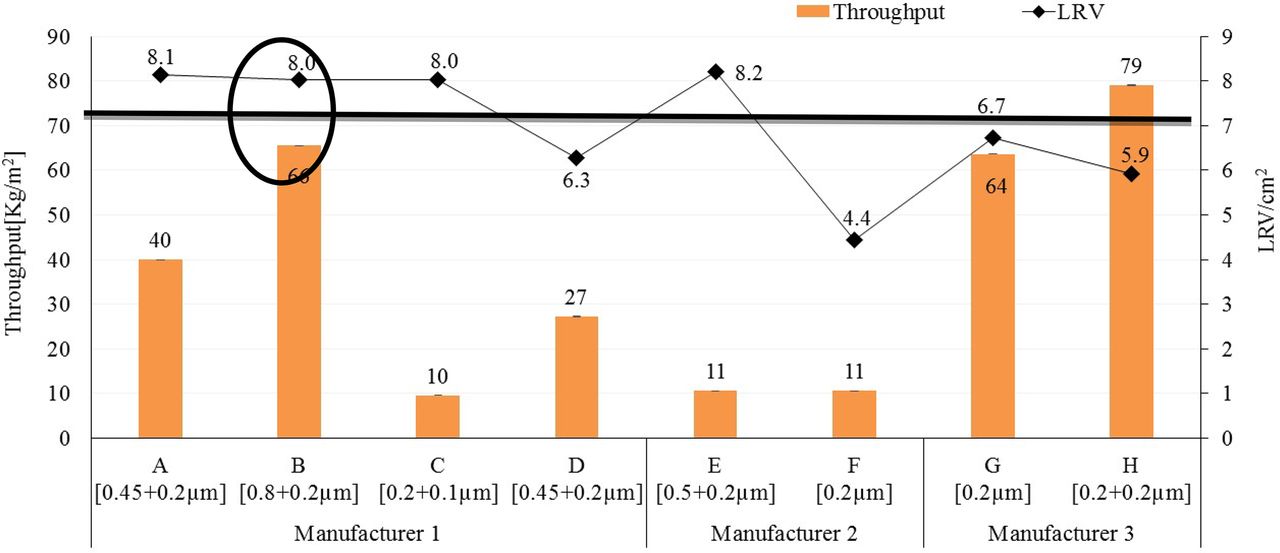
In summary, the total throughput and bacterial retention performance of different 0.1 μm and 0.2 μm sterilizing-grade membranes with 10 mg/mL concentration of liposome solution is presented in Figure 12.

Throughput versus bacterial retention of 0.1 μm and 0.2 μm sterilizing-grade membranes with liposome (10 mg/mL).
From the above studies of different 0.1 μm– and 0.2 μm–rated sterilizing-grade membranes, Membrane B provides the best combination of bacterial retention and total throughput for adjuvant and liposome-based solutions used in vaccine and drug manufacturing industries (Figure 12). The enhanced total throughput in membrane B is due to its largest 0.8 μm pore–rated first layer and comparable surface porosity (24%) in the membrane combination, whereas the bacterial retention is due to its less hydrophilicity in the membrane combination.
Conclusion
Based on the above results, it is concluded that the total throughput capacity of a membrane with liposome solution depends upon the largest size pore rating of the first layer and high surface porosity of the membrane combination irrespective of membrane configurations, and the bacterial retention performance of a membrane depends upon the hydrophilicity and tighter pore size of the second layer of the membrane combination.
However, successful sterilizing filtration validation with liposome-based formulations also requires a careful control of following parameters early in process design; these were not evaluated in this process solution:
Process solution: properties of liposome, for example, concentration, lipid content, and surface tension.
Bacteria type: properties of bacteria, for example, size, motility, viability in liposome solution.
Process parameters: pressure, flow rate, and temperature.
Conflict of Interest Declaration
None of the authors has a financial or other conflict of interest.
Acknowledgements
The authors thank Mr. Nick Hutchinson, technical writer, Sartorius Stedim biotech. GmbH for technical review of manuscript.
- © PDA, Inc. 2018


