
Abstract
Cleanroom garments serve a critical role in such industries as pharmaceuticals, life sciences, and semiconductor manufacturing. These textiles are available in reusable and disposable alternatives. In this report, the environmental sustainability of cleanroom coveralls is examined using life cycle assessment technology. The complete supply chain, manufacture, use, and end-of-life phases for reusable and disposable cleanroom coveralls are compared on a cradle-to-end-of-life cycle basis. Three industry representative coveralls are examined: a reusable woven polyethylene terephthalate (PET) coverall, a disposable flash spunbonded high-density polyethylene (HDPE) coverall, and a disposable spunbond-meltblown-spunbond polypropylene (SMS PP) coverall. The reusable cleanroom coverall system shows substantial improvements over both disposable cleanroom coverall systems in all environmental impact categories. The improvements over the disposable HDPE coverall were 34% lower process energy (PE), 23% lower natural resource energy (NRE), 27% lower greenhouse gas (GHG) emissions, and 73% lower blue water consumption. The improvements over the disposable SMS PP coverall were 59% lower PE, 56% lower NRE, 57% lower GHG emissions, and 77% lower blue water consumption. In addition, the reusable system shows a 94–96% reduction in solid waste to the landfill from the cleanroom facility. Between the two disposable cleanroom coveralls, the flash spunbonded HDPE coverall shows a measurable environmental improvement over the SMS PP coverall.
LAY ABSTRACT: Pharmaceutical drugs are manufactured and handled in controlled environments called cleanrooms to ensure the safety and quality of products. In order to maintain strict levels of cleanliness, cleanroom personnel are required to wear garments such as coveralls, hoods, and gloves that restrict the transfer of particles from the person to the environment. These garments are available in reusable and disposable types. Cleanroom operators consider a number of factors when selecting between reusable and disposable garments, including price, comfort, and environmental sustainability.
In this report, the environmental sustainability of reusable and disposable cleanroom coveralls is examined using a technique called life cycle assessment. With this technique, environmental parameters such as energy use and greenhouse gas emissions are quantified and compared for three market representative cleanroom coveralls, from raw material extraction through manufacturing, use, and final disposal. Reusable coveralls were found to substantially outperform disposable coveralls in all environmental parameters examined. This is an important conclusion that supports cleanroom companies that select reusable coveralls to be more sustainable.
- Cleanroom coveralls
- Life cycle assessment
- Reusable textiles
- Disposable textiles
- Energy reduction
- Environmental sustainability
Introduction
Cleanroom garments are worn to maintain a controlled, low level of contamination in a manufacturing environment, serving a critical role in industries such as pharmaceutical and semiconductor manufacturing. For example, a typical 1000 ft3 indoor room may contain over 200 million particles greater than 1 micrometer in diameter. A cleanroom of this size may be required to contain fewer than 20,000 such particles (1).
According to the McIlvaine Company (Northfield, IL) (2), the cleanroom hardware and consumables industry generated over $10 billion in annual revenues in 2011, which includes over $1 billion in revenues from reusable and disposable clothing. Revenues from reusable and disposable coveralls were about equal. Eudy (3) found that the decision to use reusable or disposable garments in a cleanroom depends on a number of factors, including the product being manufactured, the manufacturing processes employed, economics, and environmental performance.
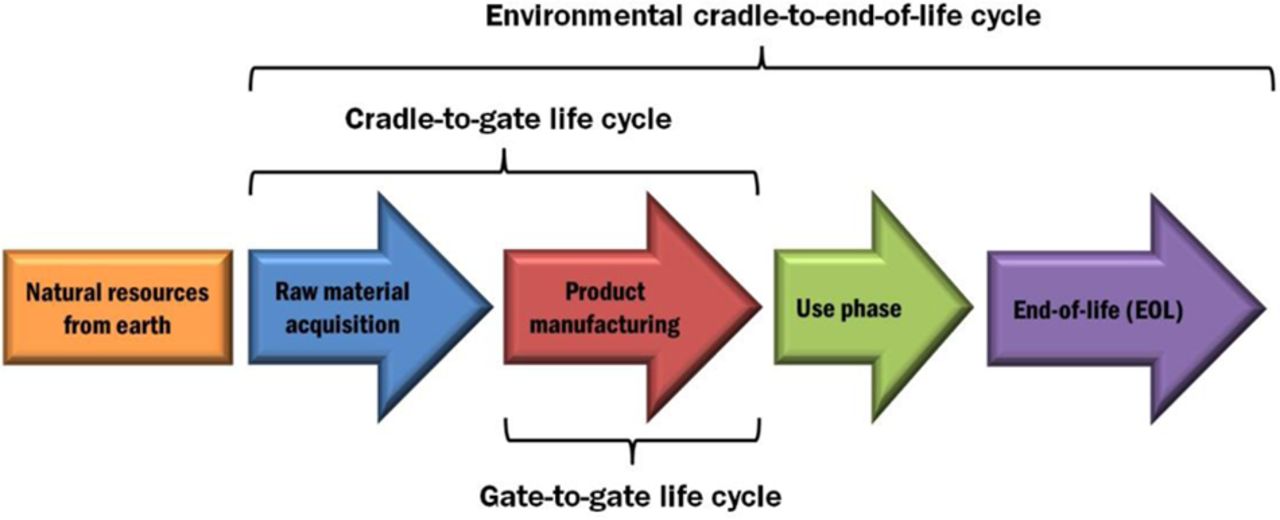
The most common technique used to evaluate the environmental benefits and impacts of products is a life cycle assessment (LCA). The International Standards Organization, in ISO 14040 (4), provides best practice guidelines for LCA. Relevant environmental aspects of the life cycle include raw material extraction and acquisition, energy and material production, product manufacturing, use, end-of-life treatment, and final disposal. The backbone of LCA is the life cycle inventory (LCI), an analysis of material and energy flows resulting from all phases of the product life cycle. Each manufacturing plant or node in the supply chain is referred to as a gate-to-gate (GTG) life cycle inventory. The GTG LCIs are added together to give a cradle-to-gate (CTG) life cycle inventory. The CTG LCI is the summation of GTG LCIs from natural materials in the earth to the final product, such as a cleanroom garment. The full life cycle inventory of a cleanroom garment encompasses a full cradle-to-end-of-life (CTEOL) profile as illustrated in Figure 1.

Life cycle scope for product analysis.
A number of comparative life cycle studies of reusable and disposable textiles have been performed over the past two decades. McDowell (5), Carre (6), van de Berghe and Zimmer (7), and Overcash (8) compared reusable and disposable surgical gowns. Jewell and Wentsel (9) compared reusable and disposable hospital isolation gowns, automotive wipers, and restaurant napkins. All five of these life cycle studies found that the reusable textile systems provided substantially better environmental profiles than the disposable systems. However, the analysis of these available life cycle data is often limited by the transparency and depth of information in these respective reports. Additionally, the previous reports focus on the healthcare industry, which has different requirements and practices than the cleanroom industry.
This paper is an LCA of reusable and disposable cleanroom garments. All data are transparent and nonproprietary. Full life cycle inventories and the extensive LCA are available from Environmental Clarity. The authors believe this is the most comprehensive environmental comparison of cleanroom coveralls yet produced.
Goal and Scope
The goal of this LCA was to compare market representative reusable and disposable cleanroom coveralls. The basis of comparison, or functional unit, was 1000 garment uses. Inventory and impact assessment metrics used to evaluate environmental performance were process energy consumption, natural resource energy consumption, greenhouse gas (GHG) emissions, water consumption (blue water), and solid waste from cleanroom facilities.
In this study a cleanroom coverall was defined as a single-piece, long-sleeve, extra-large zip-up garment. The coverall did not include a hood, gloves, or booties. Three market representative cleanroom coveralls were selected for comparison based on input from the American Reusable Textile Association (ARTA). One reusable coverall was investigated, a 370 g (0.816 lb) woven polyethylene terephthalate (PET) coverall. Two disposable coveralls were investigated, a 158 g (0.348 lb) nonwoven spunbonded high-density polyethylene (HDPE) coverall and a 225 g (0.496 lb) nonwoven spunbond-meltblown-spunbond polypropylene (SMS PP) coverall. The life cycle inventories did not represent specific coverall brands but were considered representative of coveralls commonly used in large-scale cleanroom operations. For both reusable and disposable coverall uses, 60% were supplied as laundered to cleanroom standards and the remaining 40% were supplied as laundered and sterilized garments. This was judged to be representative of the market by ARTA.
The scope was cradle to end of life. The use phase included laundry with municipal wastewater treatment, sterilization for a portion of the coveralls, and transportation. The end-of-life (EOL) phase included landfill for disposable coveralls and reuse in other industries for reusable coveralls.
Disposable cleanroom coveralls were assumed to have the fabric, the fabric supply chain, and the cut, sew, and trim operations in China. Reusable cleanroom coveralls were assumed to have these operations in the U.S. and Mexico. These assumptions were made based on data from previous surgical gown life cycle studies by Carre (6) and van de Berghe and Zimmer (7).
Reusable and disposable coveralls have substantially different EOL pathways. The coveralls are synthetic polymer fabrics and ultimately, whether reusable or disposable, will be landfilled. The EOL boundary for reusable cleanroom coveralls included the general practice of donating these textiles to countries where use as coveralls or other garments continues. This practice creates an environmental benefit equal to the energy avoided by not manufacturing these garments. However, by conventional life cycle standards the credit associated with this benefit is attributed to the clinic or distributing company that collects and reuses the coveralls. Therefore, the collection and reuse activities and credits were outside of the boundary of this study. The eventual landfill activities were also outside of the boundary of this study.
The cleanroom coverall life cycle data were separated into six categories to allow transparent comparison:
Coverall manufacturing CTG,
Packaging manufacturing CTG,
Use phase laundry GTG,
Use phase gamma sterilization GTG,
Use phase transport, and
End-of-life.
Methodology
The total energy for each GTG LCI was subdivided into six subcategories:
Electricity,
Steam—typically used in the heating range of 25–207 °C (77–405 °F),
Dowtherm—typically used in the heating range of 207–400 °C (405–752 °F),
Non-transport direct use of fuel—typically used in the heating range above 400 °C (752 °F),
Transport fuel, and
Heat potential recovery—reflecting significant heat integration in plants and is a negative energy value, which lowered the net or total plant manufacturing energy.
In this study the energy data were provided for two types of total energy:
Process energy—the direct energy consumed by the process in each of the supply chain chemical and material plants. This energy relates to the distinctive unit processes such as reactors and distillation columns required for each GTG LCI. The process energy is determined directly in relation to the unit processes and reflects the direct process energy as purchased at plants; and
Natural resource energy (NRE)—the total cumulative energy of all fuels used to produce each of the six process energies listed above. The natural resource energy is calculated from the process energy by including the higher heating value (HHV) of fuel combusted per unit of energy transferred to the process, that is, efficiency, plus the energy used to deliver fuel to the point of use, often known as pre-combustion energy or delivered energy. The factors used for efficiency and pre-combustion are shown in Table I as scale-up factors and can thus be used to convert, in a transparent fashion, process energy into natural resource energy. These factors can be changed by the reader and a clear effect seen on the results.
Scale-Up Factors from Process Energy to Natural Resource Energy (NRE)
The life cycle impact assessment (LCIA) combined the LCI process emissions and the emissions of energy generation in order to evaluate total impact on the environment. One of the impact categories studied was GHG emissions, also known as global warming potential (GWP), expressed as carbon dioxide equivalent (CO2eq). The GHG emissions can be estimated by using the representative ratio of 0.06 kg CO2eq/MJ NRE [0.476 pounds per kilowatt-hour (lb/kWh)] combustion. Note that in the results tables, a more detailed calculation with conversion factors specific to each energy type was used. The GHG emissions included emissions from all combustion processes for energy production plus any process emissions of GHGs expressed as units of CO2eq (methane = 25, nitrous oxide = 298, carbon dioxide = 1).
Another impact category studied was water consumption. For coveralls, water use occurred in the manufacturing supply chain and the laundry phase. The life cycle evaluation of water consumption in individual manufacturing plants must be more transparent than simply a catalogue of water supplied to or wastewater sent from such facilities. Water utilized in manufacturing GTG LCIs included water utilized in steam heating and cooling water circulations, water that came in direct contact with chemical reactions and separations, and water consumed or produced in chemical reactions.
These categories of water were utilized to establish water use based on principles developed by Aviso et al. (10) for water footprint assessment. The critical assumption for this water assessment was that contaminated water is sent to treatment plants that use physical and biological means to restore the water to regulatory standards for safe human contact and are accounted for in the LCI. These federal and state standards are used to issue permits for discharge to surface waters in the U.S. These standards also apply to municipal wastewater treatment plants (included in the LCI) to which an industry may discharge wastewater that is subsequently treated to the required levels. It was further assumed that industry and municipalities are in compliance with these permits, as these waters are returned to surface water resources. Thus for most chemical and materials manufacturing GTG LCI, the water utilization assessment categories of direct relevance are the following:
Gray water—the water, if any, used to dilute pollutants in a wastewater treatment plant to produce an effluent meeting the regulated standard concentrations for discharge to surface water. The assumption of compliance with wastewater treatment plant permit requirements means that gray water is zero for many manufacturing processes, since regulated standards for water discharge are already met. In other words, much manufacturing water use is rented water, as it is returned in acceptable condition after use and discharged to surface waters and is thus not consumed; and
Blue water—the water evaporated or incorporated into the product. These losses are water not directly available locally to replenish surface waters. The return of water due to rainfall from this evaporated water is not considered sufficient for the water balance of the manufacturing plant and thus is considered blue water or consumed water.
The analysis of water consumption of each manufacturing plant GTG LCI also included the requisite wastewater treatment plant for achieving regulated discharge standards. This manufacturing plant boundary allowed the water consumption to include only blue water, and thus was substantially less than water metered to the plant, the typical method for evaluating water consumption.
At this level of transparency and detail the reader must carefully look at each type of information and system to understand the full life cycle results. This level of data also allows the reader to more easily utilize these data for other analyses, such as varying the coverall materials, weights, or frequency of uses. In addition, each coverall manufacturer can choose to modify these results for its specific products.
Basis for Reusable Cleanroom Coverall LCI
The functional unit was 1000 coverall uses in cleanrooms. The number of reusable coveralls manufactured was determined by the average number of cycles. Based on a survey of ARTA members, sterilized coveralls are used for about 40 cycles, and non-sterilized coveralls are used for about 60 cycles, prior to being removed from service. Note that in practice, non-sterilized coveralls are often used for 75 to 100 or more cycles. However, for the purposes of this LCA, a use rate of 60 cycles was selected as a conservative estimate of non-sterilized coverall life. Also based on a survey of ARTA members, 40% of reusable coverall uses were supplied as sterilized and the remaining 60% of uses were not sterilized. The harmonic mean was used to calculate an average reuse rate of 50 cycles per coverall. Thus 20 new coveralls were manufactured to provide 1000 coverall uses, but 1000 coveralls were evaluated through the reuse cycle. The components for the reusable cleanroom coverall system were as follows:
Manufacture and transport of 20 reusable cleanroom coveralls, CTG
Manufacture and transport of primary, secondary, and tertiary (PST) packaging, 1000 coverall uses, CTG
Laundry process for 1000 coverall uses, CTG
Production of water used for laundry process for 1000 coverall uses, CTG
Wastewater treatment of the organic burden from the laundry process for 1000 coverall uses, CTG
Gamma sterilization process for 40% of 1000 coverall uses (400 sterilization cycles), CTG
Manufacture of radioactive source of cobalt-60 for 400 sterilization cycles, CTG
EOL phase, reuse in other textile industries, GTG, disposal was excluded
Use phase transportation, GTG
Basis for Disposable Cleanroom Coverall LCI
The functional unit for cleanroom coveralls was 1000 coverall uses, which for the disposable system was 1000 new coveralls. The components for the disposable cleanroom coverall systems were as follows:
Manufacture and transport of 1000 disposable cleanroom coveralls, CTG
Manufacture and transport of PST packaging for 1000 coveralls, CTG
Laundry process for 1000 coveralls, CTG (because manufactured coveralls do not meet cleanroom standards)
Production of water used for laundry process for 1000 coveralls, CTG
Wastewater treatment of the organic burden from the laundry process for 1000 new coveralls, CTG
Gamma sterilization process for 40% of 1000 coveralls (400 sterilization cycles), CTG
Manufacture of the radioactive source of cobalt-60 for 400 sterilization cycles, CTG
EOL phase, landfill process for 1000 coveralls, GTG
EOL phase, landfill process for biological soil found on 1000 used coveralls, GTG
Use phase transportation, GTG
Results
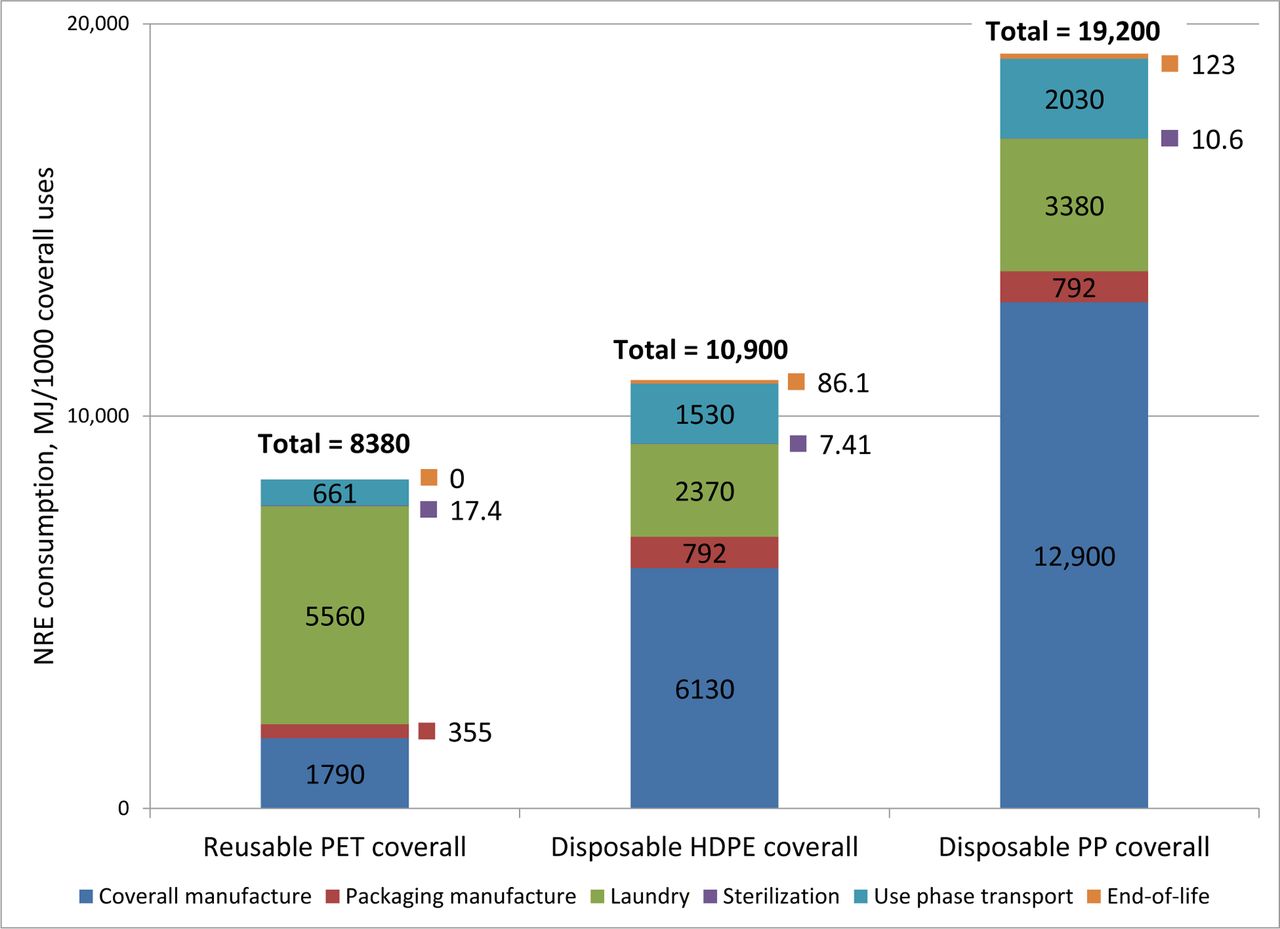
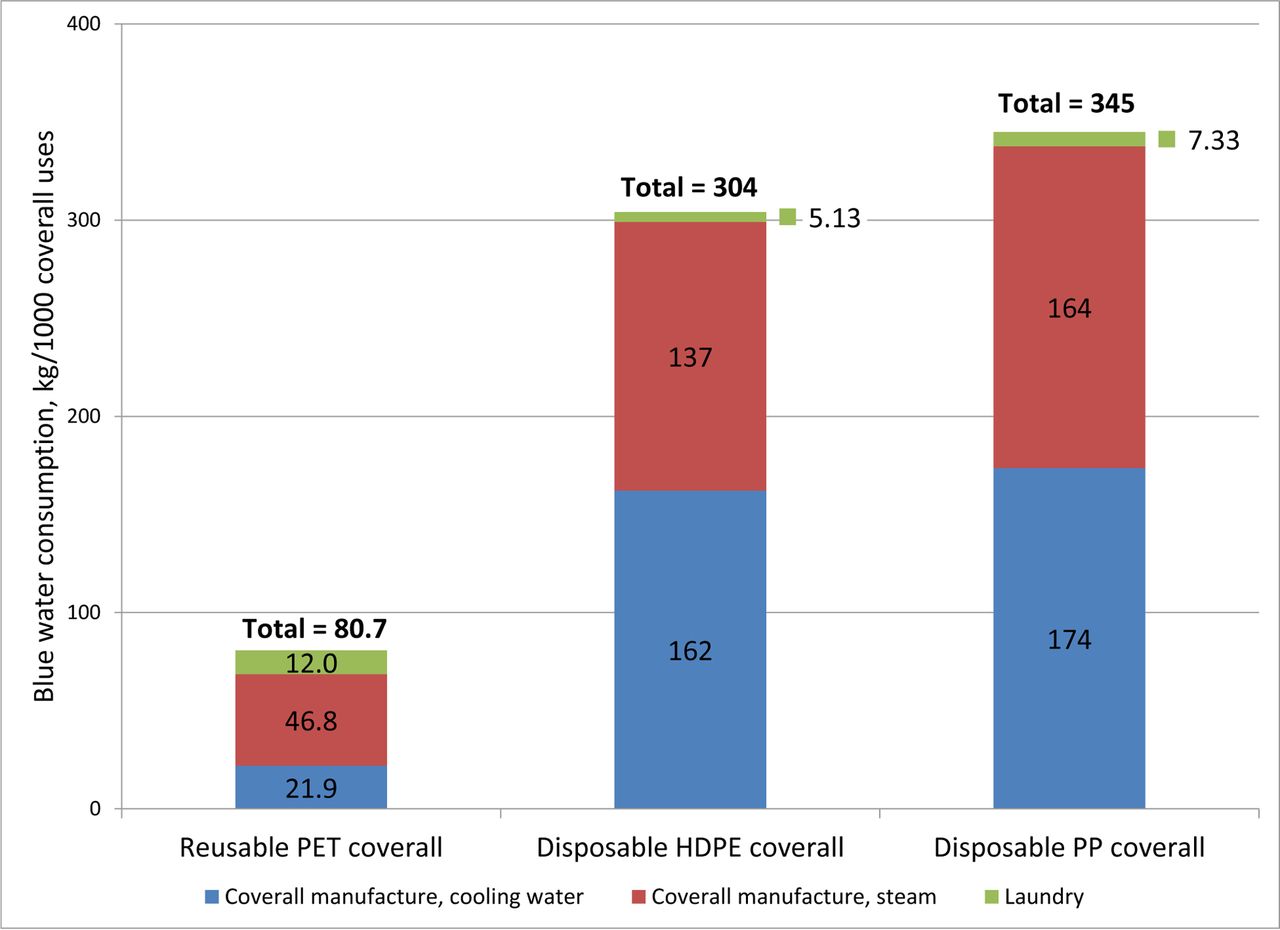
All results are reported for a functional unit of 1000 cleanroom coverall uses. The results from the LCI and LCIA are summarized in Table II, Figure 2, and Figure 3. The energy consumption, GHG emissions, water consumption, and solid waste disposal for the reusable cleanroom coverall CTEOL system was substantially lower than either of the disposable systems (Table II).
Cradle-to-End-of-Life (CTEOL) Evaluation of Reusable (50 Uses/Coverall) and Disposable Cleanroom Coveralls

CTEOL NRE evaluation of reusable and disposable cleanroom coveralls.

CTEOL blue water evaluation of reusable and disposable cleanroom coveralls.
Coverall Manufacturing CTG
Reusable and disposable cleanroom coveralls each have one principal fabric material and a zipper. The fabric and zipper are assembled into a coverall with a cut, sew, and trim operation.
The reusable coverall CTG LCI consisted of the following on a 1000 use basis:
7.04 kg (15.5 lb) woven PET fabric CTG LCI
0.356 kg (0.785 lb) nylon 6 pellet for zipper CTG LCI
7.40 kg (16.3 lb) cut, sew, and trim GTG LCI
Some reusable cleanroom coveralls contain less than 1% by weight carbon fiber additive as an anti-static agent. The carbon fiber was considered to be an ancillary input and was excluded from this study. Inclusion of carbon fiber is expected to have an impact of less than 0.2% on LCA parameters such as GHG emissions.
The disposable HDPE coverall CTG LCI consisted of the following on a 1000 use basis:
151 kg (333 lb) flash spunbonded HDPE fabric CTG LCI
6.75 kg (14.9 lb) nylon 6 pellet for zipper CTG LCI
158 kg (348 lb) cut, sew, and trim GTG LCI
The disposable polypropylene (PP) coverall consisted of the following on a 1000 use basis:
215 kg (474 lb) SMS PP fabric CTG LCI
9.76 kg (21.5 lb) nylon 6 pellet CTG LCI
225 kg (496 lb) cut, sew, and trim GTG LCI
Table III includes a comparison of the cleanroom coverall and supply chain manufacturing CTG. The reusable coveralls used substantially less energy in the manufacturing stage, as only one reusable coverall was manufactured for every 50 disposable coveralls.
Summary of Natural Resource Energy (NRE) Consumption and GHG Emissions for Cleanroom Coverall Cradle-to-End-of-Life (CTEOL) by Life Cycle Component
Packaging Manufacturing CTG
Reusable and disposable cleanroom coveralls require a variety of packaging to deliver the products to clean rooms. In this LCA, the packaging containers and inserts were measured from practice. It was recognized that variations in the packaging materials occur across the broad range of supply companies. The packaging materials analyzed in the study were representative materials and thus allow an understanding of the life cycle issues of cleanroom coverall packaging. The packaging was subdivided into primary, secondary, and tertiary:
Primary—The bags, wraps, and labels used to preserve and identify the cleanroom coveralls until the point of use.
Secondary—The containers used to ship and handle the coveralls that already have primary packaging.
Tertiary—The pallets and pallet wrap used to ship and handle the coveralls that already have primary and secondary packaging. Note that wood pallets are not considered a material input or output due to common reuse and recycling patterns.
The reusable coverall packaging CTG LCI consisted of the following on a 1000 use basis:
7.50 kg (16.5 lb) HDPE outer bag CTG LCI used in primary packaging
2.74 kg (6.04 lb) low-density polyethylene (LDPE) sheet CTG LCI used in secondary and tertiary packaging
0.840 kg (1.85 lb) corrugated box CTG LCI used in secondary packaging
0.245 kg (0.540 lb) plastic tote CTG LCI used in secondary packaging
The two disposable coverall packaging materials were identical on a 1000 use basis:
33.6 kg (74.1 lb) corrugated box CTG LCI used in secondary packaging
9.70 kg (21.4lb) HDPE outer bag CTG LCI used in primary packaging
3.12 kg (6.88 lb) insert paper CTG LCI used in primary packaging
0.0280 kg (0.0617 lb) LDPE sheet used in tertiary packaging
Table III includes a comparison of the cleanroom coverall packaging manufacturing CTG results. The packaging energy and GWP for reusable coveralls were less than one-half of that for disposable coveralls. This is due to a substantial reduction in corrugated boxboard, because the reusable coveralls are transported in reusable plastic totes with each use.
Use Phase
The cleanroom coverall use phase includes laundry and sterilization of reusable and disposable coveralls because the manufacturing of coveralls does not meet cleanroom standards. The weight of the coverall was the only factor that differentiated overall energy consumption in the use phase. The typical laundry process for cleanroom coveralls is a combination of washing and drying, consuming energy as electricity and natural gas on a 1000 use basis. The laundry water consumption, chemical consumption, and energy consumption were assumed to be constant per unit weight coverall. Thus, the weight of the coverall was a major factor in the LCI data for the laundry process. The laundry process was evaluated with field data for metered water consumption and measured chemical oxygen demand (COD) in wastewater. The laundry process uses about 13,000 mass parts water to 1000 mass parts laundry. Over 99% of this water is sent to a wastewater treatment plant and returned to regulated levels acceptable for human exposure. Therefore, only the evaporative losses, or blue water, were included as a water impact. The evaporative losses were measured in the field at two sites as the difference between wet coveralls and dry coveralls before and after drying and were approximately 0.25% by weight of the overall laundry system water consumption. The wet coveralls contained about 3% water by weight. Measurement of COD at a reusable cleanroom coverall laundry facility determined a wastewater COD of about 300 ppm. The wastewater treatment plant CTG LCI used the COD load as the link to the energy consumption and effluents from the process. This was based on the microbial treatment mechanisms and the analysis of Jimenez-Gonzalez and Overcash (11).
The coverall laundry CTG LCI consisted of the following on a 1000 kg (2200 lb) laundered basis:
13,000 kg (28,700 lb) metered water CTG LCI
Note evaporative losses of water, blue water, were 32.5 kg (71.7 lb)
3.89 kg (8.58 lb) COD treatment CTG LCI
1000 kg (2200 lb) coveralls to laundry process GTG LCI
Forty percent of cleanroom coveralls are sterilized after the laundry process, based on the industry use of such coveralls. The typical sterilization process for reusable and disposable cleanroom coveralls is gamma sterilization with radioactive cobalt-60. The CTG LCI for gamma sterilization is conducted using field procedures and nuclear decay equations as discussed by Zyball (12), Sinco (13), and da Silva Aquino (14).
The coverall sterilization CTG LCI consisted of the following on a 1000 kg (2200 lb) sterilized basis:
0.000153 kg (0.000337 lb) cobalt-60 source CTG LCI
1000 kg (2200 lb) coveralls to gamma sterilization process CTG LCI
Table III includes comparisons of the cleanroom coverall laundry and sterilization. The disposable coveralls use substantially less energy in the use phase due to their lower weights per coverall.
Transport
Different transportation scenarios were used for the reusable cleanroom coveralls, disposable cleanroom coveralls, and for the chemicals used in the supply chain of these coveralls. The CTEOL transport examined in the life cycle study included the following:
One-way transport of all materials used in the coverall and packaging supply chains from natural resources to final product (CTG)
One-way transport of coveralls from the manufacturing plant to the distribution center (use phase)
Round-trip transport of new reusable and disposable coveralls from the distribution center to the laundry facility and from reusable cleanrooms to laundry (use phase)
Round-trip transport of 40% of coveralls from the laundry facility to the sterilization facility (use phase)
One-way transport of coveralls from the cleanrooms to the landfill or point of reuse (EOL)
Within the supply chain for cleanroom coverall manufacture, most GTG LCIs were assigned a default transport distance of 531 km (330 miles), as the U.S. average distance for shipping industrial chemicals based on the Statistical Abstract of the United States: 1997 (U.S. Census Bureau). Use phase transports were included in the use phase transport CTG and are shown in the transport category in Figure 2. Transport impacts associated with manufacturing were included in the coverall and packaging manufacturing results. Transport impacts associated with EOL landfilling were included in the EOL results.
The reusable coverall use phase transport LCI consisted of the following on a 1000 use basis:
8.39 kg (18.5 lb) coveralls and packaging transported 6960 km (4320 miles) by truck from manufacturer to cleanroom
626 kg (1380 lb) coveralls and packaging transported 113 km (70.2 miles) by truck for round-trip transport to laundry facility
250 kg (551 lb) coveralls and packaging transported 483 km (300 miles) by truck for round-trip transport to sterilization facility
The disposable HDPE coverall use phase transport LCI consisted of the following on a 1000 use basis:
204 kg (450 lb) coveralls and packaging transported 3260 km (2030 miles) by truck and 11,700 km (7270 miles) by ocean ship from manufacturer to cleanroom
204 kg (450 lb) coveralls and packaging transported 113 km (70.2 miles) by truck for round-trip transport to laundry facility
81.8 kg (180 lb) coveralls and packaging transported 483 km (300 miles) by truck for round-trip transport to sterilization facility
The disposable PP coverall use phase transport LCI consisted of the following on a 1000 use basis:
271 kg (597 lb) coveralls and packaging transported 3260 km (2030 miles) by truck and 11,700 km (7270 miles) by ocean ship from manufacturer to cleanroom
271 kg (597 lb) coveralls and packaging transported 113 km (70.2 miles) by truck for round-trip transport to laundry facility
109 kg (240 lb) coveralls and packaging transported 483 km (300 miles) by truck for round-trip transport to sterilization facility
Table III includes a comparison of the cleanroom coverall use phase transport GTG results and includes NRE consumption and GHG emissions for reusable and disposable cleanroom coveralls. Transport for reusable coveralls was substantially lower in energy consumption than transport for disposable coveralls. Although transport energy consumption for the laundry and sterilization steps was higher for reusable coveralls than disposable coveralls, transport for the manufacture to cleanroom step was substantially lower, as only one reusable coverall was manufactured and transported for every 50 disposable coveralls.
EOL Phase
The EOL boundary for the reusable cleanroom coveralls and packaging included the common practice of reusing the coveralls in other industries and recycling the packaging materials. The credit for reusing and recycling materials is given to the company that collects and reuses the material. The impact of the reuse and recycle assumptions was negligible; should 100% of the coverall and packaging materials be landfilled, LCA parameters such as NRE consumption and GHG emissions were affected by less than 0.2%.
The EOL boundary for disposable cleanroom coveralls included the general practice of landfilling after cleanroom use. In recent years, efforts to recycle disposable cleanroom garments have increased. However, these programs are new and divert only a small amount of cleanroom waste from the landfill. Therefore, in this LCA, disposable coveralls were considered to be landfilled.
The landfill CTG LCI included transportation and landfill operations for the disposable coveralls from the cleanroom to the landfill. The landfill transportation energy was based on information from municipal solid waste collections. Disposable cleanroom coveralls are synthetic polymer nonwovens and are assumed to not degrade in the landfill. However, each disposable cleanroom coverall carries a small amount of biological waste from human use in cleanrooms. This biological waste is degradable, and the amount present is quantified as total organic carbon (TOC). The landfill LCI used TOC to link biological waste input to energy and emissions from the landfill. The TOC is readily degraded in the anaerobic landfill environment. The amount of TOC on disposable coveralls due to cleanroom use contamination was estimated as 0.271 kg (0.597 lb) biological waste per 1000 coveralls based on measured wastewater chemical oxygen demand (COD) values from reusable coverall laundry facilities. The biological waste was assumed to be the same on a per coverall basis for reusable and disposable coveralls, as both coveralls were used in controlled cleanroom environments. Therefore, for disposable coveralls, 0.271 kg (0.597 lb) biological waste as TOC was delivered to the landfill per 1000 coveralls.
The disposable HDPE coverall EOL CTG LCI consisted of the following on a 1000 use basis:
158 kg (348 lb) post-consumer waste transport to landfill CTG LCI
158 kg (348 lb) landfill operations for inert plastic coverall GTG LCI
0.271 kg (0.597 lb) landfill process for biological waste GTG LCI
The disposable PP coverall EOL CTG LCI consisted of the following on a 1000 use basis:
225 kg (496 lb) post-consumer waste transport to landfill CTG LCI
225 kg (496 lb) landfill operations for inert plastic coverall GTG LCI
0.271 kg (0.597 lb) landfill process for biological waste GTG LCI
Table III includes a comparison of the cleanroom coverall EOL phase CTG results and includes NRE consumption and GHG emissions for reusable and disposable cleanroom coveralls. The EOL energies and GWP are less than 2% of the totals for the disposable coveralls.
Conclusion
Based on the results of this study and previous partial life cycle studies by McDowell (5), Carre (6), van de Berghe and Zimmer (7), Overcash (8), and Jewell and Wentsel (9), it is absolutely clear that the environmental benefit of reusable coveralls is significant. The life cycle energy improvement has been quantified herein and can thus be used by cleanroom facilities for their scorecards or metrics in sustainability programs or for healthy cleanroom program goals. Detailed results are available from Environmental Clarity.
Conflict of Interest Declaration
The authors declare that they have no competing interests.
List of Abbreviations
ARTA—American Reusable Textile Association
CO2eq—carbon dioxide equivalent
COD—chemical oxygen demand
CTEOL—cradle-to-end-of-life
CTG—cradle-to-gate
EOL—end-of-life
g—gram
GHG—greenhouse gas
GTG—gate-to-gate
GWP—global warming potential
HDPE—high-density polyethylene
HHV—higher heating value
ISO—International Organization for Standardization
kg—kilogram
kWh—kilowatt-hour
lb—pound
LCA—life cycle assessment
LCI—life cycle inventory
LCIA—life cycle inventory assessment
LDPE—low-density polyethylene
MJ—megajoule
NRE—natural resource energy
PE—polyethylene
PET—polyethylene terephthalate
PP—polypropylene
PST—primary, secondary, and tertiary
SMS—spunbond-meltblown-spunbond
TOC—total organic carbon
Acknowledgements
The authors would like to thank the American Reusable Textile Association (ARTA) for its continued support throughout this study.
- © PDA, Inc. 2018


