
Abstract
The regulatory expectations introduced by the U.S. Food and Drug Administration in 1999, ICH Q5C, the revised draft of Annex 1, Eudralex volume 4 for consultation, and the recent update of USP general chapters 1207.1 and 1207.2 regarding container closure integrity (CCI) testing have created a need for further development of testing methods, although there are no universally accepted methods to test and evaluate the CCI of a biopharmaceutical drug product. Each testing method and principle has merits and demerits.
This paper will present a simple approach to be used in method validation of CCI testing based on headspace oxygen analysis for freeze-dried biopharmaceutical drug products in vials, as well as a method for testing and verifying positive control vials. The model is based on Fick's law of diffusion and is empirically corrected to account for Knudsen diffusion in smaller defect sizes. The model considers storage conditions of the vials, allowing for testing of vials stored under anaerobic and near-sealing pressure conditions and different temperature conditions, as well as testing at different time points. Using this approach based on headspace oxygen analysis, the minimum timeframe for leak detection is dependent on the volume of the object tested, but standard vial sizes have shown that leak sizes of 0.2 μm can be detected within hours of vial stoppering with the model developed. CCI testing by headspace oxygen analysis using this approach can be done quickly and non-destructively. This method can prove its effectiveness in demonstration of a protective critical barrier (CCI) for a biopharmaceutical drug product during real-time situations of manufacturing, transportation, registered storage conditions, etc. (life-cycle approach).
LAY ABSTRACT: The recent update of the guideline, USP general chapters 1207.1 and 1207.2, regarding container closure integrity (CCI) testing, has created a need for further development of testing methods. The new methods applied should be deterministic, i.e., describe predefined detection limits and objective quantitative data. Deterministic leak test methods are methods for which the leakage event being detected or measured is based on phenomena that follow a predictable chain of events.
At present, there is no universally accepted method to test and evaluate the CCI of a biopharmaceutical drug product.
This paper will present a simple model-based method based on headspace oxygen analysis for freeze-dried biopharmaceutical drug products in vials, as well as a method for testing and verifying positive control vials. Positive controls are vials with a known defect, e.g., an inserted micropipette.
The model considers storage conditions of the vials, allowing for testing of vials stored under different pressure and temperature conditions, as well as testing at different time points. CCI testing by headspace oxygen analysis using the new approach can be done quickly and without destruction of the vials. This method can prove its effectiveness in demonstration of a protective critical barrier (CCI) for a biopharmaceutical drug product during real situations of manufacturing, transportation, registered storage conditions, etc.
- Container closure integrity testing
- Method development
- Positive controls for container closure integrity studies
- Modeling leak rate for artificial leaks in vials
- Laser-based headspace analysis
- Oxygen
- USP <1207>
1. Introduction
The regulatory expectations introduced by the U.S. Food and Drug Administration in 1999 (1), ICH Q5C (2), the revised draft of Annex 1, Eudralex Volume 4 for consultation (3), and the recent update of USP general chapters 1207.1 and 1207.2 (4) regarding container closure integrity (CCI) testing have created a need for further development of testing methods, although there are no universally accepted methods to test and evaluate the CCI of a biopharmaceutical drug product. Each testing method and principle has merits and demerits.
In relation to the recommendations in the update of USP <1207>, Package Integrity Evaluation – Sterile Products (4), the pharmaceutical industry has increased efforts to introduce and develop deterministic leak test methods for CCI testing. Deterministic methods are methods for which the measurement of leak detection is based on physicochemical technologies that are readily controlled and monitored, yielding objective quantitative data (4).
In USP <1207>, the following is defined: “A deterministic leak test method having the ability to detect leaks at the product's maximum allowable leakage limit is preferred when establishing the inherent integrity of a container closure system” (4). The update further states, “Most package types display very low but definite gaseous leakage flow through the gap that exists even between well-fitted closures. Therefore, it is not practical to require that packages be absolutely leak-free. Rather, it is the significance of leakage in relation to product quality that needs to be considered. In other words, the package should not permit leakage beyond the product's maximum allowable leakage limit” (4).
Discussion is ongoing about how to find the most relevant methods for conducting CCI testing, but there is no universally accepted test method for a given container closure system and product conditions (5). For freeze-dried product in vials, the CCI testing becomes even more complex, as both the headspace conditions in relation to leaks and permeation become relevant if the product is sensitive to oxygen, for example. An often-used method for verifying the integrity of the container closure system (CCS) is the oxygen level measured by headspace analysis, as the result is directly correlated to the CCI. However, to verify changes in oxygen level for non-defective vials, the time interval will often have to be days or weeks to verify small leak sizes. Verifying oxygen ingress in relation to the product requirements will often require even longer time periods, when permeation is also considered. The headspace method is evaluated further in Brown et al. (5).
A description and discussion on the relevant considerations for simulation of artificial defects are given in Brown et al. (5). It is concluded that artificial leaks (holes and channels) can be used as positive controls for any CCI testing method to ensure appropriate method development evaluation and verification as part of CCS qualification. Often, the minimum leak size of 0.2 μm (6) should be included in the form of micropipettes or capillaries. The leak size of 0.2 μm is the smallest size through which a microorganism can pass (7). Thus, it corresponds to the sterility requirements in previous microbial ingress testing methods.
A leak is ideally—and assumed to be—circular, although an artificial hole is likely irregular. Variation in leak diameter and depth should be considered in the CCI study (5) and to demonstrate that different types of leaks can be verified. Considering CCI control, a worst-case leak in relation to leak diameter will be a leak represented by a single hole with a small depth, as chips, cracks, and holes in packing materials will have a longer path and may consist of several smaller holes. The leak rate will be higher for a leak with a small depth when compared with a leak with a long depth for the same diameter. Further leakage techniques and dynamics are described in detail in Brown et al. and Yoon et al. (5, 8).
To create a very fine controlled leak, it is sometimes necessary to first drill a larger hole, leaving a thin surface to be penetrated with the desired leak size. For example, this method is used for metal discs and laser-drilled holes in glass, which usually have short leak paths in the 5–50 μm range (9).
Glass micropipettes are drawn and cut to a known diameter, so the shape of the channel is tapered. The length of the channel for a 2 μm glass micropipette is difficult to define, but it is assumed to be shorter than 0.5 mm (8). Investigations at Novo Nordisk for micropipettes using ESEM show that the nominal diameter is correct at the tip within a very short distance and then increases to a much higher value during the first 50–100 μm.
Modeling various leak paths, particularly under conditions where diffusion takes place, is important, as the relationship between leak diameter and length will influence the leak rate.
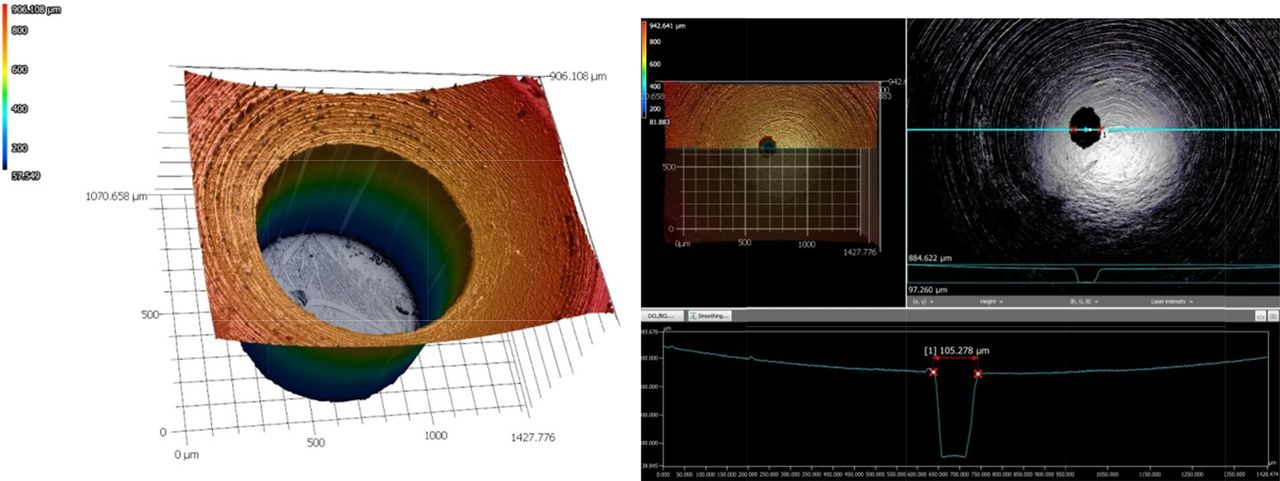
Figure 1 shows the photograph of a laser-drilled hole from Lenox Laser, Glen Arm, Maryland, USA.

Topographical images of laser-drilled holes, courtesy of Lennox Laser.
It is difficult to define the geometry of laser-drilled holes given that they are actually a series of micron-sized cracks as described in Yoon et al. (8).
At present, models that can be used for describing diffusive flow in relation to the conditions relevant for the CCI at process conditions have not been developed. When considering the inclusion of positive controls for artificial leaks, simple models should be derived to express the leak properties like leak diameter and depth. Such parameters must be described when modeling the data to define the worst-case leakage that must be considered when evaluating CCI. In this work, based on the above discussions, we have fixed the depth of the leak to 50 μm for all measurements with micropipettes and to 18 μm for the laser-drilled holes. This assumption will be evaluated further.
The first attempt to measure and model gas flow in a defective container (vial) using a deterministic leak test method (headspace oxygen analysis) using laser-drilled holes was shown in Duncan (10). In this work (10), a simple diffusion and effusion model is used for which the diffusion coefficient is manipulated. It is concluded that laser-drilled holes show a spread in the diffusion parameter for the same defect size, indicating that there are some deviations on the reported defect sizes from suppliers. A CCI study was also performed in order to demonstrate that the N2 filling process can produce good CCI for a specific vial stopper combination, based on 10 μm microcapillaries. However, the method does not model the actual conditions for the vial. Instead, an indirect method is applied for which the vials are processed at other pressure conditions before the actual headspace measurement can be performed. The headspace gas ingress model is used to design a sample chamber evacuation, nitrogen backfill, and sample hold cycle. The described model approach gives an approximation to the oxygen level measured over time and extrapolated to smaller defect sizes. This will provide information on the necessary length of time between two consecutive measurements to verify that the corresponding oxygen ingress is below the acceptance criteria, e.g., for a leak diameter of 0.5 μm. Because the method is based on effusion during the test sequence, no information for the depth of the leak can be verified. It is assumed that all positive controls have the same depth, which might not always be correct.
The purpose of this paper is to present a new, simple model that can be used directly for CCI control for freeze-dried products in vials. The model is based on the fundamental equations for diffusion by Fick's law and Knudsen diffusion (11). The test vials used in the study are prepared by an evacuation procedure in a laboratory-scale freeze dryer, with test vials representing the headspace conditions of a drug product. Headspace oxygen analysis was used as the CCI testing. Positive control vials using laser-drilled holes and micropipettes were included in order to verify model predictions. A discussion of the accuracy of the leak sizes and depths certified by suppliers is also included.
2. Methods and Materials
2.1. Equipment
The vials used for sample preparation were colorless type 1 tubing glass vials (Ph. Eur.) in sizes 4.3, 7.1, and 13.5 mL. The total volume of vials with product was 2, 5, and 12 mL.
Two different types of defects were used:
Vials with laser-drilled holes of nominal diameter in sizes 2, 5, and 10 μm purchased at Lenox Laser, Glen Arm, Maryland, USA.
Vials with glass micropipettes of nominal diameter in sizes 0.2, 2, and 10 μm purchased at WPI, Sarasota, Florida, USA. These positive control vials were prepared by drilling a hole in the side of the vial and inserting the tip of the pipette. The pipette was secured with glue.
The stoppers used were made of chlorobutyl rubber from West Pharmaceuticals, Eschweiler, Germany. The vials were capped with aluminium caps from Braunform, Bahlingen, Germany.
The equipment used was a Steris, Cologne, Germany laboratory-scale freeze dryer, a table-top WPI manual capper using 60 N as a set point, and a Lighthouse FMS 760 Headspace Oxygen Analyzer from Lighthouse Lighthouse Instruments, Amsterdam, The Netherlands.
2.2. Preparation of Vial Samples
The samples (defective vials) were prepared by exchanging atmospheric air in the vials with N2. The method of simulating the end headspace condition of a drug product was based on evacuating the freeze-dryer chamber, replacing the air with N2 in repeating pulses, simulating end pressure in vials at 900 mbar in this case. The freeze-dryer sequence used included three evacuation cycles from 900 mbar to 50 mbar, with no holding time. The end pressure set point was 900 mbar during which the vials were stoppered. The shelf temperature set point was 20°C–40°C. After pressure equalization and opening of the freeze-dryer door, the vials were immediately capped (within approximately 1 h).
2.3. Head Space Measurement Method
The FMS 760 Headspace Oxygen Analyzer was operated as recommended by the supplier. The system was calibrated and checked using a set of standard O2 vials before running the O2 measurements. Measuring time was set to 5 s.
The O2 measurements of the samples were performed with as short intervals as possible for the first few hours and then a few times a day until the vial oxygen concentration reached atmospheric concentration.
2.4. Viscous Flow Model
The model used in our work is based on the oxygen ingress into the vial, as the number of molecules in the vial (N) over time (t) changes by the flux of oxygen (J) over the area of the defect (A), eq 1:

It is assumed that the diffusion takes place in the viscous flow regime under ideal gas conditions. This allows for the flux to be described by Fick's law, eq 2:

The difference in concentration (c) over the length of the defect (z) is seen as eq 3 using the ideal gas assumption to substitute Temperature (T), outside partial pressure (po), and headspace partial pressure (p) for the concentration:

Describing N by p, vial volume (V) (6), and T through the ideal gas assumption, eqs 1, 2, and 3 can be combined to describe the ingress of oxygen into the vial, eq 4:

Equation 4 can be solved into the working model eq 5 describing either the defect diameter (d) or the headspace partial pressure, under the assumption that the defect is ideally circular and accounting for the initial headspace partial pressure (pini):

The diffusion constant is theoretically estimated from the Chapman–Enskog theory (12) by eq 6:
 using the laboratory conditions T = 298 K and p = 1 atm. These values represent the storage conditions of the vials tested and can be adjusted to accommodate for different storage conditions. This allows the model to consider storage in conditions other than the ones used in this study.
2.5. Corrections to the Viscous Flow Model
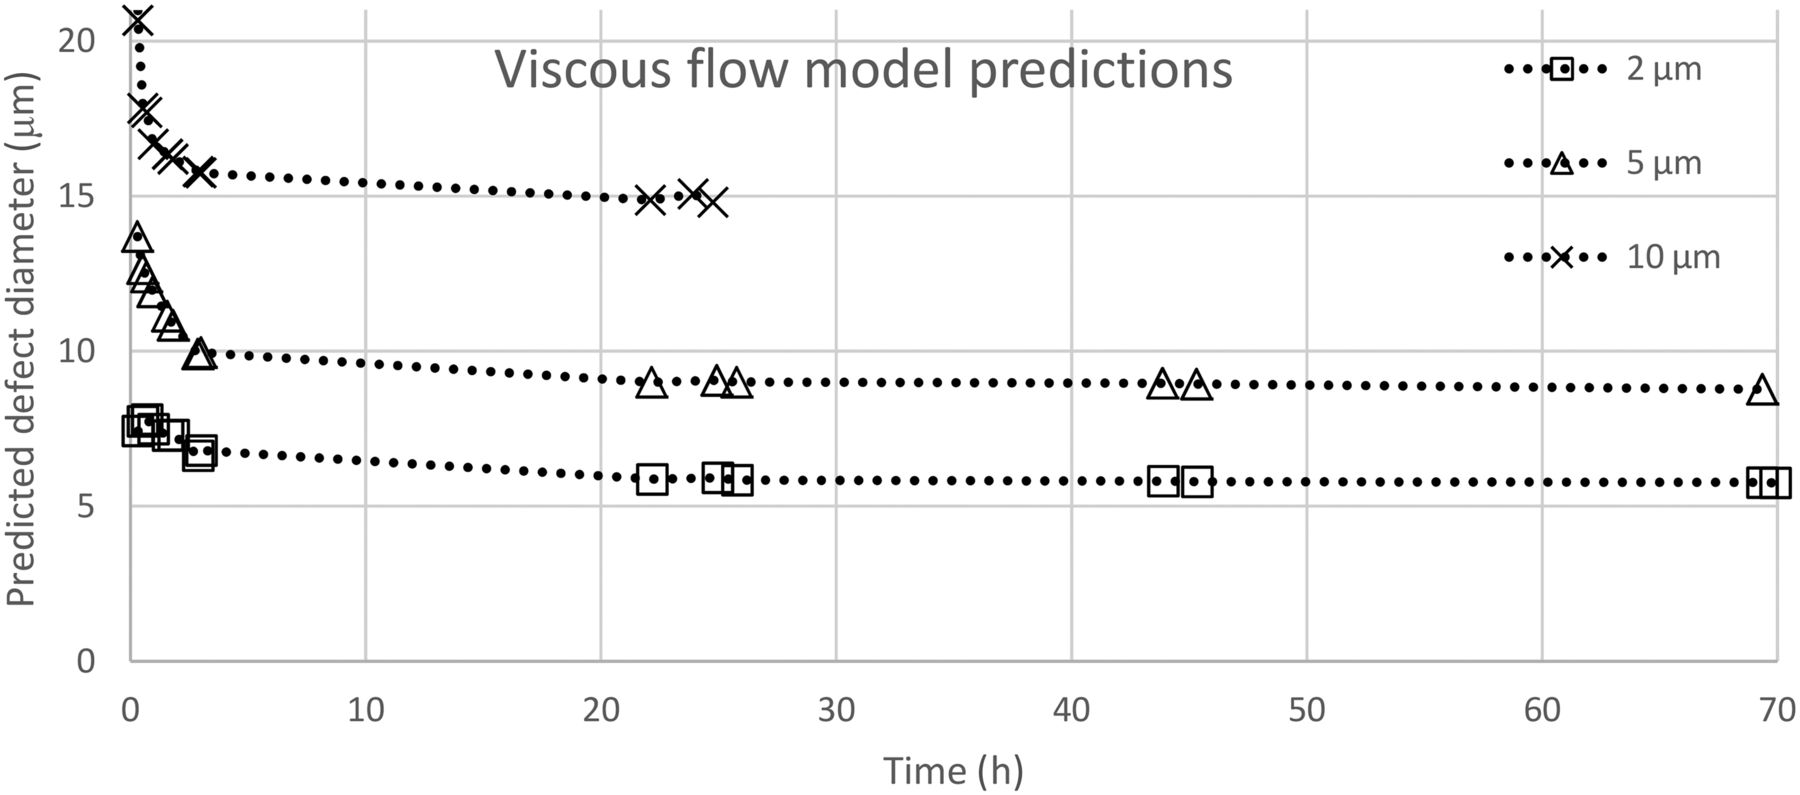
If the viscous flow model as shown above is used with the actual dimensions for z and V and includes headspace data for vials capped under the conditions listed above (see Section 2.2), the defect size predictions in Figure 2 can be obtained.

Viscous flow model predictions for laser-drilled objects.
The viscous flow model does not predict the defect size very well at the first time points. This is due to the effusion effect caused by the small pressure difference inside the vial and surrounding pressure. The results show that the model does not accurately describe the start of the progress for a leak of a certain size. The effect is larger for the 10 μm defect when compared with the 2 μm, due to the flow-rate dependency of the leak size. In addition, the model prediction of the defect size is stable over time, but it is offset from the actual value. This is caused by the assumption of viscous flow regime being incorrect. As shown by Prisco et al. (6), defects of these sizes are in the molecular slip flow regime, which consists of an unknown distribution of the flow between Knudsen flow and viscous flow, with Knudsen flow becoming more dominant as the defects get smaller. This is shown nicely in Figure 2: as the offset gets relatively larger, the defect gets smaller.
Using this knowledge, the model prediction can be fitted to the actual hole size by introduction of a new constant as a correction factor, referred to as β. This allows the model to retain the ability to modify any parameter already present in the model and to maintain the original theoretical expression. It is advantageous to use the version of eq 5, which expresses the area of the defect, and corrected with β this becomes eq 7:

The ability to change the individual parameters in the model is paramount, as they can all vary independently of each other, having great effect on the ingress progress during measurements. Victor et al. (9) find that owing to the varying geometry of laser-drilled holes, the diffusive parameters used in their model do not necessarily correlate to the defect size. This, however, does not seem to be the case in our work. Figure 3 shows that the progress for the different laser-drilled holes is very similar, well within the 20% uncertainty of the holes themselves, and at the same time significantly distinct from the micropipette holes. This clearly indicates that the geometric shape of the individual hole does not play a significant part in the ingress progress. The difference between the two types of defects is the length of the holes, which shows that the z value is highly important when dealing with diffusion driven ingress.

2 μm nominal diameter holes with different hole lengths.
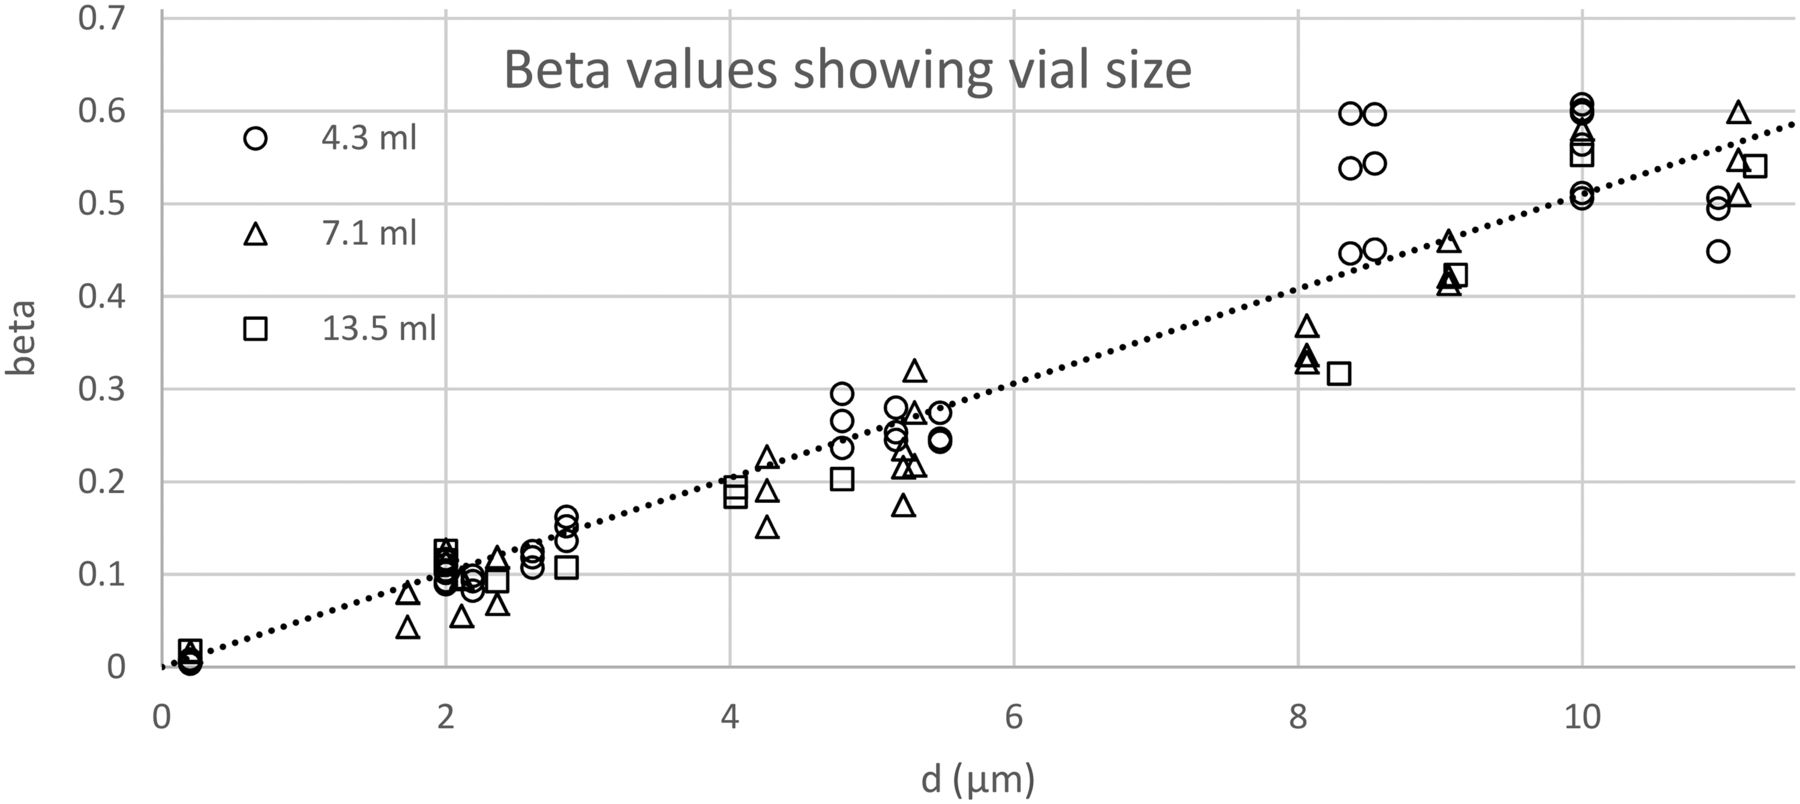
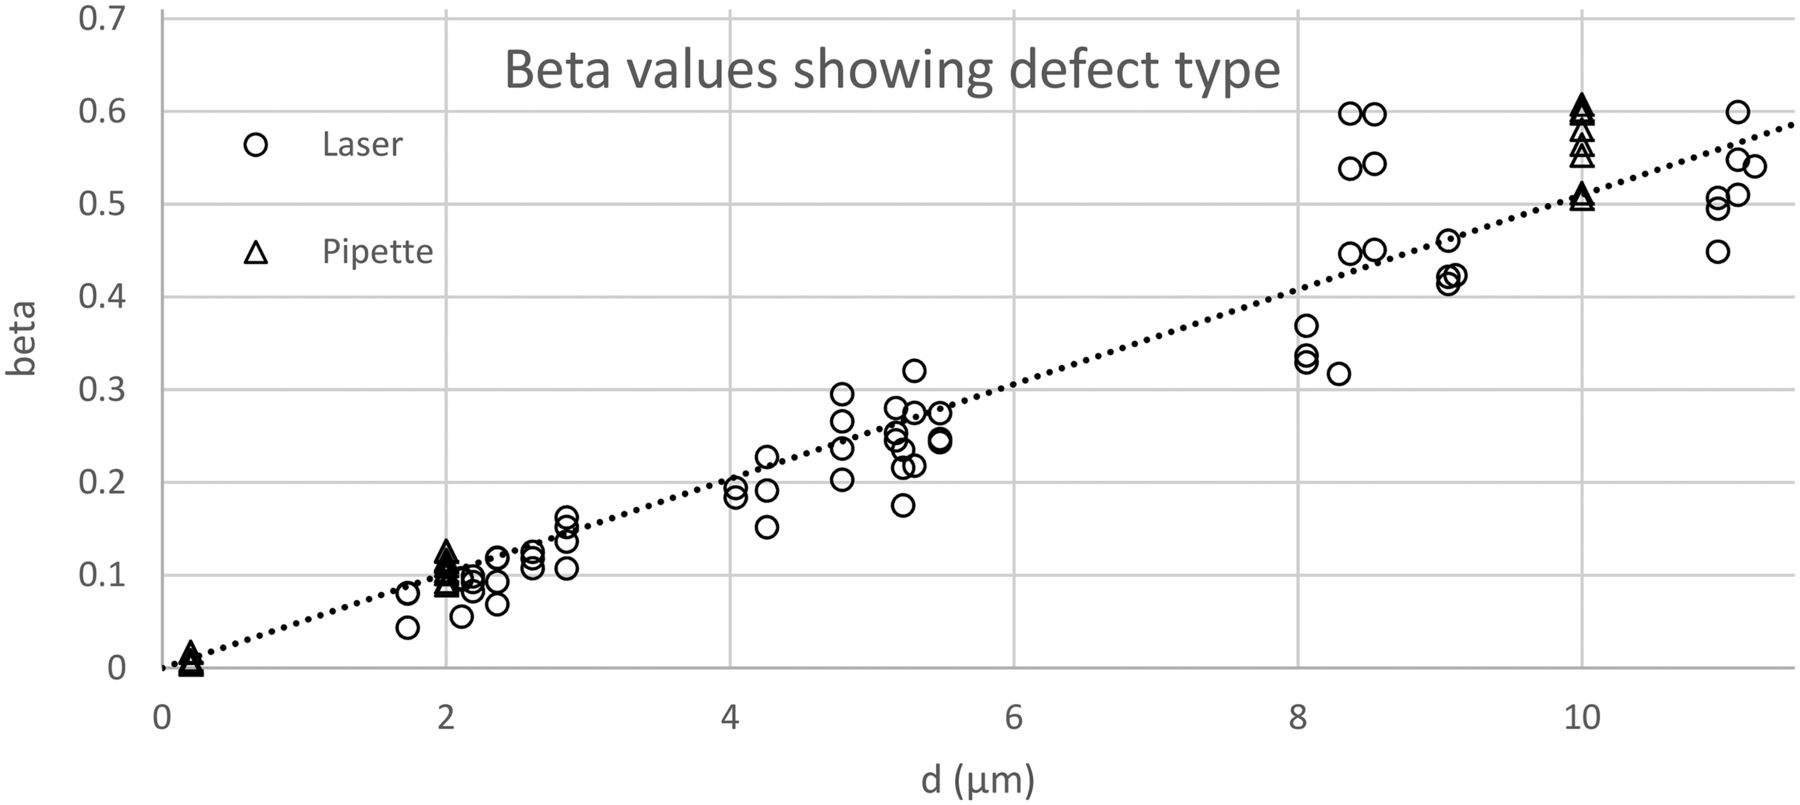
Using eq 7, a calculation of the correction (β) has been done for all positive control vials tested. The results are shown varying the vial volume (Figure 4) and the defect type (Figure 5). For β, the value z = 18 μm has been used for laser-drilled holes and 50 μm for micropipettes holes.

Correction factor β shown according to vial size for positive control vials, laser-drilled and micropipettes.

Correction factor β shown according to defect type.
It is clearly shown that the β value has no correlation to either the vial size or the defect type but has a very high linear correlation to the defect size.
The above conclusion can be used to generate a general expression for β as a function of the defect diameter, β = a · d + b. The β function is estimated as the regression of all β values generated by the experiments, across all used vials sizes, defect sizes, and defect types, shown as the dotted lines in Figure 4 and Figure 5. The resulting function is eq 8:

Applying this to eq 7, a model can be developed and used on any type of defect, in any vial size, and under any storage conditions, eq 9:

Simplifying eq 9 into eqs 10 and 11 allows for predictions of pressure over time, given a certain defect or predictions of defect diameter, following pressure change measurements over time. All input is made in SI units:


This simple model allows for variations in vial volume, defect length, defect diameter, and storage conditions during a CCI study. This allows the model to be used on vials and leaks that have not been included in this study.
3. Results and Discussion
3.1. CCI Testing
The model in eq 10 can be used for CCI testing. This is done by setting the defect diameter and length appropriate to the level of detection desired and using parameters according to storage of the test vials.
The equation has two parameters regarding the defect, the length and the diameter. Usually, both will be unknown, which constitutes a problem when using the model, as it consists of only one equation with two degrees of freedom. This can be approached in different ways, depending on the use of the model. When using it for CCI testing, the most beneficial way is to use a worst-case scenario for the length of the defect.
In eq 10, as well as Figure 3, it can be seen that the speed of oxygen ingress in the model decreases with increasing defect length. When using the model for CCI testing, the output of the model is used as a maximum allowed limit for oxygen ingress. Thus, the worst-case scenario for the defect length is the longest possible length. Using a high value for z, we ensure that the model also will be able to detect a shorter leak. This will allow the model to reject vials with acceptable defects, while no vials with unacceptable defects are passed.
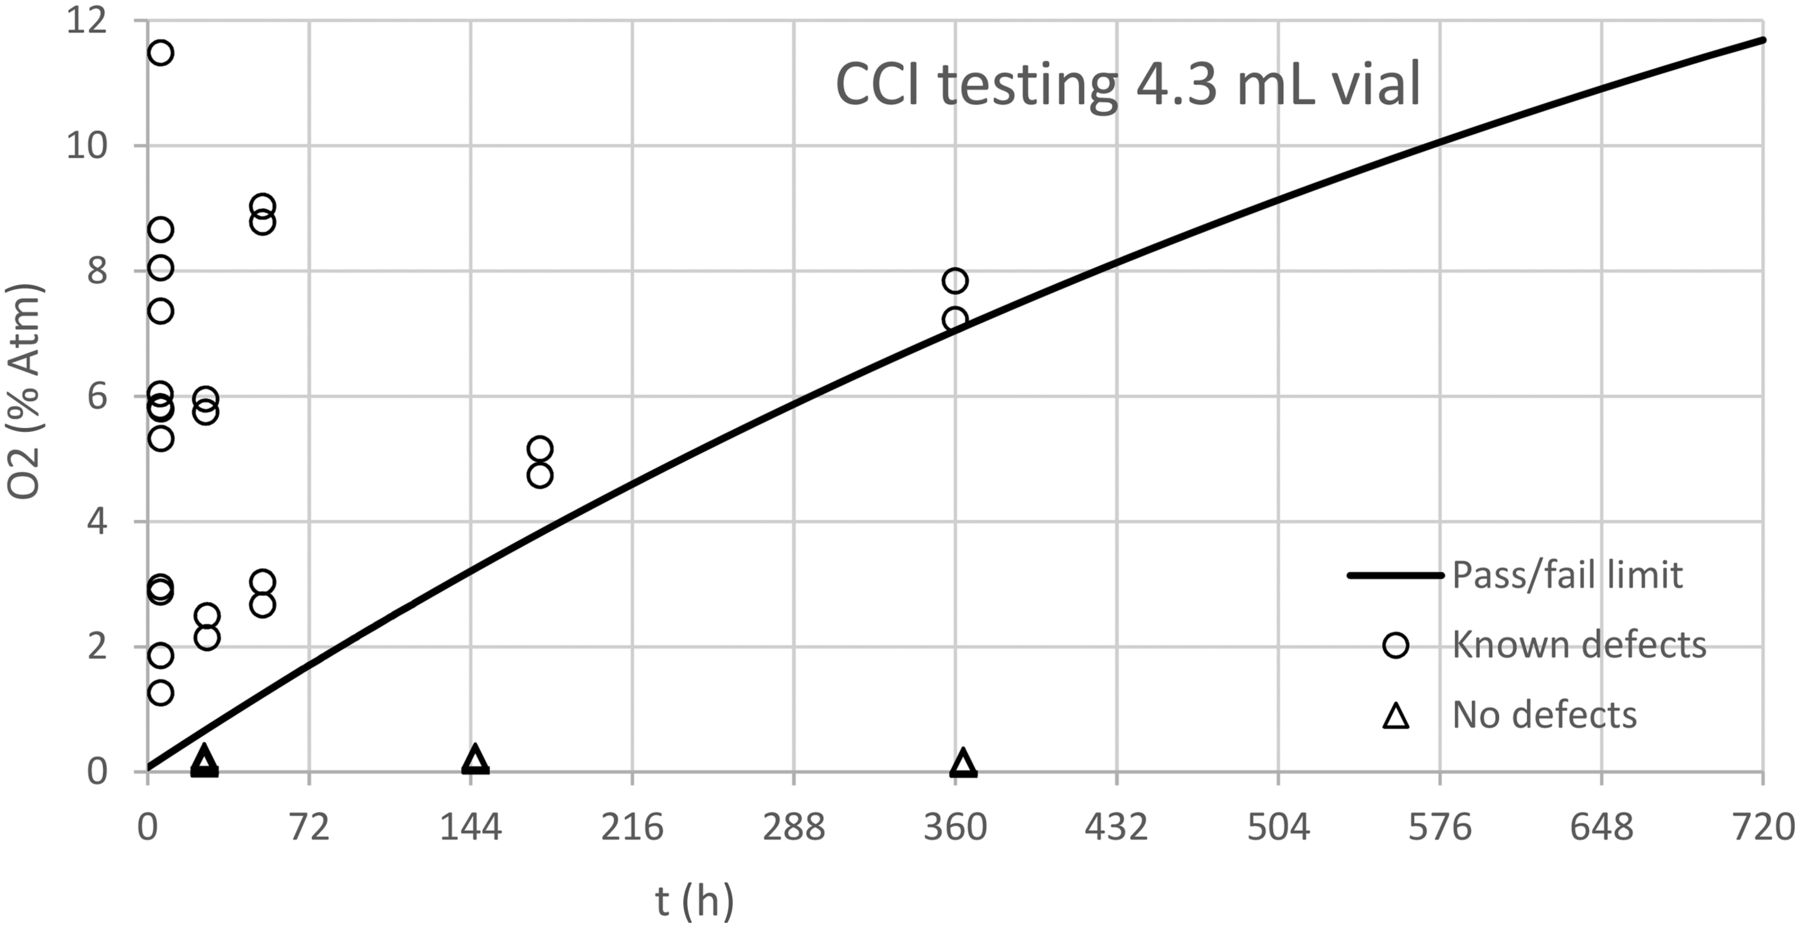
For the purposes of CCI testing, a defect diameter of 0.2 μm is chosen (4), and the defect length is set to 50 μm. The value for z is a high estimation based on the above worst-case criteria. Owing to the limited research into naturally occurring chips and cracks in borosilicate glass and the previous discussion in the Section 1, it is the best current estimation. This allows the model to generate a pass/fail limit for the measured oxygen concentration over time, which can be used to identify CCS and demonstrate that the package does not permit leakage beyond the product's maximum allowable leakage limit as illustrated in Figure 6.

Model used for CCI testing with known defects ranging from 0.2 to 10 μm and negative controls with no known defects.
Figure 6 shows that the model is able to detect 42 out of 42 known defective vials tested, within the defect range 0.2–10 μm. With the equipment having a maximum uncertainty of ±0.2 %Atm, the minimum time needed to distinguish a defective vial from a nondefective vial is approximately 12 h for a 4.3 mL vial. This minimum time is directly proportional with vial volume; as such, the minimum detection time is approximately 20 h for a 7.3 mL vial and 38 h for a 13.5 mL vial.
As can be seen in Figure 6, the initial values measured (for the 0.2 μm series) are somewhat higher than the model prediction. This is due to the initial effusion phase, which occurs because the vial pressure is lower than ambiant pressure (as discussed above in Section 1). This should, in theory, allow for an even smaller minimum detection time, with results indicating as low as <3 h for 4.3 mL vials. This is, however, not explored further in this study.
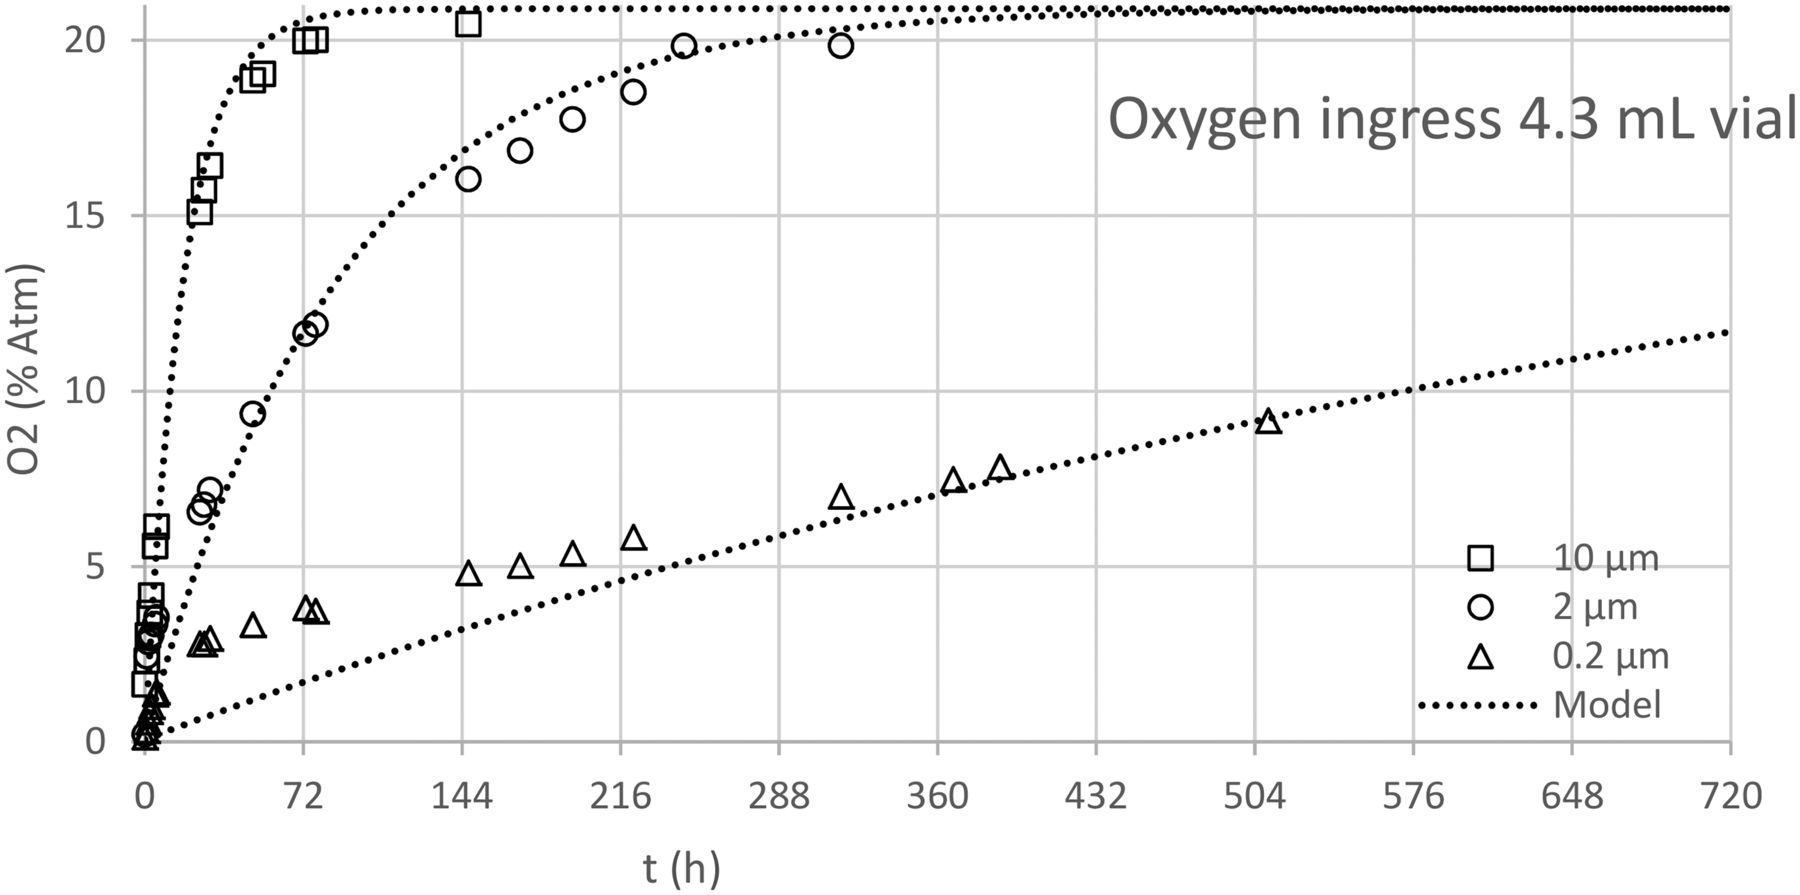
3.2. Oxygen Ingress Prediction
The model can predict the oxygen ingress over time with a fair amount of accuracy (see Figure 7). However, it does not describe the first part of the ingress very well due to effusion (as mentioned in Section 2.5), and again, this becomes more pronounced as the defect sizes get smaller. It is important to note that initially with the model calculations for the 0.2 μm leak size, the values are below the measured values until 300 h. This will result in the model predicting a too large defect diameter when used in this timeframe. However, in relation to CCI, a defect diameter estimation that is too large will lead to rejection of a vial that is acceptable but will never accept a vial that is not acceptable.

Model prediction of oxygen ingress compared to measured ingress.
3.3. Defect Size Determination
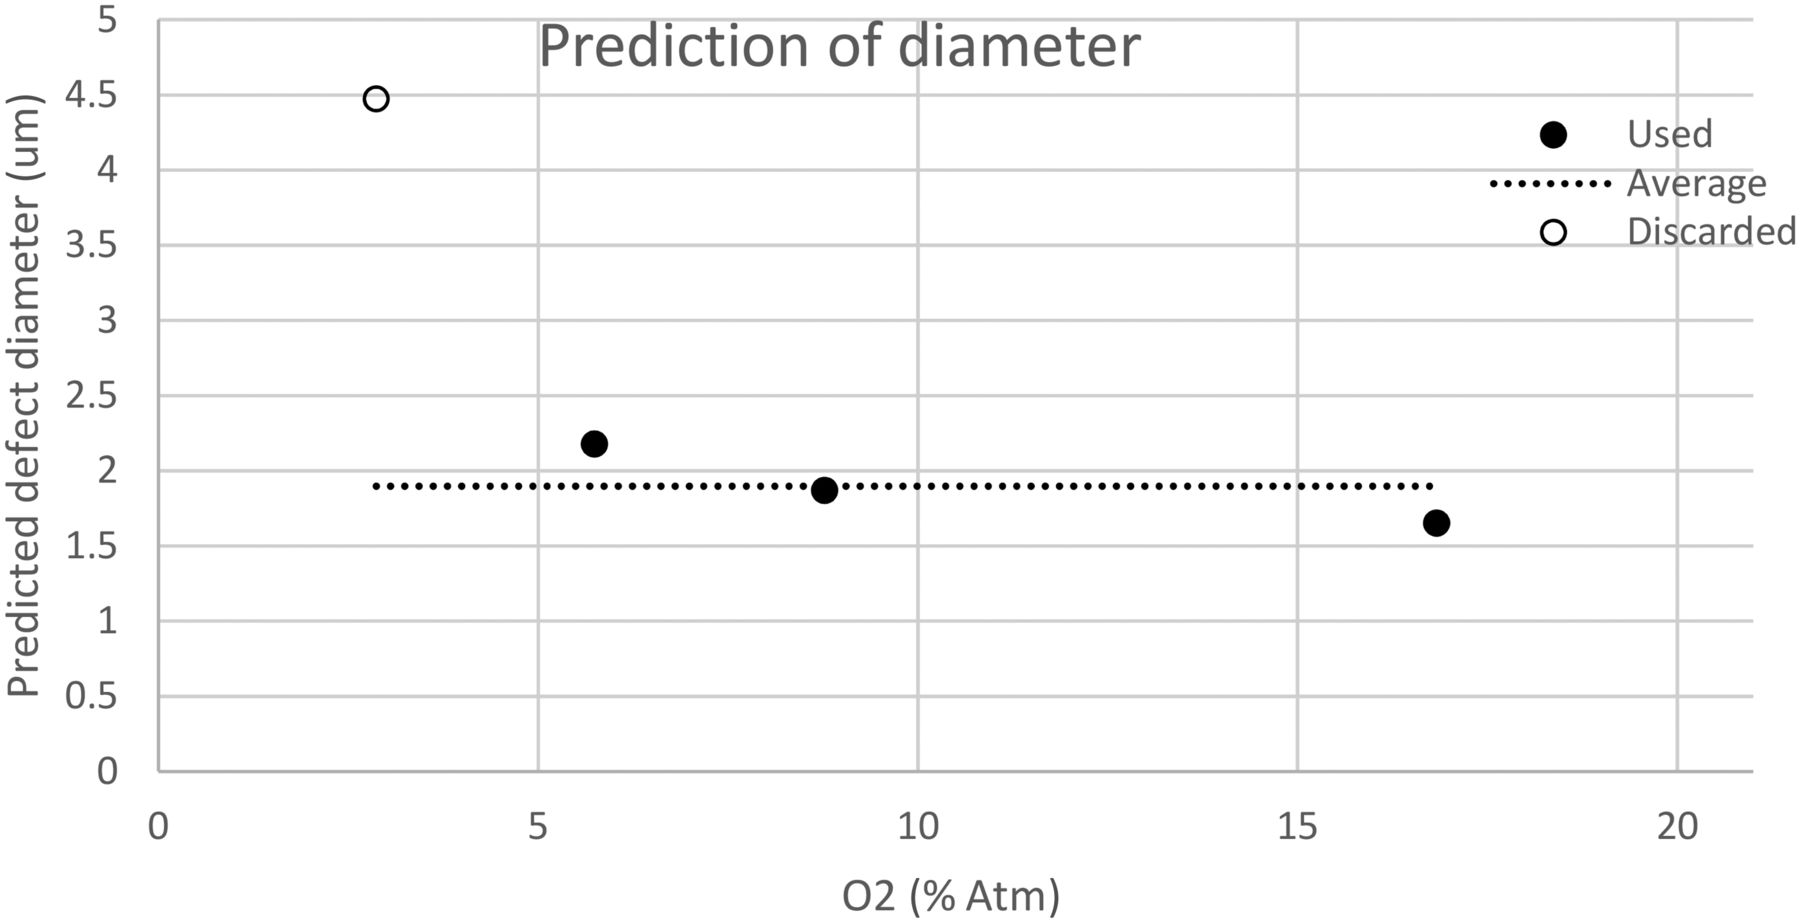
The model can determine one of the two characteristic properties of a defect, either defect length or defect diameter, under the condition that the other one is known. This has practical application in that length of artificial defects can be controlled fairly well in the manufacturing process, owing to the length simply being on a larger scale than the diameter. This allows the model to be used as either primary or secondary verification of positive control defect sizes.
The method for using the model in this way relies on a series of steps. First, measurements should be made in a similar manner as described above. For each set of measured values, the predicted defect diameter or defect length is calculated by eq 11. The predictions are plotted as a function of the oxygen concentration. Estimation of when the first predictions become more consistent is made, and any predictions that fall too far away from the others are discarded. This concept is used in order to ensure that the estimation with the model is only used in the diffusion flow regime as discussed above.
The remaining predictions are now used to find an average prediction or final prediction of the defect diameter or length. The method used to predict the defect diameter is shown visually in Figure 8.

Visual representation of the defect prediction method used to predict defect diameter.
The method has been used to test objects with defect lengths of 50 μm and nominal diameters as specified by the supplier with good results, as shown in Table I.
Defect Diameter Predictions of Positive Control Vials with Micropipette Defects
3.4. Model Limitations
The model parameters and calculations performed in this work are based on sealing of the container at pressures close to atmospheric (slight vacuum). If the containers are closed at very low pressures, the effusion regime is entered, and the model will not describe correctly the first part of the pressure increase. However, containers sealed under vacuum have stricter requirements for control of the headspace gas composition and pressure in the vial. As a consequence, the CCS might have to be tested with other methods, including pressure as a parameter.
The model presented was used with parameters for z estimated based on the chosen positive controls. When a CCI study is performed, it is necessary to include the data for measurements with headspace over time for each positive control and estimate a new β value based on the reported d values and approximate values for z. To obtain the best fit, it also might be necessary to refit the values for z for each type of positive control. In this work, two parameters (the value for micropipettes was fixed and not estimated). With the usually high number of data points involved in such a study, the parameters are estimated with good precision.
Also, as mentioned above, the model is derived using 20°C as the temperature during measurements and storage. However, using other temperatures during the CCI study (e.g., including temperature variation during transport), it is necessary to change the value of T in eq 6 for the diffusion coefficient, with a small correction to the model parameter β as a consequence. However, this has not been investigated in this work.
Finally, the model correction parameter β was estimated for vials in the range 2–12 mL. The limitation in size above this range has not been investigated.
4. Conclusions
A simple model that can be used for CCI testing for freeze-dried drug products in vials has been presented. The model is based on the fundamental equations for diffusion by Fick's law and Knudsen diffusion (11) using an approximation to the equation for diffusion. Headspace oxygen analysis is used as the CCI testing method. The vials that are used in the study are prepared by a simple evacuation procedure directly in a lab-scale freeze dryer, with test vials representing the headspace conditions of the drug product.
Different vial sizes in the range 4.3–13.5 mL volume (2–12 mL H2HN vials) and positive control vials with defect diameters in the range 0.2–10 μm have been included in the study to develop and test the proposed model. Positive control vials made with both laser-drilled holes and micropipettes inserted into the vial surface have been investigated. A constant (linear approximation) is used to fit a model correction parameter (β) valid for all vial sizes investigated. The final model can be used with this single parameter to verify positive controls ≥0.2 μm and to predict leak diameters for vials. Using this model, headspace analysis can be used to determine if a vial has a leak and how large the leak is, which can be used to determine if the vial is susceptible to microbial ingress and conforms to the product's maximum allowable leakage limit.
The model shows good correspondence between the values reported from the suppliers of laser-drilled holes and micropipettes when including both the defect length and defect diameter for the positive control vials and by using only one parameter to represent both types of controls. It also has been demonstrated that the model can be used directly in control of vials susceptible to microbial ingress for a biopharmaceutical drug product life cycle.
Conflict of Interest Declaration
The authors declare that they have no competing interests.
- © PDA, Inc. 2019


Jump to section
Related Articles
Cited By...
- Comparing Container Closure Integrity Test Methods--Performance of Headspace Carbon Dioxide Analysis versus Helium Leakage Using Positive Controls
- Container Closure Integrity Test Method Development on Vials Stored at -80{degrees}C Using Headspace Carbon Dioxide Analysis
- A New Integrated Modeling Approach with Case Studies for Gas Transmission of Container Closure Headspace