
Abstract
A drug delivery system is designed to administer a therapeutic dose according to its label claim. Upon delivery of a parenteral drug product, the volume remaining inside the container that cannot be extracted at the end of drug administration is called the hold-up volume (HUV) and is primarily considered product wastage. To meet the label claim, every drug product container is filled with a slight excess volume. For early-stage products in clinical phase, for which material availability is often a limitation, excess volume in drug product containers has to be determined experimentally using several grams of product. In such scenarios, established models that can predict HUV in primary drug product containers would be valuable for product development. The objective of this study was to determine HUV with 95% confidence intervals across various container closures and drug delivery systems by using aqueous PEG 400 solution mimicking the viscosity of biologic drug products. ISO 2R, 6R, and 10R vials and single-use hypodermic syringes attached to a Luer lock needle (25 gauge, 1½ in.) were used to mimic parenteral drug product container and delivery systems for determination of HUV. Glass prefilled syringes in 1 mL and 2.25 mL configurations were also used to determine HUV with 95% confidence intervals. A linear regression model was developed for determination of HUV as a function of viscosity and as a function of container closure and a needle-based delivery system. This model predicting HUV was confirmed by using monoclonal antibodies of varying formulations and viscosities for container closure and delivery systems tested in this study. The model provided here can be used to determine HUV for a particular container closure for a drug solution with known viscosity that can subsequently be used to evaluate fill volume specifications and label claim for a dosage form.
- Container closure system
- Biologic drug product
- Hold-up volume
- Fill volume specification
- Label claim
- Dosage form
- Drug delivery system
- Vials
- Prefilled syringe
Introduction
Parenteral drug products including biologics are sterile, pyrogen-free therapeutics administered into the systemic circulation typically through intravenous, intramuscular, or subcutaneous routes of administration (1). These products are protected by primary packaging components ensuring sterility of the product by conserving against environmental factors, including oxygen ingress and microbiological contaminants (2). Administration of parenteral product generally requires a needle-based system, such as a syringe, autoinjector, wearable pumps, infusion set, and so forth. In addition, there are a variety of end users that include self-administration by patients, preparation by a pharmacist, and administration by a healthcare provider (3).
The most commonly used primary container closure system (CCS) for parenteral drug products is a glass vial with a specific rubber stopper, sealed with an aluminum crimp cap (4). Typically, glass vials made up of borosilicate glass classified as type I glass are used because they provide a high hydrolytic resistance for long-term storage of pharmaceutical products (5). Following ISO standards, vials are designed and manufactured to meet requirements for delivery of varying doses (6). The rubber stoppers for glass vials are critical in providing integrity to closed CCSs and are available in 13 mm and 20 mm neck diameter configurations (7). The design for rubber stoppers can include serum stopper and lyophilization stoppers, and their chemical composition consists of elastomer, filler, vulcanizing agents, and color pigments (2). Vials closed with rubber stoppers are capped with aluminum crimp caps and constitute the third part of the CCS. Crimp caps typically consist of an aluminum skirt and may be further protected by a plastic flip-off button on the top, and their primary function is to maintain seal integrity (2).
Although vials remain one of the most commonly used primary packaging containers for parenteral products, prefilled syringes (PFSs) have attracted considerable interest from biotechnology companies as primary containers because of user convenience, reduced risk of contamination, reduced overfill requirements, and compatibility with delivery devices such as autoinjectors for self-administration purposes. Currently, more than 100 drugs and vaccines are available in PFSs across different therapeutic classes (8). Humira, Enbrel, and Copaxone are examples of blockbuster drugs being extensively administered via PFSs, and they consist of a glass barrel made up of type I glass that is siliconized for the ease of syringe functionality (9). Once the product is filled during fill-finish operations, the glass barrel is stoppered using a plunger stopper resulting in a finished primary drug product. The third part of a PFS device system consists of a plastic plunger rod used to advance the plunger stopper; however, it does not come in contact with the drug product.
Drug products that are marketed in either vials or PFSs are administered using needle-based systems. For vials, the drug product is typically extracted into disposable, single-use polymer syringes attached to a hypodermic needle and subsequently used for injections/infusion in patients (10). On the other hand, PFSs that are manufactured with staked needles decrease the risk of contamination and increase the ease of self-administration by the end user. The type of needle used on single-use, hypodermic syringes and PFSs can vary based on viscosity of the drug and the injection site, as the drug viscosity determines the needle gauge and subcutaneous vs intramuscular route determines the needle length. For example, for subcutaneous injections, 25 to 30 gauge needles with a length of ½ to ⅝ in. are used, whereas for intramuscular injections, 21 to 27 gauge needles with a length of ⅞ to 1½ in. are used (11, 12). Similarly, if the viscosity of a drug product exceeds 10 cP, then the needle gauge is in the range of 27 to 30 gauge (11, 13).
During manufacturing of drug product in its primary CCS, each container is filled to its target fill volume, which slightly exceeds the content indicated as label claim of the drug product (14). The excess volume is meant to be sufficient to permit withdrawal and administration of labeled volumes (15). The recommended excess volume for mobile and viscous liquids in a range of fill volumes is provided in USP General chapter <1151> (15, 16). The excess volume, which is generally referred to as “overfill volume,” has garnered scrutiny by the Food and Drug Administration (FDA) and other regulatory agencies because it can lead to medication errors, misuse of leftover drug product, or pooling of vials to obtain a single dose (15). Therefore, the overfill volume for every product in clinical use or for commercial application should be justified. Typically, the overfill in the drug product container is determined by taking into consideration the “hold-up volume” (HUV), which is the amount of solution remaining in the syringe when the plunger has reached the end of the syringe barrel upon administration of the drug. For drug product in vials, HUV is a combination of HUV in the vial when the drug is extracted into a single-use syringe and HUV in syringes at the end of drug delivery. In comparison, the solution remaining in the PFS is the only HUV to be considered when evaluating overfill; therefore, the PFS is preferred owing to its minimal overfill volume (9, 17).
We hypothesized that HUV in a primary CCS is a function of container closure design and surface area that the product comes in contact with regardless of the fill volume in that particular system. In addition, we also hypothesized that the physical characteristics of the solution that is viscosity could also influence the HUV. Previous work carried out on evaluating dead space for intradermal delivery of vaccines showed that syringes with staked needles had relatively low HUV compared with syringes with a detachable needle (18). However, this study did not take into consideration the solution characteristics. During drug development, HUV has to be determined to ensure the label claim of deliverable volume can be administered for every drug product configuration. Viscosity is also a design input for the primary container because increased viscosity leads to higher injection forces when delivered using a PFS, autoinjector device, or a polymer hypodermic syringe/needle system (19⇓–21).
The experimental determination of HUV often requires a significant amount of product, which is often a limitation for products in early stages of development. In such cases, prediction models for HUV for setting fill volume and label claim specifications would offer advantage in product development. The objective of this study was to determine HUV for ISO standard vials (2R, 6R, and 10R vials) and PFSs (1 mL and 2.25 mL PFS) as a function of solution viscosity to derive a regression model that can be used for predicting HUV for a particular container closure configuration and a drug product with a known viscosity. For this study, 25 gauge, 1½ in. disposable needles were used for all vial types (14), and 27 gauge, ½ in. staked needles were used for all PFS types.
Materials and Methods
Materials
Type I glass vials in 2R, 6R, and 10R ISO standard configuration were purchased from Schott North America. The 2R vials had 13 mm neck size, whereas 6R and 10R vials had 20 mm neck sizes. Corresponding butyl rubber serum stoppers (13 mm and 20 mm diameter) were purchased from West Pharmaceutical. Sterile disposable polypropylene syringes with nominal volume capacity of 1 mL (part 309,628), 3 mL (part 309,657), 5 mL (part 309,646), and 10 mL (part 309,604) were purchased from Becton Dickinson. Sterile 25 gauge hypodermic needles, 1½ in. length, were purchased from Becton Dickinson.
The 1 mL glass PFS Hypak TM SCF syringes with staked 27 gauge needles, ½ in. length, with rigid needle shield (RNS) and cut flange were purchased from Becton Dickinson. The 1 mL PFS plunger stoppers (part 11402,013) were purchased from West Pharmaceutical.
The 2.25 mL glass PFS EZ-Fill TM syringe with staked 27 gauge needles, ½ in. length, with RNS and round flange were purchased from Ompi. The 1 to 3 mL PFS plunger stoppers (part 11101,406) were purchased from West Pharmaceutical.
PEG 400 was purchased from Fisher Scientific. Monoclonal antibody (mAb)-1, an IgG2 at 150 mg/mL, mAb-2, an IgG4 at 10 mg/mL, and mAb-3, an IgG4 at 9 mg/mL, were manufactured at Teva Pharmaceuticals from Chinese hamster ovary cells. The formulation of mAb-1 and mAb-3 tested contained 0.2 mg/mL PS80, whereas mAb-2 formulation did not have any surfactant.
Methods
Preparation of PEG 400 Solutions and Characterization of Viscosity and Density:
Concentrated PEG 400 was used to prepare aqueous dilutions at 10% (wt/vol), 20% (wt/vol), 30% (wt/vol), 50% (wt/vol), 60% (wt/vol), and 70% (wt/vol) using deionized MilliQ water to prepare solutions of varying viscosity. The samples were allowed to mix homogenously by mixing for ≥30 min at room-temperature.
Aqueous PEG 400 solutions at different concentration were prepared to mimic the viscosity of biologic formulation. Viscosity of each aqueous PEG 400 solution was measured using a Brookfield DV-III cone-plate rheometer at a shear rate of 150 s − 1 for 10% to 50% PEG 400 solutions. Viscosity for 60% and 70% PEG 400 solutions was determined at a shear rate of 60 s − 1. Before each measurement, the sample was equilibrated to 20 °C. Each sample was analyzed in triplicate measurements to obtain average viscosity of each solution.
Density of each PEG 400 solution was measured using Anton Paar DMA 500 density meter (Anton Paar USA). Before each measurement, the sample was equilibrated to 20 °C. Each sample was analyzed in triplicate measurements to obtain an average density of each solution.
Determination of HUV in 2R Vials and 1 mL Hypodermic Syringe:
To determine HUV in 2R vials, 27 vials were chosen for each solution of PEG 400, and the dry weight of vials and corresponding stoppers were recorded for each type of PEG 400 solution (10%–70% wt/vol). This weight was referred to as the dry weight of vial/stopper. After obtaining the dry weight of each vial/stopper, 27 vials were filled with one particular PEG 400 solution at 1 mL fill volume using a calibrated pipet and stoppered. After filling, 27 vials per type of PEG 400 solution were divided among 3 analysts (A, B, and C).
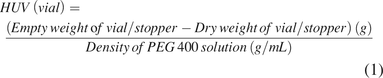
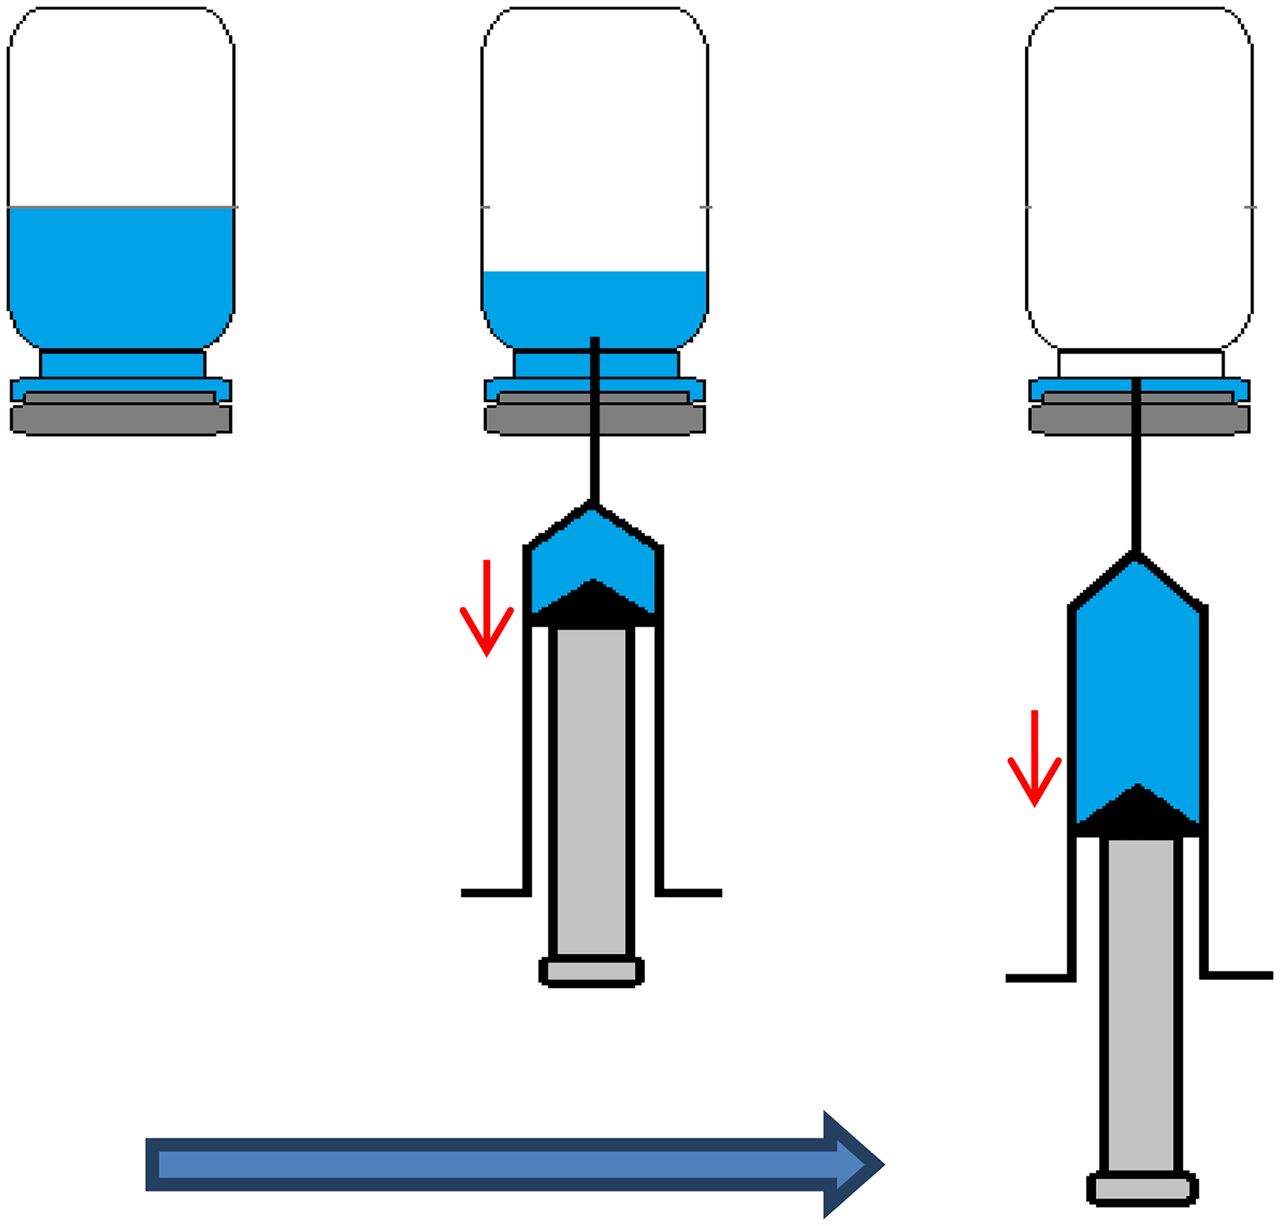
Each analyst labeled, weighed, and recorded the weight of the filled vials. This weight was referred to as filled vial/stopper weight. Per vial, one empty 1 mL syringe and 25 gauge disposable needle were assembled, and the weight was recorded. This weight was referred to as the dry weight of syringe/needle. Subsequently, the vial was inverted to evenly wet the surface inside the container closure, and within 20 min of filling, the solution was extracted. To withdraw the contents, the vial was inverted, and solution was extracted by inserting the needle attached to the syringe through the stopper while ensuring that entire contents of the vial were extracted into the disposable syringe (Figure 1). Following extraction, the empty vial with HUV was weighed and recorded. This weight was referred to as the empty vial/stopper weight. The weight of empty vial/stopper was subtracted from the dry weight of vial/stopper to obtain the HUV in that vial by dividing by the density of that particular PEG 400 solution (Table I), as shown in eq 1.

Schematic of procedure for extraction of solution from vial using a disposable syringe for HUV determination.
Density and Viscosity Values for PEG 400 Solutions at 20 °C1
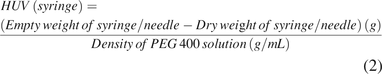
The filled syringe with extracted solution was weighed as well. This weight was referred to as the filled syringe/needle weight. Then, the solution was expelled from the syringe into a waste container by pressing the plunger as it reached the end of the syringe barrel, simulating a drug delivery system. The time for expelling was in the range of 5–10 s for 1 mL volume. Empty weight of the syringe/needle was recorded. This weight was subtracted from the initial dry weight of the disposable syringe/needle to obtain HUV in the syringe by dividing by density of that particular PEG 400 solution (Table I) as shown in eq 2. The cumulative HUV is a sum of the HUV in vial and the corresponding hypodermic syringe. This procedure was carried out for n = 9 per analyst (A, B, and C) for each solution.
The cumulative HUV was determined as sum of HUV (vial) and HUV (syringe).
Determination of HUV in 2R Vials and 3 mL Hypodermic Syringe:
To determine HUV in 2R vials and 3 mL disposable hypodermic syringes, the same procedure as described above was followed but with larger fill volume. A 1.7 mL fill volume was used to fill each vial, and a 3 mL disposable syringe assembled with a 25 gauge disposable needle was used for extraction of solution. The procedure was carried out for n = 9 per analyst (A, B, and C) for each solution, and HUV was determined as average of 9 for each analyst. The time for expelling was in the range of 10–15 s for the 1.7 mL volume.
Determination of HUV in 6R Vials and 5 mL Hypodermic Syringe:
To determine HUV in 6R vials and a 5 mL disposable hypodermic syringe, the same procedures as described for the 2R vial were followed but with a larger fill volume of 5 mL. A 5 mL disposable syringe assembled with a 25 gauge disposable needle was used for extraction of solution. The procedure was carried out for n = 9 per analyst (A, B, and C) for each solution, and HUV was determined as average of 9 for each analyst. The time for expelling was in the range of 20–30 s for the 5 mL volume.
Determination of HUV in 10R Vials and 10 mL Hypodermic Syringe:
To determine HUV in 10R vials and a 10 mL disposable hypodermic syringe, the same procedure as described for the 2R vial was followed but with a larger fill volume of 7 mL. A 10 mL disposable syringe assembled with a 25 gauge disposable needle was used for extraction of solution. The procedure was carried out for n = 9 per analyst (A, B, and C) for each solution, and HUV was determined as the average of 9 for each analyst. The time for expelling was in the range of 30–40 s for the 7 mL volume.
Determination of HUV in 1 mL PFS:
To determine HUV in 1 mL PFS, 27 PFSs were chosen for each solution of PEG 400, and the dry weight of the PFS and corresponding plunger stopper was recorded for each type of PEG 400 solution (10%–70% wt/vol). This weight was referred to as dry weight of PFS. After obtaining the dry weight of each PFS, 27 PFSs were filled with one particular PEG 400 solution at 1 mL fill volume using a calibrated pipet and stoppered by manually inserting the plunger stoppers. After filling, 27 PFSs per type of PEG 400 solution were divided among 3 analysts (A, B, and C).
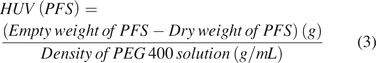
Each analyst labeled and recorded the weight of the filled PFS. This weight was referred to as the filled weight of PFS. Then, the PFS was assembled with a plunger rod, and the solution was expelled from the syringe into a waste container by pressing the plunger stopper as it reached the end of the syringe barrel. The time for expelling was in the range of 5–10 s for the 1 mL volume. Empty weight of PFS (without the plunger rod) was recorded and subtracted from the initial dry weight of the PFS with the plunger stopper to obtain HUV in the syringe by dividing by density of that particular PEG 400 solution (Table I) as shown in eq 3. This procedure was performed for n = 9 per analyst (A, B, and C) for each solution.
Determination of HUV in 2.25 mL PFS:
To determine HUV in a 2.25 mL PFS, the same procedure as described above was followed, but with a larger fill volume of 2 mL. The procedure was performed for n = 9 per analyst (A, B, and C) for each solution, and HUV was determined as average of 9 for each analyst. The time for expelling was in the range of 10–15 s for a 2 mL volume.
Verification of HUV Using Biologic Solution:
Three different mAbs (mAb-1, mAb-2, and mAb-3; all IgG subtypes) manufactured at Teva Pharmaceuticals with varying viscosity ranges were used to verify the HUV. Viscosity of each of the mAb solutions was determined following the procedure as described above at a shear rate of 150 s − 1. Each sample was measured in triplicate following equilibration at 20 °C.
HUV in 2R vials and 1 mL disposable syringes assembled with a 25 gauge needle was determined using mAb-1. This procedure was performed for n = 9 per analyst (A, B, and C).
HUV in 6R vials and 5 mL disposable syringes assembled with a 25 gauge needle was determined using mAb-2. The same mAb-2 was also used for determining HUV in a 1 mL PFS and a 2.25 mL PFS. This procedure was performed for n = 9 per analyst (A, B, and C) per CCS.
HUV in 10R vials and 10 mL disposable syringes assembled with a 25 gauge needle was determined using mAb-3. This procedure was performed for n = 9 per analyst (A, B, and C).
Linear regression analysis was performed using JMP statistical analysis software.
Results and Discussion
Various CCSs and hypodermic syringe/needle sets are used for storage and delivery of drug product for parenteral injections, respectively (22). For drug products marketed in vials, a hypodermic syringe and needle are required for delivery. A parenteral drug is injected into the infusion set for intravenous delivery or given under the skin for subcutaneous or intramuscular delivery using a hypodermic syringe/needle. Injection site, viscosity, and volume of medications are the three most important factors for selection of a hypodermic syringe and needle system. Besides these factors, size, age, and condition of the patient are also relevant in selection of the syringe/needle type to be used for drug delivery from vials. The same factors are also applicable in selection of a PFS; however, assembly of PFSs into automated delivery devices is also taken into consideration during development (22).
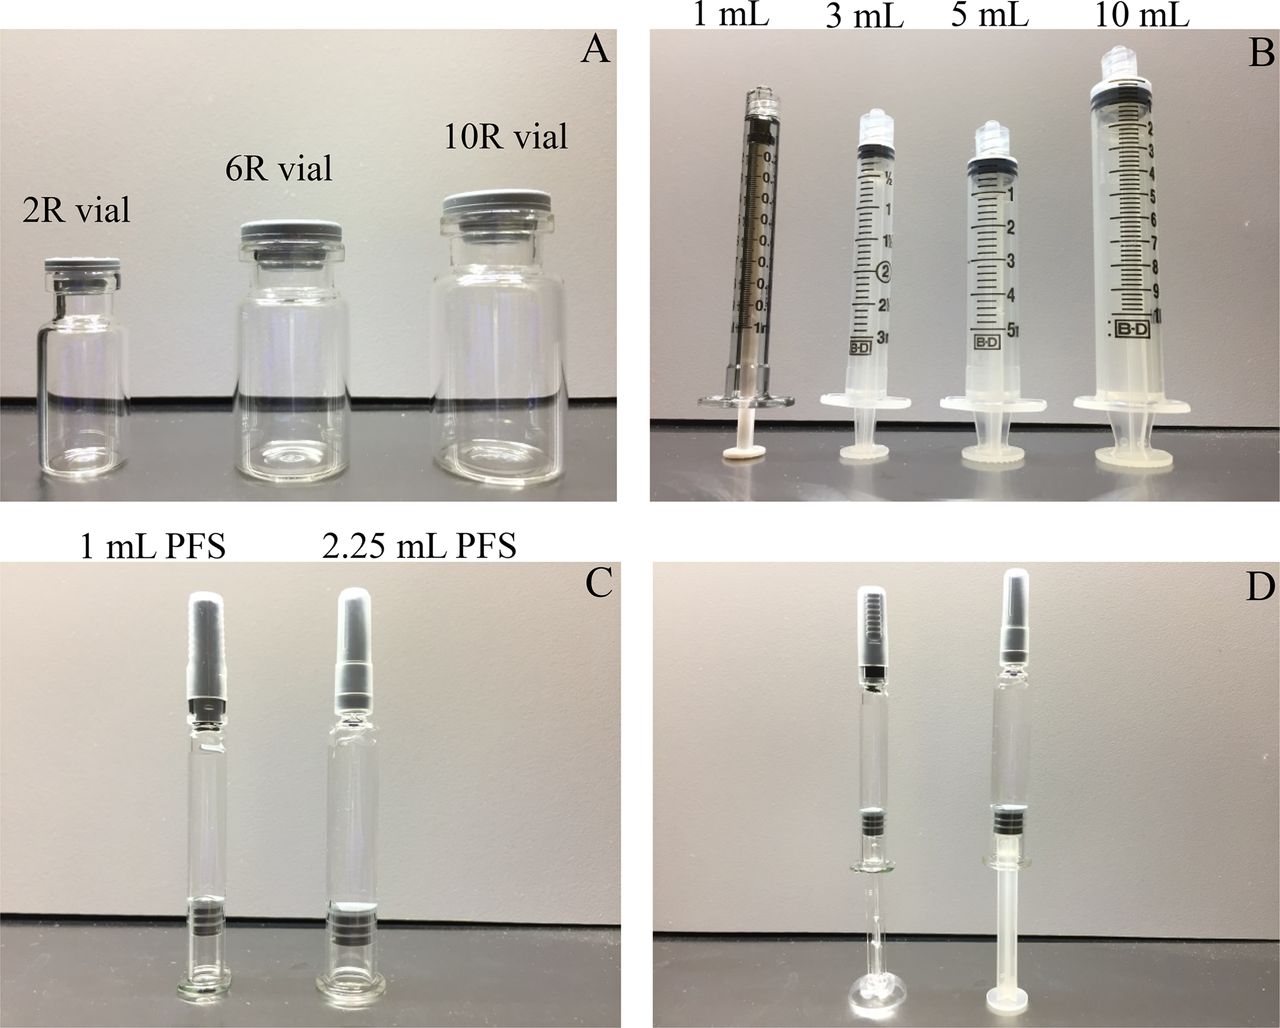
In our study, ISO standard vials 2R to 10R bracketed the most commonly used vials as container closure for biologics (Figure 2) (6). Depending on volume of delivery, hypodermic syringes ranging from 1 mL to 10 mL were used for extraction (Figure 2) (10). However, the disposable needle used was kept constant as 25 gauge, 1½ in. stainless steel needle complying with ISO standards (23) across all types of disposable syringes used to minimize the variability that might be associated with HUV in disposable needles. As PFSs, the two most common types of glass PFSs for biologics (1 mL and 2.25 mL) were evaluated in this study (Figure 2).

Parenteral drug product container and delivery systems used in this study. (A) ISO vials with butyl rubber stoppers in 13 mm and 20 mm configurations, (B) disposable syringes for delivery of solution, (C) 1 mL and 2.25 mL PFS with plunger stopper, and (D) assembled with plunger rod for delivery purposes.
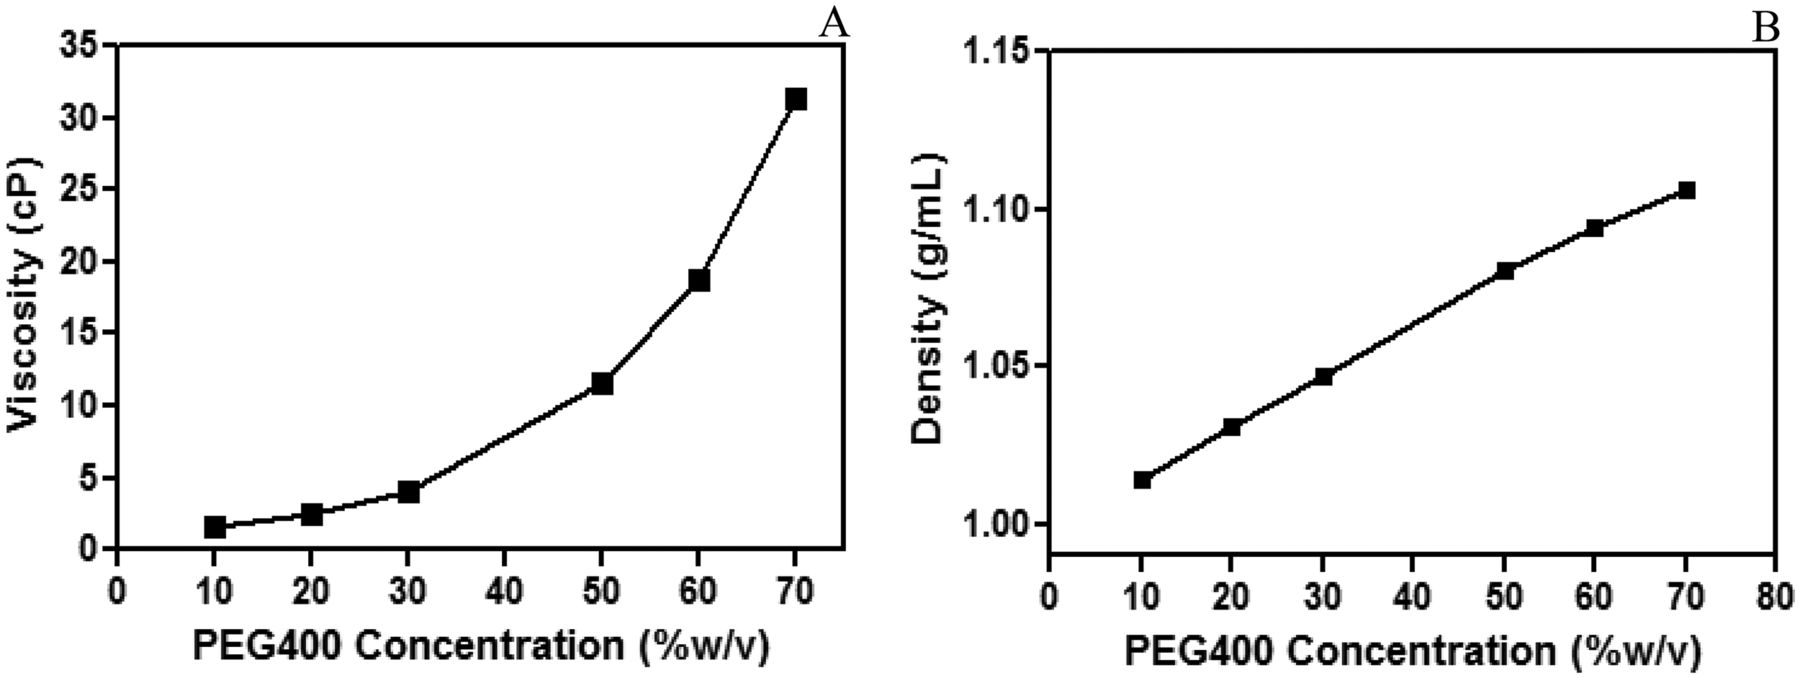
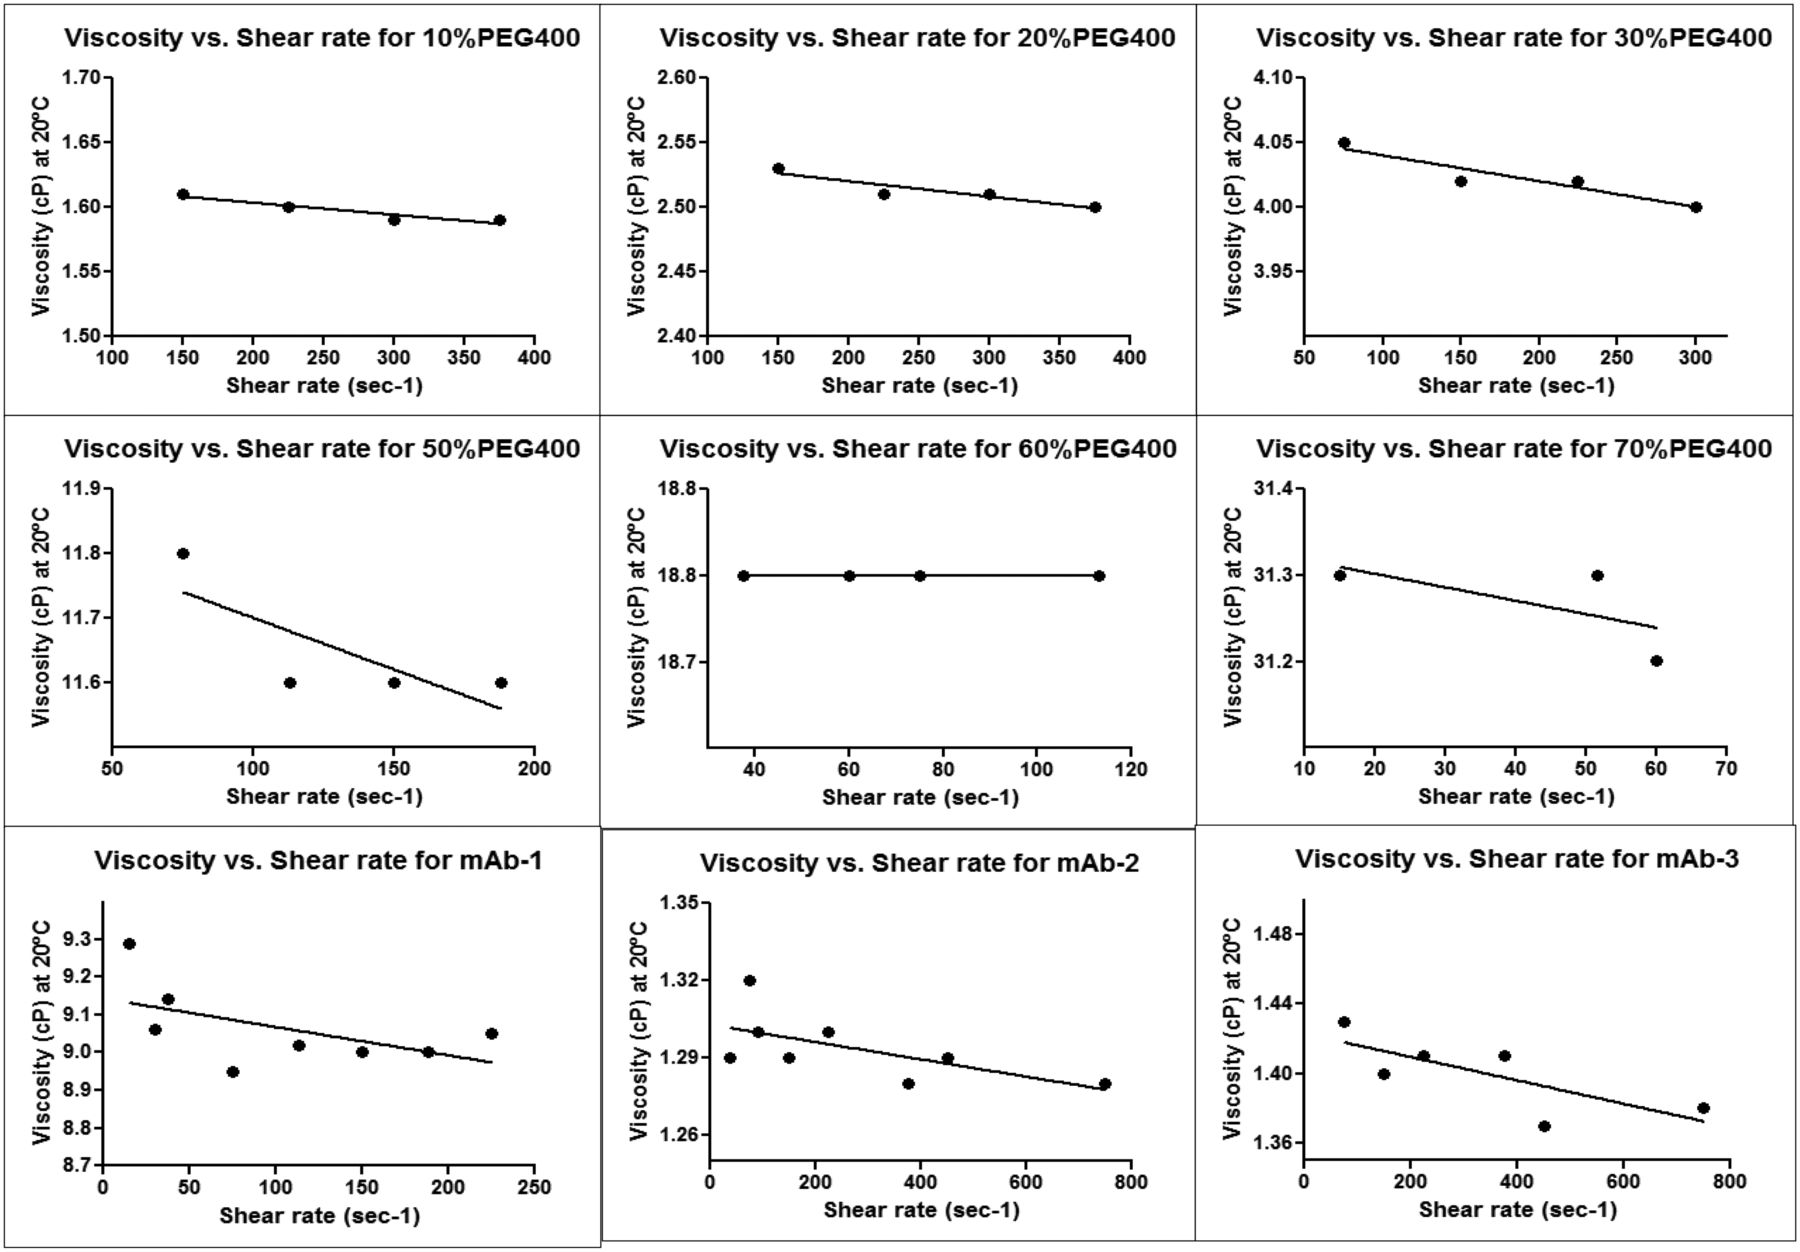
Aqueous solutions of PEG 400 ranging from 10% (wt/vol) to 70% (wt/vol) were characterized for their viscosity and density. Figure 3A shows exponential increase in viscosity of PEG 400 as concentration is increased from 10% to 70%. This type of exponential increase in viscosity has also been observed for protein formulation and polymeric solutions when the viscosity increases exponentially with concentration (21, 24, 25). All PEG 400 solutions tested in this study showed non-Newtonian flow behavior exhibiting shear-thinning characteristics with increasing shear rate (Supplemental Figure 1). The viscosity values reported were measured at a defined shear rate described in the Methods section. The density showed a linear increase as a function of PEG 400 concentration (Figure 3B). This is an expected phenomenon because the density varies in a linear manner with mass fraction of PEG 400 in water (26).

Characterization of (A) viscosity and (B) density of PEG 400 solution as a function of concentration mimicking the physical parameters of a parenteral drug product.
For drug delivery purposes, USP general chapter <1> requires that each container of injectable product is filled with a volume that slightly exceeds the content indicated on the label, which should be sufficient to permit withdrawal and administration of labeled volume (14). Therefore, the label claim for a drug product is the minimum quantity of contents, and the excess volume in a container should be justified but not declared on the container label as per FDA guidance (15). The regulatory agency understands that dosing flexibility is necessary with injectable drug products; therefore, applicants should determine appropriate vial and PFS fill sizes, considering how they will be used for drug delivery purposes. For example, single-dose vials and PFSs are designed for use in a single patient as a single injection/infusion. However, if these single-dose containers contain more drug than is required for a single dose, then it may result in misuse and wastage of drug product. On the other hand, if these single-dose containers contain less volume of drug than is required for single dose, then it can lead to delivery of a less than efficacious dose. In general, inaccuracies in doses during drug delivery can have an impact on pharmacokinetic and pharmacodynamic properties of the drug. Therefore, the FDA recommends providing justification by obtaining extractable dose data for each manufactured lot using appropriate sampling and methods (15).
The method applied for testing of extractable volume must comply with USP <697> Container Content for Injections when contents are measured gravimetrically (27). The content that cannot be extracted from vials, single-use syringe/needles, and PFSs is called HUV and is determined for different types of drug product configuration that includes CCSs and drug solution properties during drug development. A significant amount of drug product (grams) is required for experimental determination of HUV and setting of fill volume and label claim specifications. Although the amount of product available during development is often limited, predictive confidence models that provide a platform approach for setting fill volume specifications would be valuable. The objective of our study was to come up with a regression model for determination of HUV across several types of vial and single-use syringe/needle systems and PFSs that could subsequently be used for setting label claim.
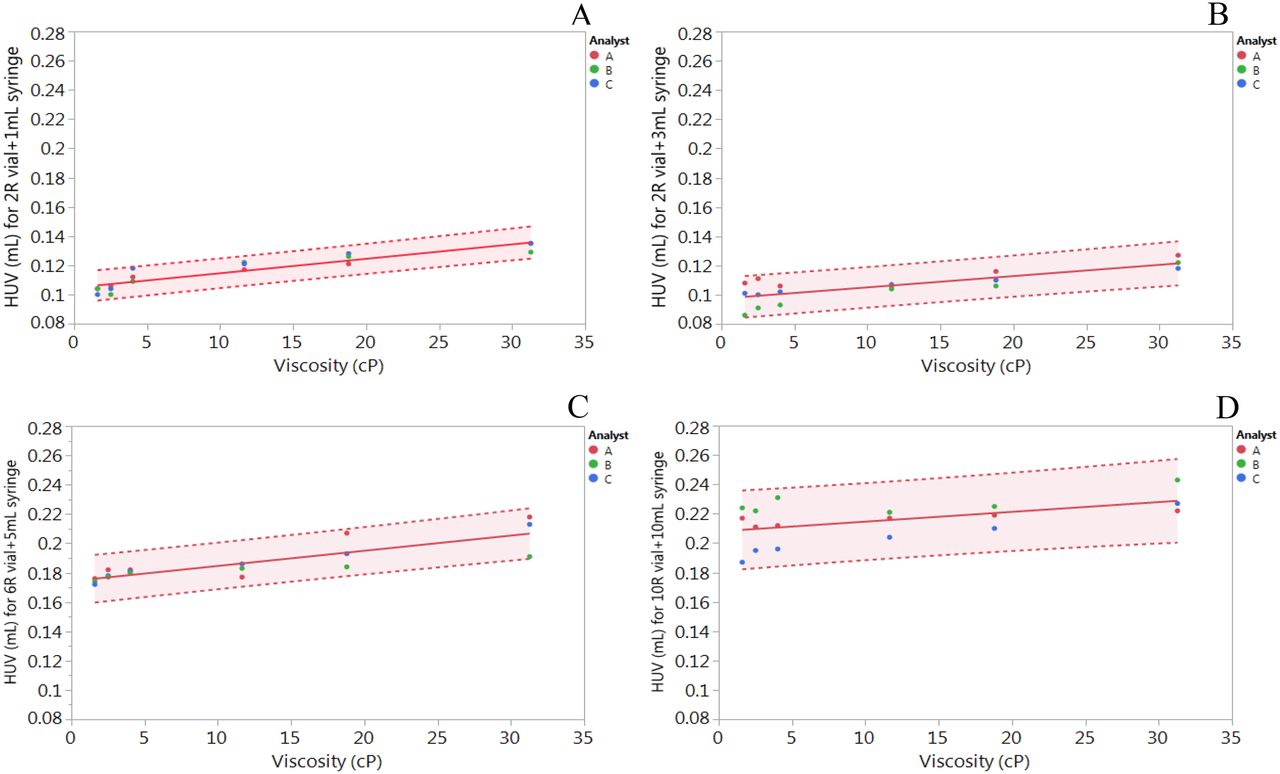
The cumulative HUV determined for a 2R vial and a 1 mL single-use syringe, a 2R vial and a 3 mL single-use syringe, a 6R vial and a 5 mL single-use syringe, and a 10R vial and a 10 mL single-use syringe as a function of viscosity is shown in Figure 4, A, B, C, and D, respectively. The analyst variability can be observed for each viscosity in which every data point is an average of n = 9, resulting in a range of HUV that can be determined with 95% confidence interval. When subjected to a regression model, a small linear increase in HUV was observed as a function of viscosity across all container closure and syringe types. This was contrary to our hypothesis where we expected to observe an exponential increase in HUV because of its dependence on solution viscosity for each CCS. In addition, the HUV is significantly dependent on the design and surface area of the vial and syringe/needle system, as the cumulative HUV increased with increase in the size of the vial from 2R to 10R. This increase can be visualized from the linear regression model derived from fitting the line (Table II).

HUV determined for (A) 2R ISO vial and 1 mL disposable syringe, (B) 2R ISO vial and 3 mL disposable syringe, (C) 6R ISO vial and 5 mL disposable syringe, and (D) 10R ISO vial and 10 mL disposable syringe. Each data point per analyst is an average of n = 9. Solid line represents linear regression fit, whereas dotted lines represent 95% confidence intervals.
Determination of HUV Based on Linear Regression Model for Vial and Disposable Syringe Configuration
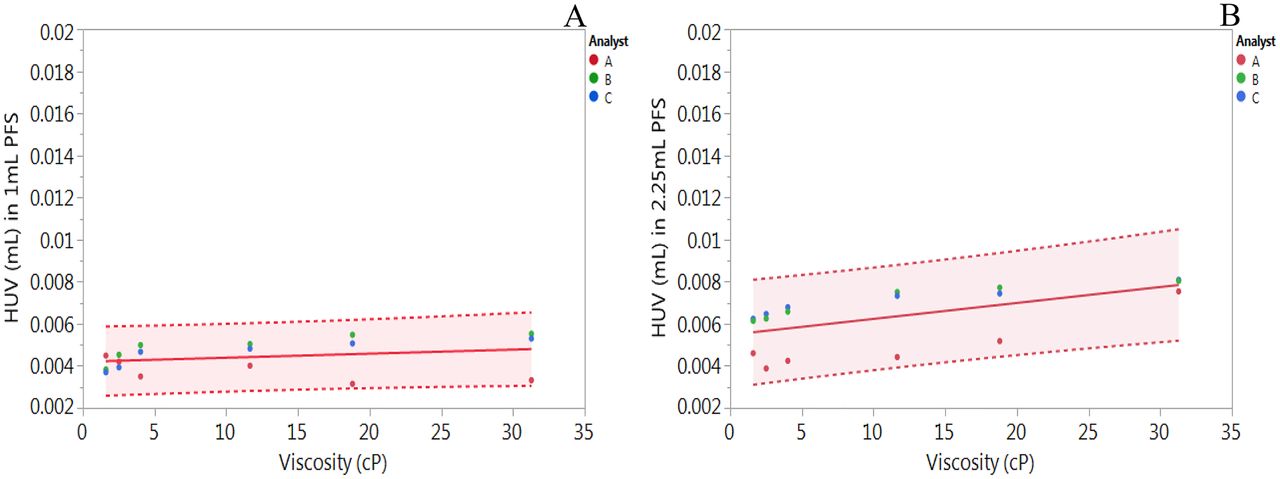
As expected, the HUV in PFS was very small compared with the cumulative HUV observed for the vial and disposable syringe/needle system. The trend in HUV as a function of solution viscosity was similar to the trend observed with the vial and disposable syringe/needle system (Figures 4 and 5). A slightly higher HUV was obtained for the 2.25 mL PFS as compared with the 1 mL PFS (Table III), but this may not be significant because the average HUV can be considered to be within the 95% confidence intervals (Figure 5).

HUV determined for (A) 1 mL PFS and (B) 2.25 mL PFS. Each data point per analyst is an average of n = 9. Solid line represents linear regression fit, whereas dotted lines represent 95% confidence intervals.
Determination of HUV on Linear Regression Model for PFS
To confirm the linear regression model for determination of HUV for mAb formulations, three different mAbs with a viscosity ranging from 1.3 cP to 9 cP were tested, and the experimentally determined HUV was within the 95% confidence intervals of the linear regression model (Table IV). All three mAb formulations demonstrated non-Newtonian flow behavior exhibiting shear-thinning characteristics as a function of shear rate (Supplemental Figure 1). In addition, the presence of 0.2 mg/mL PS80 in mAb-1 and mAb-3 formulations, which can lead to bubbling of solution during extraction, did not have a significant impact on HUV because the experimentally determined HUV was within the linear regression model developed using PEG 400 solution without any surfactant.
HUV Determined for Parenteral Drug Product
Type I glass vials are the preferred containers for parenteral drug products; however, extraction of drug from a vial into a single-use syringe/needle and injection can often lead to dosing errors (28). On the other hand, PFSs with their premeasured dosage have the potential to reduce dosing errors while increasing patient compliance (28). In general, the HUV for drug delivery using a vial and hypodermic syringe/needle system is higher, which results in increased waste of the drug product, but the PFS can reduce drug overfill requirements and therefore minimize waste of costly biopharmaceuticals (28). This observation is expected; therefore, PFSs are preferred over the vial and single-use syringe needle system (17, 29). Unlike single-dose vials, which may require overfill by as much as 20% to 30% for small deliverable volume (<5 mL) to ensure adequate withdrawal, a PFS can virtually eliminate the need for excess overfill, thus conserving the expensive biologic drug products while increasing the accuracy and reproducibility of a delivered dose (27, 28).
Conclusion
In our study, we were able to determine HUV as a function of solution viscosity for a vial and hypodermic syringe/needle system and a PFS. As the surface area of vial increased from an ISO 2R to 10R vial, the HUV increased. A slight increase in HUV was observed as a function of viscosity across all CCSs, which can be modeled by a linear regression model. The same trend was observed for PFSs as well; however, the HUV in PFSs was small compared with the cumulative HUV for the vial and hypodermic syringe/needle system. The model derived from this study can be used to estimate HUV for biologics to support determination of fill volume and label claim specifications. This model is beneficial for products in early stages of clinical development when material availability is limited and platform approaches are often desirable for design and product development.
Conflict of Interest Declaration
The authors declare that they have no competing interests.
Appendix

Rheological behavior of various PEG 400 solutions and mAb-1, mAb-2, and mAb-3 characterizing viscosity as a function of shear stress.
- © PDA, Inc. 2020


