
Abstract
Quality is defined by the American Society for Quality (ASQ) as “the totality of features and characteristics of a product or service that bears on its ability to satisfy given needs.” Therefore, quality is applicable to processes that supply outcomes with values that can be measured. Statistical control is an effective methodology that provides the outcome of quality of goods, bringing an added value that other methods, like quality by inspection, do not offer. The statistical methods applied to process control have been thoroughly developed, and the mathematics that supports them have been broadly demonstrated. Artificial Intelligence (AI) is a field in which mathematics, statistics, and programming play a joint role, and its results can also be applied to disciplines like quality control. Nevertheless, its utilization is subordinate to the qualification of the implemented algorithms. This research presents a standard procedure to AI algorithms, allowing their usage in regulated environments to ensure the quality of the delivered products or services (e.g., in drugs and medicines manufacturing). The regulated principles are defined by the concept of quality by design (QbD), which is a notion introduced in the pharmaceutical industry as a good practice for process management under multivariate analysis. This study intended to provide guidance for qualifying AI algorithms using QbD guidelines as the foundation for this purpose.
- Qualification
- Artificial intelligence
- Algorithms
- Quality by Design
- QbD
- Design of Space
- Pharmaceutical industry
- 4th Industrial Revolution
- Smart industry
- Pharma 4.0
- Quality
1. Introduction
There is an undeniable paradigm shift regarding the adoption of artificial intelligence (AI) by society because of the learning software wave that is invading a broad spectrum of activities, with a clear impact on citizens (1). From this social perspective, AI may be acknowledged as the fusion of science and engineering (2), allowing the ability to connect the economic, academic, industry and health spaces, as well as in other subsectors (e.g., retail, transportation, finances, logistics, or entertainment), providing immense value in terms of predictions, recommendations, classifications, and automatic recognition tasks (3). In fact, the technologies involved in continuous data generation and machine learning systems applied to the productivity chain are also affecting relationships among employees and with their jobs (4). All of these fields produce large amounts of information, and the complexity associated with the network of data sources makes it difficult to use traditional statistics around the reality represented by the continuous data flow (5). When data becomes the raw material for decision-making in the socioeconomic scene after the corresponding analytical transformations, the entire information workflow must be reliable if critical actions depend on it. The pharmaceutical industry perfectly fits with this business model, because it requires adapting the statistics applied so far to the complex and variable reality existing around drug manufacturing (6).
The 2009 International Conference on Harmonisation’s (ICH’s) second review (7) of the Pharmaceutical Development guideline—Q8—describes the basis to apply data science approaches in pharma manufacturing as the foundation for decision-making to leverage productivity and quality in production (8). ICH also published the Quality Risk Management guideline, Q9 (9), and the European Medicines Agency published its Q2 text for the validation of analytical procedures (10) The Quality by Design (QbD) concept, described in Q8, and process analytical technology (PAT) principles based on statistical methods were introduced and exhaustively described as an aim to transform the pharmaceutical processes into robust operations through knowledge acquisition (11). The same assumptions were used here to construct the artifacts to warrant the validity of data science algorithms. Different approaches in the literature aimed to prove the validity of certain algorithms applied for specific utilization. Cross-validation is an extended method commonly accepted to certify AI algorithms, requiring a contrast between the target algorithm and others utilized for similar purposes. By way of illustration, artificial neural networks (ANN) have been validated as good AI mechanisms in different fields making use of this technique. In some cases, the comparison of ANN against other classification options like Bayesian networks in very specific contexts, such as bankruptcy prediction, worked well (12). In physics, by combining neural networks with Monte Carlo representations, scientists of particles check the validity of the artificial learning system for a determined set of collisions (13). The k-fold cross-validation method is a type of assessment that allows direct comparisons between the performance of learning algorithms in different experiments by means of the deterministic construction of folds. This method is performed using unsupervised stratification and is oriented to the algorithmic performance reducing potential bias introduced by the estimators (14). However, cross-validation is not an accepted method in pharmaceutical applications. Validations in the life sciences field are required to prove robustness with independent samples and later do consolidated studies with future data, establishing a continuous validation process that involves a specific life cycle to be maintained (10).
Although cross-validation techniques among algorithms is an accepted and extended way to verify learning programs (15), it is still not a systematic praxis for novel algorithms in disciplines such as bioinformatics (16). The uncertainty related to some AI methods derived from their intrinsic structure (e.g., random forest) also makes deterministic governance difficult. From a consistent and organized perspective, arbitrary results add complexity to the standardization efforts for learning systems (17).
Data are a required ingredient to estimate an AI algorithm’s validity. Data science software can be architected for specific targets or developed under a conceptual design. For instance, an anomaly detection functionality could be specifically fine-tuned for predictive maintenance tasks in a particular equipment, whereas other expert systems implemented for the same anomaly identification goal could not cover other aspects, such as deviations introduced by electrical issues introduced into the equipment (18). Data work as part of the verification engine that helps to determine the algorithm validity and operates as the input of the test sequence phase in the qualification. AI can be assumed as a computation model transitioning along different steps that can only work in a finite number of states at any step. This definition of an abstract machine is known as finite-state machine (19). This assumption supposes that pieces of software designed as finite-state machines can follow a test strategy based on three characteristics (20):
Only the designed mechanism of control is checked.
No specifications for the execution are required.
The verification of sequences must ensure that errors produced in the control mechanisms are noticed.
Under this verification schema, data play a fundamental role, operating as the glue between the different states through which the expert programs run. Notice that under the assumptions defined by Chow, no prescriptions about the models and final purpose are needed, because the model’s checked results are independent of the final intended applications.
Data becomes a critical element in the test strategy, and its validity is part of the qualification process (21). As related to life sciences good practices context (also known as GxP), data are also crucial to confer the required robustness for decision-making (22). This research was constructed under the premise that raw data used to test AI software must be managed with the same level of exigency as that which is applied in pharmaceutical environments. Applying verification and validation life sciences good practices to data science mechanisms can lead to robust models and solid procedures (23). Variability, complexity, and large data sets are attributes that data scientists must be able to tackle before running their models through AI algorithms (24).
The quality of the data affected by the variability and complexity includes such aspects as:
consistent metadata for unstructured data,
attributable and legible sources (proprietary binary formats are not good configurations),
associated universal timestamps (indispensable for time-series),
avoidance of manipulations introducing non-expected bias, and
accurate data.
These principles are known in pharmaceutical environments as ALCOA—Attributable, Legible, Contemporaneous, Original, and Accurate (25, 26). On the other hand, the data size is a characteristic that must be checked for the specific domain for which the algorithm is intended (e.g., avoiding overfitting effects). Selected technology for data storage and consumption also has a relevant impact on this attribute.
Besides the data quality, the pharmaceutical ecosystem has paid attention to the AI field from an algorithmic perspective as well. Some regulatory players have started to pull in this direction, describing and defining the right ways to implement intelligent software. A clear example is the inclusion of the support vector machine method and ANN in the European Pharmacopoeia as valid chemometric techniques for processing analytical data sets in Chapter 5.21, which is dedicated to chemometric methods applied to analytical data (27). Ultimately, AI is software, and a wide set of known strategies to verify and validate it have been developed. Additionally, there are specific use cases when the AI is highly complex and presents nondeterministic behaviors for adaptive designs (28). However, when the software is used to make critical decisions, which happens in drug or medical devices manufacturing and in health care in general, the validity of the algorithms require special considerations. These are currently underway at the time that this document is being written. The U.S. Food and Drug Administration published a discussion paper to request feedback in regard to artificial intelligence and machine learning usage for medical devices (29). Europe is in a similar situation as the USA. The European Medicines Agency (EMA) created a special task force to gather opinions from the main pharmaceutical stakeholders regarding these specific technologies and related tools with big data (including AI) (30).
In conclusion, a standard procedure to ensure the right algorithm governance to properly cover the casuistry that this document aims to deal with does not exist. In fact, there is not a single solution that could establish a good fit, although a combination of different options could work for specific types of algorithm governance (17). Therefore, the purpose of this study was to define a set of guidelines to qualify AI algorithms, which will be done using QbD principles.
2. Background
The quality management of medicinal products should maintain high standards of quality in the research, development, manufacture, and control of medicines.
Authorities ensure the compliance of the product workflow with contemporary requirements of safety, quality, and efficacy (SQE), promoting continuous monitoring and improvement across the entire medicine life cycle. Safety is defined as a combination of many different aspects of science that help answer why a particular drug causes a side-effect or adverse drug reaction (ADR) in a particular patient. The adverse drug effects can be classified in different levels such as death, disability, or discomfort. The quality of medicines is understood as the suitability of either a drug substance or a drug product for its intended use. Drug quality includes attributes such as identity, strength, or purity. Finally, the efficacy is the capacity to produce the pharmacological effect for which that medicine has been intended. To protect public health via the SQE principles, governments need to approve comprehensive regulations and establish effective national regulatory authorities to ensure the entire life cycle of each medicine (from research to use by patients). There are different ways to efficiently approach this control, mainly based on laws (usually requiring a long process to be implemented), regulations (which can be deployed faster than laws), and guidelines (although not required, their application facilitates compliance with laws and regulations). Although, in general, the laws and regulations are more focused on the process control, the guidelines point to the knowledge that supports the product and process life cycle (31). Furthermore, guidelines provide tools to facilitate implementation of all concepts that lead to the specific learnings in the guidance. The three-axes of SQE are requirements that must be guaranteed through the right procedures defined by laws, regulations, and guidelines.
The statistical methods based on multivariate analysis (MVA) used during drug manufacturing provide critical information for decision-making. MVA is used, for instance, to optimize the dry granulation phase in tablet manufacturing (32) or for the identification of critical factors in granules particle size distribution within a fluid bed dryer (33). Nowadays, advanced analytics must be considered as tools linked to any process to acquire knowledge. Assuming that mathematics is being used as an instrument in manufacturing operations, they must be managed in the same way that equipment is. Therefore, the validity of the elements, procedures, and phases involved across the full drug manufacturing must follow the same criteria for validity, independently of their nature.
AI is an engineering discipline of computer science designed to create smart software to think in human-like ways, capable of producing models of aspects related to human cognition (34). The algorithms providing deterministic predictions, recommendations, or classifications work as multivariable methods in which mathematics and programming operate together. AI can be considered a set of mechanisms that bring similar outcomes as the classic advanced analytics methods do, but involving more resources and providing different results. Although AI is a relatively old field (AI was officially born during the Dartmouth Conference in 1956) (35), the current confluence of unlimited space and computation offers the possibility of accessing algorithm technology through competitive resources. AI has been widely introduced by the 4th Industrial Revolution as part of the digital transformation that is changing the way the world thinks and works (36). The democratization of AI allows its utilization in different fields, although this discipline presents some limitations that must be known in order to ensure its correct deployment. The needed volume of data to generate accurate AI models or the required transcription from paper records to electronic data are examples of these limitations (37). From a verification perspective, some algorithms work in a nondeterministic way, making the testing tasks associated with verification difficult (28). AI is a valuable resource that is being adopted by the pharmaceutical industry in a limited mode, as only research and clinical trial processes are publishing modest results (38). A new trend of AI adoption is being experimented at the core of bio-pharma. Two AI algorithms (Neural Networks and Support Vector Machines) have been promoted by the European Pharmacopoeia (27) as valid chemometric methods applied to analytical data. This publication is an inflection point in the usage of AI for critical processes in pharmaceutical environments that is reinforced by several initiatives promoted by the FDA. The FDA’s Emerging Technology Team recognizes that adopting innovative approaches to manufacturing may present both technical and regulatory challenges. The previous reference to the FDA’s discussion paper requesting feedback on the use AI and ML as software as a medical device (29) is a clear example of this reality.
Before AI and new technology initiatives were promoted by the FDA, Q2, Q8, and Q9 were published. These guidelines were created with the specific goal of improving public health protection in relation to medicine consumption. Specifically, Q8 and Q9 are meant to shift the workflow away from an assumption of process invariability—one of the main hypotheses applied in the design, implementation, and control of pharmaceutical manufacturing since the early ages of this industry (6)—and toward addressing the inevitability of process variability. Based on this principle, two concepts were introduced by Q8 (oriented to implement knowledge across the pharmaceutical operations): QbD and design space (DS). The methodology described in ICH Q2 is related to the validation of analytical procedures and defines the figures of merit associated with analytical models. Depending on the type of algorithm (classification or regression are examples of AI algorithms), the figures of merit introduced by this guideline lead to different types of analytical procedures. Typical validation characteristics that should be considered are accuracy, precision, repeatability, intermediate precision, sensitivity, specificity, detection limit, quantitation limit, and linearity range. The outlier detection algorithm, used in this study as an example for qualifying any type of AI algorithm, can fit into the identification section; therefore, specificity and sensitivity are the main parameters that should be evaluated. In the guideline, specificity and sensitivity are described as the ability to assess unequivocally the analyte in the presence of expected components. In this document, sensitivity and precision are the scores designated to measure the ability of the algorithm to assess unequivocally the value of the process.
The QbD is defined as a procedural understanding of medicine development, defining the known and expected targets and highlighting the product operations expertise and process control, based on science and quality risk management principles as defined in Q8 and Q9. On the other hand, the DS is explained as the multidimensional interrelation and interaction of input variables (e.g., material attributes or equipment setup) and process parameters that have been proved to provide the expected quality (e.g., climate conditions or human interaction). The innovativeness given by this context is based on the concept that no alterations are considered working under the flexible space defined by the multivariable network. Therefore, displacements inside the DS are allowed, whereas movements outside of the space are considered out of specifications. To facilitate the control of variables during the manufacturing phases, PAT was devised in order to analyze and check the set of parameters declared in the DS. The system design based on the PAT principles aims to keep the process under statistical control to ensure the final product quality along the different manufacturing operations.
In this context, multivariable analysis is a cornerstone in the landscape drawn by the Q8 guidelines. The statistical tools become an essential mechanism involved in the most critical activities related to the batch release, and they are required along the full drug life cycle. Principal component analysis (PCA) and partial least squares (PLS) regression are two examples of statistical techniques broadly extended in the QbD and PAT field (39). However, the computational power and the massive storage systems developed nowadays allow the use of another kind of multivariable instrument: AI. There are many different definitions for AI, usually related to the learning ability of algorithms. However, beyond this traditional meaning, AI can be defined as the capability to interpret a portion of reality by means of a set of algorithms, variables, and values, in order to predict, classify, recognize, or recommend attributes of this observed space. This perspective for understanding the relationship between the factors that compose a multidimensional ecosystem leads to a multivariable context with extended benefits. The DS conceived as the most appropriate set of algorithms that are able to reproduce a given physical-chemical phenomenon becomes a very innovative mechanism to implement QbD. However, this article does not aim to cover the specifications for the AI implementation in PAT contexts. As stated previously, the purpose of this study was to define a set of guidelines to qualify AI algorithms using the QbD principles.
ICH Q9 proposes a systematic risk management approach to apply in drug manufacturing and the use of medicinal products. The guideline is focused in the specific development of techniques designed to assess the risk associated with quality variances both in the product and the process. Risk management has been shown beyond doubt as an effective tool for quality governance in many areas of business and government (9). The pharmaceutical industry also recognizes the importance of risk management, including it as a key driver. The Q9 guideline advocates for methods that help to gain knowledge about the assessed process. Procedures like the failure modes and effects analysis (FMEA) (40) consolidate a systematic action to identify potential failure modes, their causes, and effects on system performance. This approach also indicates a set of statistical tools to support risk management, one of which is design of experiments (DoE), which will be extensively applied in this article.
3. Research Objectives
This study was defined following a design and creation research strategy, in which the final goal was to provide an artifact to qualify algorithms developed under the AI paradigm. The qualification concept is associated with systems, facilities, or equipment (can be considered as things under an abstract perspective) and must be understood as a process to ensure that these things are achieving the expected acceptance criteria defined in the quality attributes and parameters that have been previously identified. In a regulatory context, the United States Pharmacopeia defines and differentiates qualification and validation as follows (41):
Qualification: The status of quality assurance for systems, facilities, or equipment supported by documented evidence that proves the right use of them.
Validation: The documented evidence to ensure that a specific system, process, or facility is consistently generating an output with predefined quality attributes and specifications.
In summary, validation acts over processes and procedures whereas qualification affects assets. Usually, the validation of a system or equipment implies its previous qualification. Following this reasoning, the AI application will be studied in this article under the qualification perspective, proposing a set of standard procedures to establish the acceptance criteria of its implementation based on a set of expected conditions. The conceptualization of the algorithm execution developed in this analysis supports the capability of an abstract design to cover the different AI casuistry. The same proposal would not be feasible for a validation orientation because it would require the analysis of a specific output for a particular use case. Consequently, the generalization would not be possible.
AI was originally defined as the science and engineering to make intelligent machines, especially intelligent computer programs (42). AI can be implemented by means of different approaches, including models based on statistical data analysis, expert systems based on conditional statements, and machine learning. The scope of this research aimed to describe a standard methodology to qualify the AI algorithm usage, considering the main elements that characterize its anatomy:
The logic implemented through the source code (henceforth logic).
The variables that provide the input and output values (predictors and predicted factors).
The data set used during the qualification process.
The final model or outcome generated by the execution of the algorithm.
The figures of merit associated with the model.
The five previous components are studied through the axis of the qualification perspective managed by Q2, Q8, and Q9, grounding the regulated thread that leads the entire research and providing the framework as described in the introduction. The recommendations given by the guidelines will be developed to be applied in the algorithmic context. The artifact proposed in this article is intended to support the acceptance criteria that could be established in the results produced by AI models requiring regulatory exigencies. Therefore, the same guidelines recommended by the ICH to ensure the quality in a drug’s life cycle as a consequence of the greater understanding of pharmaceutical and manufacturing sciences will be adapted to the workflow covered by the above listed components.
Using QbD allows characterization of the algorithm and identification of which designed space areas built in the synthetic data sets perform better, possibly leading to a better selection of the training data set for the process problem. The qualification ensures that the algorithm works as expected, consolidating the defined DoE as the evidence for the final model created through the qualified algorithm. The model must always be validated for the final usage for which it is intended. On the other hand, the algorithm has been qualified and presumes a ready-to-use state, making the validation process easier.
4. Research Methodology
Considering that AI algorithms are mechanisms designed to create multivariable models that could potentially lead to complex parameter interrelations, QbD is a good strategy to obtain comprehension of AI systems by means of qualitative and quantitative procedures. Both procedures are based on the following measures:
Qualitative procedures are supported by measurements of representativity (based on the data set used for training and verification), specificity (calculated through the quotient between true negatives and the sum of false positives plus true negatives), and robustness (checking the model along time and ensuring its performance in new samples).
Quantitative procedures integrate the three measures introduced by the qualitative procedures, including algorithm accuracy, precision (based on repeatability as short-term precision and intermediate precision for medium term precision), detection limit (LOD), quantitation limit (LOQ), linearity, and range.
There are a set of minimum requirements to which drug development must commit. The SQE parameters and the critical quality attributes (CQA) of the target drug product must be defined, studied, and controlled. The CQA of the raw materials and bulk also must be identified and kept in check. Furthermore, processes must be chosen and configured accordingly to continuously ensure the acceptance levels defining the right control strategy. The established conditions (ECs) introduced by the Q12 (43) are intended to provide the mandatory elements to assure product quality and identify the foundations that require a regulatory submission. In this way, the ECs bring a wide understanding of the product life cycle management and the set of processes involved in production. The control of all factors involved in the SQE attributes requires a multivariate plan that QbD incorporates by means of designing experiments, applying quality risk management, and establishing mechanisms to increase the knowledge of the development and manufacturing processes.
AI systems designed to interpret multivariable scenarios subject to SQE requirements as medical devices or pharmaceutical products need to be trained with high quality data. Data used to create models for SQE purposes must be prepared, including a sufficient variety of use cases to cover process experts, regulators, and patient expectations. On the other hand, the delivery of results simulating human rationality can only meet SQE requirements if AI models are trained using high quality data, including positive paths, worst cases, bias, and induced errors, as well. If data do not properly cover all the potential scenarios, the training process will generate an incomplete AI model that will not be able to provide the expected accuracy. Conversely, when data contain all the potential situations, the model will present robust outputs. Keeping in mind that there are AI algorithms with a random component in their intrinsic anatomy, identical input data sets might not provide the same outputs. This effect is not an indicator of a wrong output. The acceptance procedure must cover adequate tolerances of outputs, based on the quality of the input data and the incorporation of all expected use cases (44).
The same strategy provided by the DoE as described in the QbD principles can be applied to real datasets containing different sources of variability or using synthetic datasets containing several variables with different controlled features that are the object of study. These can include correlated variables, various standard deviations, orders of magnitude, etc. As a proof of concept, the experimental part of this article shows a real example in which this strategy has been applied to detect defects in a functioning motor using an AI algorithm for outlier detection. The experiments carried out have been defined using a DoE to cover all operational conditions. The optimal conditions, which correspond to one vertex of the experimental design, have been used to train the model, whereas all the other experimental conditions, or vertices of the experimental design, have been used as test sets.
5. Experiment
The experimental phase is described by means of the following sections.
5.1. Apparatus
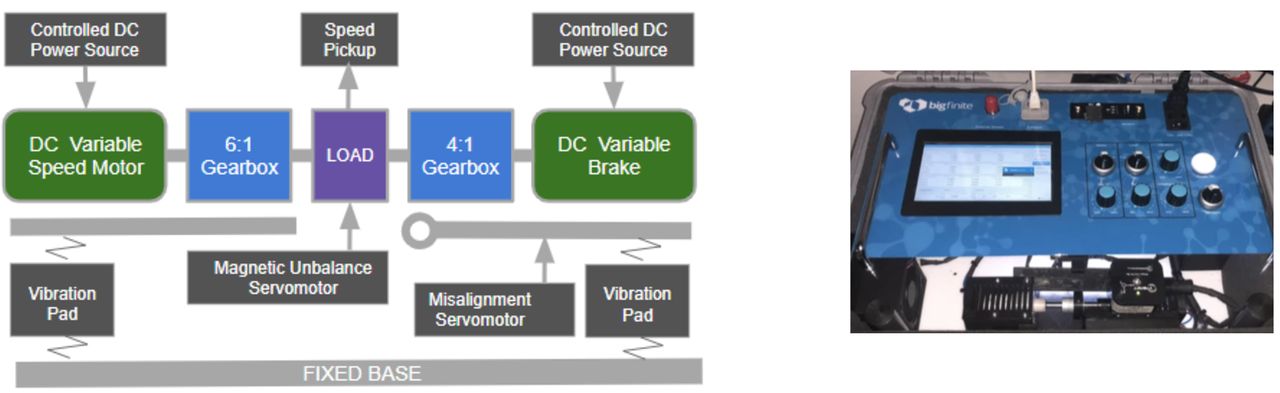
The data generated to develop the AI algorithm qualification described in this study has been created by means of equipment specifically designed for this purpose and has been called bigBox (Figure 1). The equipment consists of a motor connected to a gearbox that generates a rotation to an axis made of steel. A brake motor allows it to slow down the rotation, thereby inducing electrical power. The speed of the rotation can be manually and gradually braked and can be horizontally misaligned as well. The equipment is fed by a controlled DC power source that can be manually adjusted. The engine has been designed to measure vibrations occurring in the rotational axis in three dimensions: rotation axis, horizontal axis, and vertical axis. The three vibration measures were acquired by a VTB 3-Axis vibration sensor and were induced by a mechanical imbalance in the axis. This sensor was supplied by MachineSaver and the frequency response works in the range of 0.4 Hz to 5 KHz, generating vibration outputs in acceleration, velocity, and displacement. The sensor consisted of an automatic calibration verification instrument. There were four parameters that could be manually regulated by their respective switches, inducing physical variations on the system behavior. The provoked effects were reflected in the generated data set produced by the vibration sensor. The variables associated with each available switch were identified as follows:

The bigBox schema and picture. On the left side appears the schema of the main electrical elements that compose the engine used to produce real data for the AI algorithm qualification. On the right side, a picture of the equipment called bigBox used to generate the data set is shown.
MS Main: Variable used to measure the supplied voltage relative to the nominal electricity applied to the drive motor in the range 0%–100%. This input variable has a direct effect on the rotation speed.
MS Brake: Measured the supplied voltage relative to the nominal electricity applied to the brake motor in the range 0%–100%. This variable impacts on the torque applied to the brake motor.
MS Misalignment: Measured the misalignment applied to the steel axis, considering the initial value as 0 when the axis was properly centered in the radial direction and in the vertical axis (aligned by gravity and mechanically aligned). Although the possible values of this measure are distributed in the range of 0%–100%, only the extremes were considered because the gear dedicated to this effect had a Boolean behavior (is misaligned or not).
MS Imbalance: Measured the imbalance applied to the steel axis, considering the initial value as 0 when the axis is properly centered in the radial direction and in the horizontal axis as well (mechanically aligned). Values of this measure were distributed in the range of 0%–100%. The imbalance was directly related to vibration response given by the engine.
The equipment was specifically designed to produce data sets generated by the interaction with the physical engine. The vibration sensor provided a set of measures acquired from the induced displacement, speed, and acceleration by the steel axis in the three dimensions. Each dimension was associated with an internal channel, where channel 1 was characterized by the axial vibration, channel 2 was collecting data from the vertical direction (aligned with gravity), and the channel 3 was managing the horizontal vibrations (Figure 2). The following measures were provided by the bigBox, having one value for each channel that was indicated by the character X in the interfix ChX. Another convention in the nomenclature was established when the Rms suffix appears in the name of the variable. Rms was assumed as the root mean square of the indicated measure and it is calculated in this way:

The bigBox mechanics. Details of the mechanics that establish the three axes that define the channels identified by the interfix ChX.
Where N is the number of samples and x(i) is the vector of samples in a specific time domain. Taking into account this convention, the following variables were available for each channel:
MS ChX AccRms: Root mean square value of the vibration acceleration in the axis defined by the channel ChX, measured in [m/s2], integrated over the sampled time.
MS ChX AccPK: Peak amplitude value of the acceleration waveform in the axis identified by the channel ChX. It is the maximum instantaneous value measured in m/s2 and observed during the integration time.
MS ChX AccCrestFactor: Dimensionless number used to obtain the crest factor of the vibration acceleration in the specific channel. Its value is calculated applying this expression:

MS ChX AccMaxFreq: The motor rotational frequency, measured in Hertz [Hz]. This value is used to normalize the Fast Fourier Transform (FFT) of the acceleration and velocity vibration waveform to the frequency order.
MS ChX VelRms: Root mean square value of vibration velocity in the axis defined by the channel ChX, measured in [m/s], integrated over the integration time.
MS ChX_VelFFT i: An array of 16 elements holding the FFT of vibration velocity signal grouped by the order and normalized against the rotational frequency. The suffix i is an index that indicates each of the 16 bins

5.2. Physical Meaning
Noise and vibration signals are useful measures for diagnosis of equipment managed by engines. The nature of the signal (transient, periodic, or random), the maximum levels of noise and vibration, the peak level, the RMS level, and the crest factor (calculated by the ratio of the peak level to the RMS level) provide valuable information to determine the status of mechanical systems. Measuring the crest factor of noise and vibration provides the impulsiveness of the signals being usually applied for detecting impulsive vibrations caused by damaged bearings. Therefore, healthy bearings produce vibration crest factors in the range [2.5, 3.5] whereas damaged bearings generate values >3.5 for this magnitude. For instance, a very damaged bearing would show values of crest factor of about 3, whereas the RMS values would be very high. A crest factor >7 could lead to a failure. Although that is not a deciding factor, it is a good indicator (45). In terms of the available interfaces provided by the bigBox that can be managed for experimental purposes, the switches installed in the system reacted at the physical level in three main tiers (see Figures 3 and 4):

Unbalance in Ch1. Static and dynamic unbalance produces different phase patterns between Ch2 and Ch3, but they cannot be analyzed because the bigBox does not report on the vibration phase. However, the unbalance is detected in Ch1.

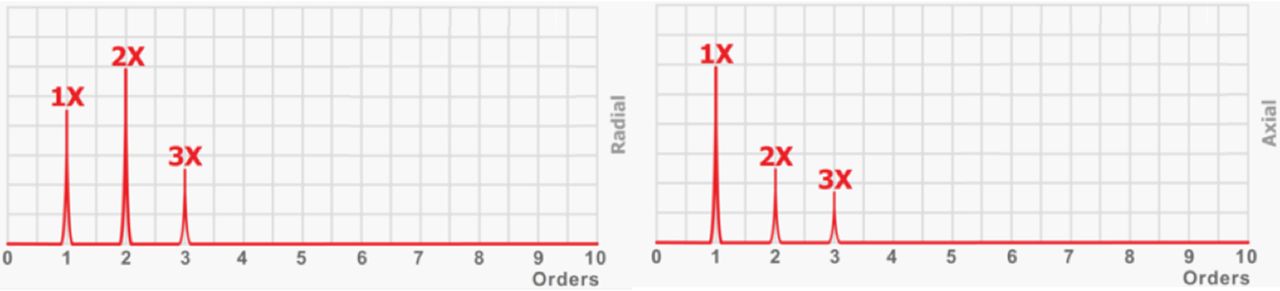
Parallel misalignment and angular misalignment. Misalignment in the bigBox is a mix of both angular and parallel axes, because of the design of the misalignment mechanism. When a parallel misalignment is introduced to the system, the produced vibration is shown mainly in the radial axis. On the other hand, when an angular misalignment is forced, the vibration is produced mainly in the axial direction.
Brake: As long as MS Brake increases at a fixed MS Main, the MS Current will increase and the MS Speed will decrease until the motor mechanically stops. If some MS Misalignment or MS Imbalance is applied (value >0), the MS ChX AccRms will show a maximum when rotational velocity crosses the resonant frequency of the system, related to the system mass and springs tension of the base plate.
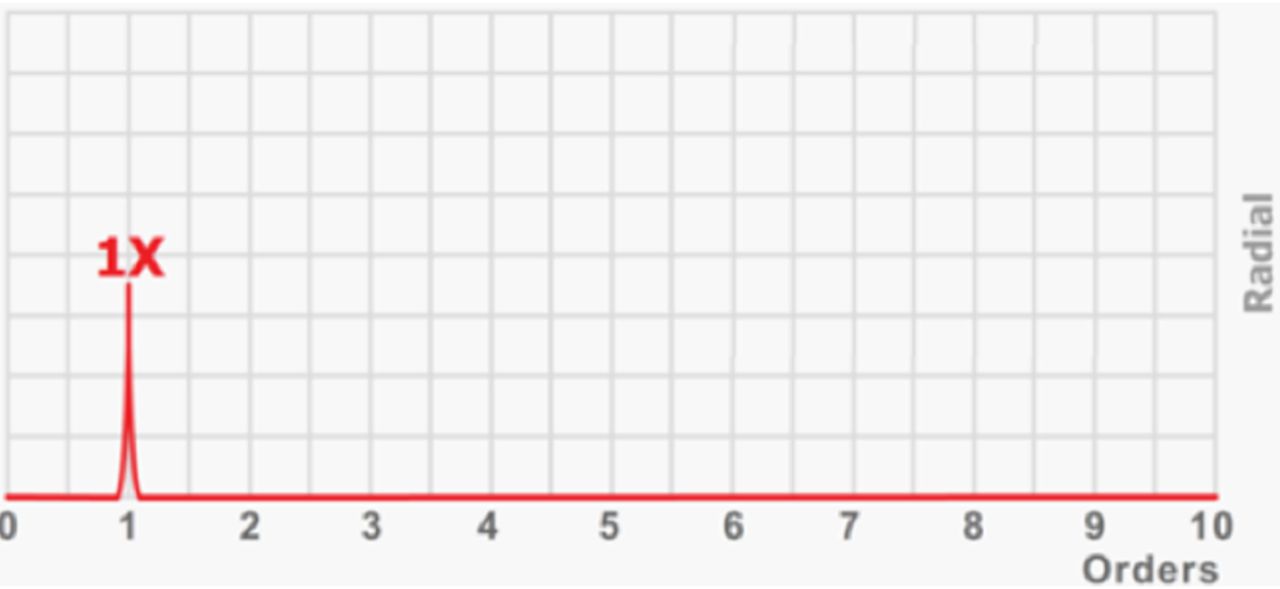
Imbalance: As long as MS Imbalance increases, MS Ch2 AccRms and/or MS Ch3 AccRms will also take increased values, whereas MS Ch1 AccRms should remain low. Thus, an induced imbalance should increase primarily the radial effects. This may suggest that the static imbalance effect is more pronounced than the coupling imbalance effect. Also, most of the vibrations’ energy will be concentrated in the FFT of first order (Order 1), that is in the same frequency as the rotational frequency of the main load (where the speed increase is located).
Misalignment: As long as MS Misalignment appears, MS ChX AccRms values increase as well, with ChX being the three channels described above. The energy contained in FFT Order 2 and Order 3 give a good estimation of the misalignment defect.
Other effects: The energy contained in FFT Orders >3 is related to the gearbox’s lubrication and/or defects. They can be understood as energies contained in 4X and 6X, and, with smaller amplitudes in 8X and 12X.
The other infrastructure used in the experimental process was the cloud platform, Bigfinite. This component permits the use of Internet of Things (IoT) technology to connect the sensors installed in the bigBox to send the raw data in a compliant manner to the cloud data storage provided by Bigfinite. The regulated characteristics of this GxP compliant data lake and the ability to run AI algorithms in the same platform were necessary in order to manage the experiments efficiently.
5.3. Data Collection
All data was collected using the bigBox device, which allowed interaction between the laboratory users and the engine to modify the latter’s behavior. While the motor was running, users could modify its behavior to reproduce common failures and simulate wrong actions experienced in real-world machines. The sensors acquiring data in the equipment were connected to the Bigfinite platform, sending real-time data with a time rate of 5 seconds. An experimental plan was created using an experimental design that covered all the operational ranges of the bigBox. Specifically, three levels (low, intermediate, and high) were taken into account for each factor that could be modified by a user.
The DoE applied to this experiment was designed with four factors at three levels with the aim of screening. This composition was intended to detect first order interactions without curvature, minimizing the number of experiments with criterion based on the D-Optimum of the design matrix (X’X). This DoE was selected because it allowed investigation of the effect of all factors and first order interactions without having to run an extensive number of experiments. In total, 29 different experiments were defined; several replicas were executed for each experiment, adding up to a total of 128 runs. For the purpose of the investigation, the motor was run for 3 days to accomplish a strict set of experiments consisting of a representative collection of different running modes. The space of experiments was designed to create 128 tests, representing the different combinations of states provided by the available parameterization. The algorithm performance was tested using each individual data set, computing its corresponding score and obtaining the associated performance result. Three bins of records were created setting up the power electricity (MS Main factor), and the rest of the input parameters as well (brake and vibration), except for the misalignment that adopts a Boolean behavior (ON or OFF). Therefore, the three intervals were defined, taking into account that the magnitudes were measured in the same range [0%, 100%] and the possible combinations were reduced to three meaningful and representative ranges. The number of experiments was fairly distributed for each set of values as shown in Table I.
Distribution of Experiments by Value Ranges Organized in Three Intervals: I, II, and III
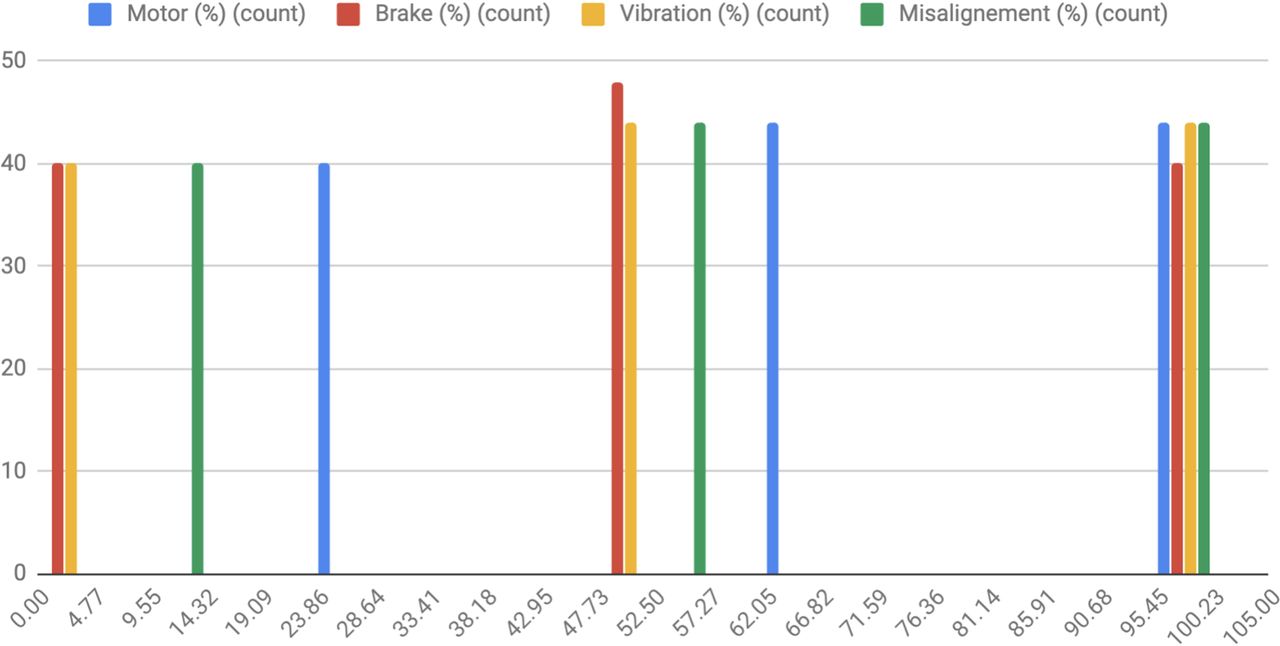
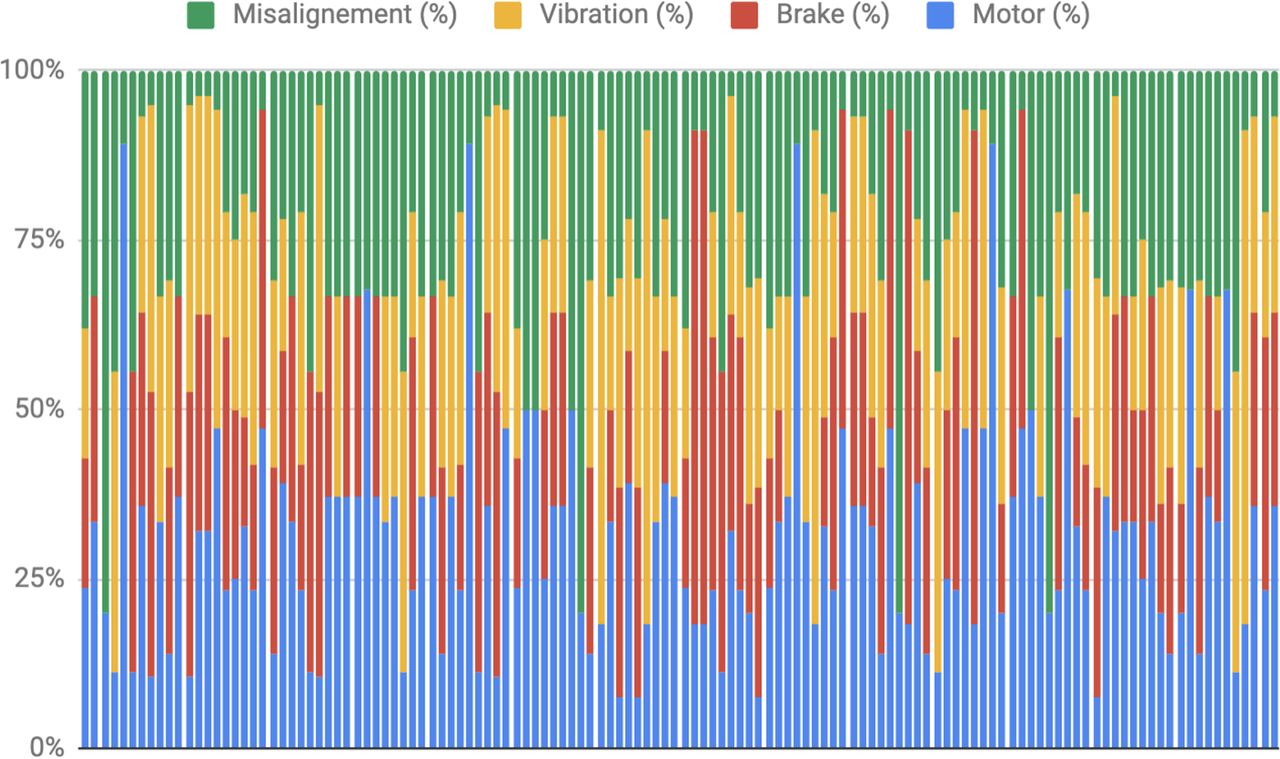
For each category defined by the configured supplied electrical power (MS Main), a subset of experiments was set up, adjusting different values for the available variables given by the vibration (MS Imbalance), brake (MS Brake), and the misalignment (MS Misalignment) signals. The DoE was designed, including outliers manually produced along different instances during each experiment, to include a broad spectra of use cases. The only data sets that intentionally did not contain outliers were those produced by the adjustment [MS Main = 25; MS Imbalance = 0; MS Brake = 0; MS Misalignment = 0] with three replicas used to train the algorithm and two to verify the model. The following graphics show, in an aggregated way, how the combination of factors were distributed creating 29 classes of experiments, with several replicas for each of them (Figures 5 and 6).

Experiments with replicas. Distribution of the number of experiments where each signal has been involved (Y-axis) classified by the setup value (X-axis), all of them belonging to the range [0%, 100%], along the three intervals described in Table I.

Design of Experiments (DoE) with the replicas. DoE with the 128 replicas (X-axis) corresponding to the 29 categories of experiments in which all the meaningful combination of values assigned to each signal (Y-axis) have been configured in order to cover a meaningful spectra of use cases.
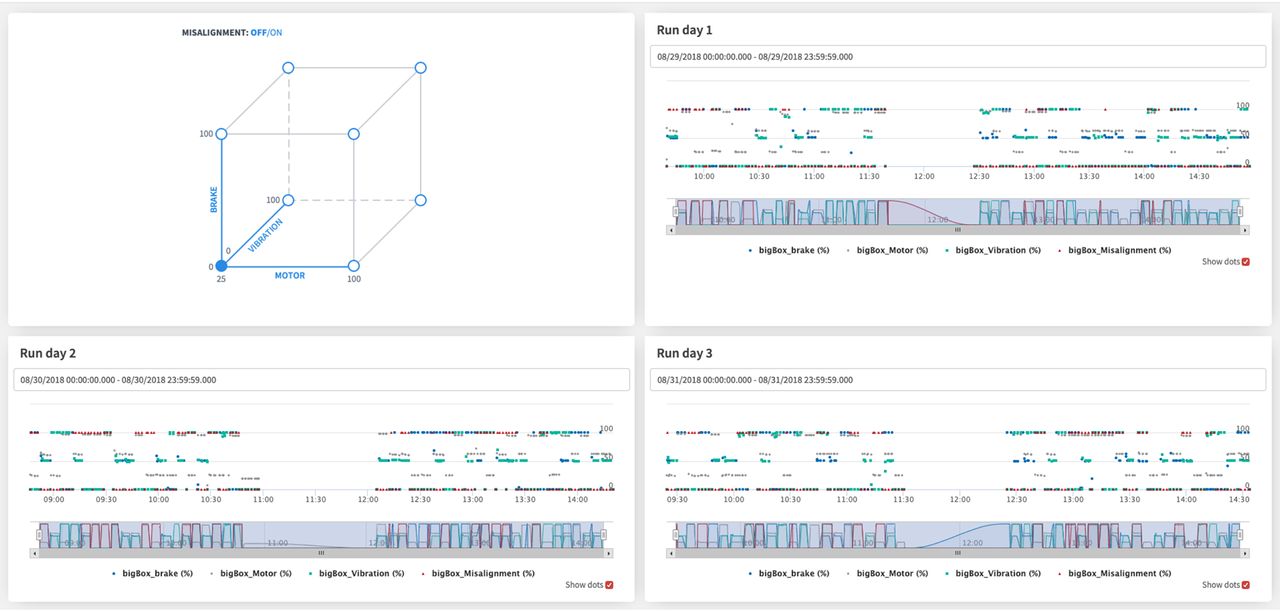
A visual explanation of the designed DoE is represented in the cube of Figure 7. The cube shows the experiments of the vertices, which are the main ones, nevertheless the DoE used also included some points between the vertices. In this case, the shown cube is plotted for misalignment = OFF but the same experiments were done taking into account misalignment = ON. The blue vertex shows the normal conditions, which were used for the training set (Figure 7).

Experiment conditions. Runs of the different days show the conditions for each experiment and also the randomness in the different runs and replicates. In order to also plot misalignment conditions, it has been considered that OFF is misalignment = 0 and ON is misalignment = 100.
5.4. Algorithm and Scoring
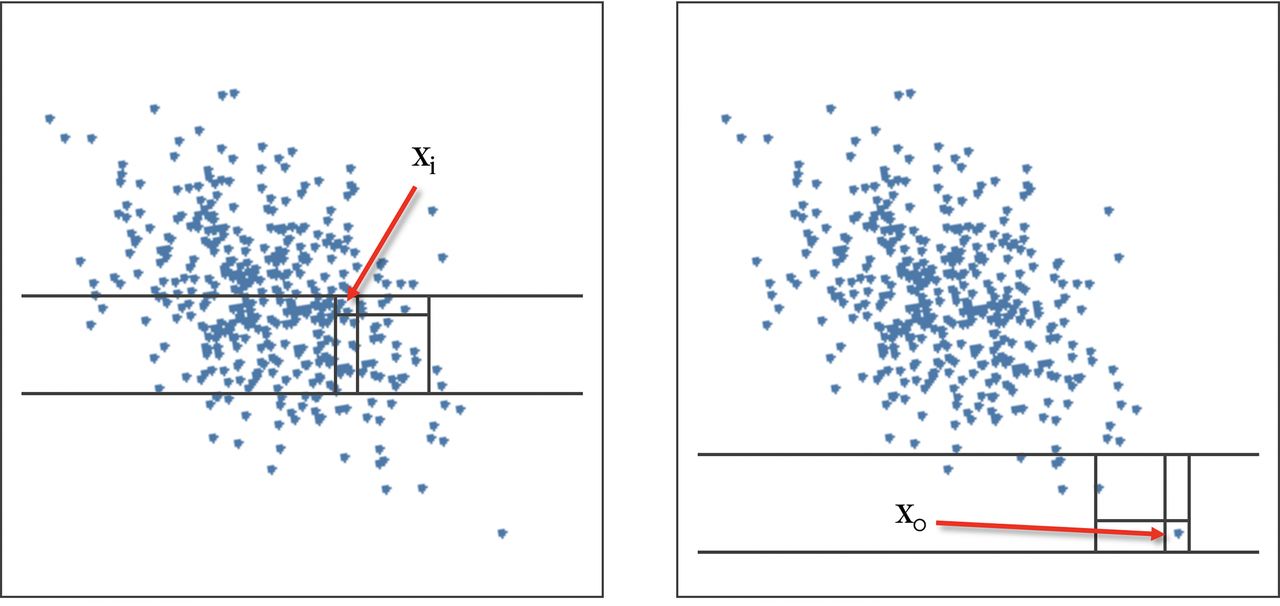
The DoE was created to include outliers in the experiments because the algorithm that aims to be qualified was the Isolation Forest. This algorithm was intended to identify outliers from a collection of values using an iterative mechanism of data isolation. Therefore, given a set of data points, the algorithm scans the data set by drawing random separations in the multidimensional space. Each separation is called a decision and splits the space into two distinct parts where a separated square region called a box is drawn for every data point. It means that every single data point is isolated from the other by drawing successive frontiers. The number of frontiers needed to isolate each value will be different given the proximity of these precise data points to the other values. Then the inliers will need a lot of decisions to be isolated in a box, whereas the outliers are very easily isolated with only a few decisions. The number of needed decisions to isolate the point is called the isolation number. The sample of values is finally ranked by their associated number of decisions. The ones that needed fewer decisions to be defined are the outliers, and the rest are classified as inliers. When using the Isolation Forest algorithm to make a prediction, the isolation number is calculated for the new data point as represented in Figure 8 (46).

Isolation Forest explanatory schema. Left: inlier representation in which many splits are needed in order to be isolated. Right: outlier value quickly isolated by a few decisions.
The algorithm applied in this article required use of sensitivity and precision as measurements of scoring. In this article, score was equivalent to sensitivity and precision, although this assumption may not be true when other algorithms are managed. Both measures were defined for the Isolation Forest algorithm as follows:
Sensitivity (score): For the studied algorithm, a positive event was an outlier, and practically all the experiments ran under these conditions. For the experiments representing positive events, each experiment was previously initialized by removing all the noise produced before and after the experiment (mainly erasing the setup phase and ending process). The sensitivity was computed by means of the total positives (TP) and false negatives (FN) by the expression:
Precision: For the non-outlier conditions, which means, that the algorithm runs under normal conditions, applying the same criteria to cleaned data as described in the sensitivity score, the data is composed only of negative events (inliers). Hence, the precision and the false positive rate can be computed by means of the false positives (FP) and the true positives (TP) by the expression:


The DoE defined for this experience only considered three experiments without outliers, where the score was measured by the precision. For the rest of the experiments, sensitivity was the score. The applied numerical criteria were based on the assumption that the test passed if the score (sensitivity or precision) was >80%. If the score was below, the performance of the model for the specific experiment was considered significantly impacted by the input variables of the experiment.
It is worth highlighting that the scoring was not relevant in this study, because it was dependent on the used algorithm that required qualification. The scoring described here was for example only.
6. Results
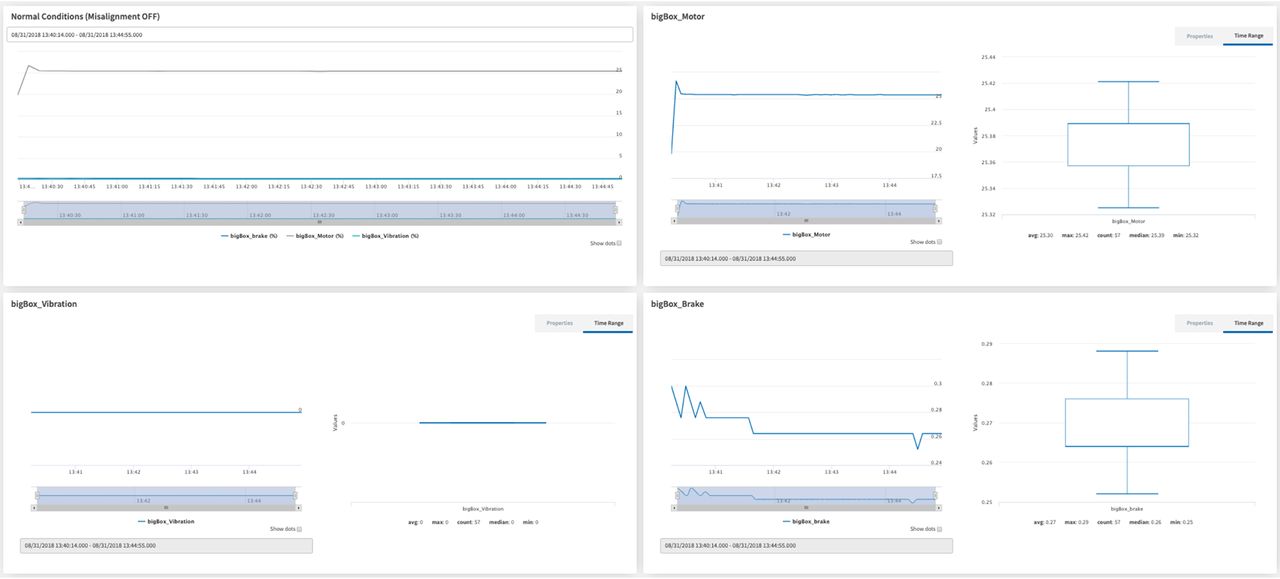
The manufacturer of the bigBox established the normal running mode of the motor when MS Main = 25%, which is considered as normal speed, and regulating the rest of parameters with the minimum values. Rates configured above these values were considered as forced conditions. Five replicas of the experiment characterized by a normal speed and no induced perturbations designated by [MS Main = 25; MS Imbalance = 0; MS Brake = 0; MS Misalignment = 0] were created, using three of them for training and two of them for testing the algorithm. The experiment used for the normal conditions is represented in Figure 9. The boxplot shows the variability for each factor in this experiment. As can be observed, vibration was completely constant, whereas break and motor had some variability around the target values (Figure 9).

Distribution of values for normal conditions without outliers.
Each experiment was composed of approximately 60 points, depending on the time that the experiment was running, dedicating 5 minutes as a general rule. The model was trained using data generated by the normal mode, but this configuration also contained some outliers caused by the starting phase before the motor achieved the stable regime. The performance of the model on all the remaining 123 experiments having the scores are represented by the heatmap in Figure 10).

Scoring calculated for each replica and value distribution. Notice that the misalignment values have been grouped into two categories because this mechanism presents a Boolean behavior, taking values 0% (OFF) or 100% (ON). All values, including the scores, are measured in % as a unit of measure.
The outcome was that the higher the score, the better the model was at spotting outliers. During the experiments execution and scoring evaluation, some combinations of signals required special attention to be properly interpreted:
[MS Main = 25; MS Imbalance = 0; MS Brake = 0; MS Misalignment = 0]: The five replicas of this experiment must be considered as a special collection of tests because they are representing a right behavior under normal running conditions. Those tests were made to certify that the algorithm does not output outliers while the motor is running in normal mode. For those tests, the fewer the outliers detected by the algorithm the better would be the expected efficacy. The result was 9% and 21% of outliers during the verification of the two replicas, which is a low number of outliers that indicates good behavior.
[MS Main = 25; MS Imbalance = 0; MS Brake = 0; MS Misalignment = 100]: One replica produced a score of 65%, which was low for this configuration, but the three other replicas gave high scores, so it cannot be concluded that only misalignment is affecting the performance of the algorithm. The evidence leads to the conclusion that the algorithm was robust to misalignment actions.
[MS Main = 25; MS Imbalance = 0; MS Brake = [50,100]; MS Misalignment = 0]: Two out of the three replicas had scores <80%, so it cannot be concluded that this experiment affects the performance of the Isolation Forest algorithm. The algorithm was less robust when it comes to detecting brake intervening without other default.
7. Discussion
The DoE composed for this proposal has been specifically created to qualify the Isolation Forest algorithm from an agnostic perspective, not strictly linked to the nature of the engine used to generate the data set. The applied methodology can be observed for a general purpose, and the results must be analyzed from an eclectic perspective. Therefore, the conclusions derived from the results could be summarized in Table II.
Conclusions Derived from the Abstraction Exercise After the Results Analysis Generated by the Design of Experiments Applied to the Isolation Forest Algorithm
The low detectability of outliers produced by the input variable MS Brake shown by the Isolation Forest compared with the rest of the signals was related to the physical meaning, with a direct dependence of this factor on the speed (MS Main). Actually, the rotation speed was controlled by the brake adjustment. On the other hand, when more than one type of non-normal values for current signals were included, the algorithm was very good at detecting the modification of the behavior. This was because the algorithm worked better when a multivariable effect is produced in the system. The variety of experiments provided a valid sampling of use cases, covering the expected range of detectability, from high to low detection. Furthermore, the algorithm was trained using the worst-case scenario, applying data sets with no outliers except those produced during the engine initialization.
Conceptually, including experiments that cover all the expected casuistries is good practice for qualifying AI algorithms, from a generic viewpoint. Obviously, the number of combinations and replicas performed during the experience could be larger, assigning a broad variety of established conditions for each input variable. The focus of this exercise was concentrated on the process itself rather than on the data set. From an experimental point of view, a structured DoE was performed using all the operational ranges of the bigBox. This data could be used to qualify other algorithms using the same methodology and data, which would allow not only a comparison of which algorithm performs better but also the effect of each factor in every algorithm. From a methodology perspective, the same strategy applied in this article could be applied to work with synthetic datasets. The use of a DoE in this case will allow us to control which features of the data sets have more influence on the algorithms and results, thus allowing us to recommend an algorithm to be used based on the characteristics of the real data.
The data set generated for the DoE described in this article was created by triggering manual actions on the device specifically designed for this purpose. A new approach that is under construction is intended to generate the data set synthetically, offering more customizable combinations of value collections and reducing the potential errors caused by the human–machine interaction.
In the presented experiment, a vertex of the DoE corresponding to the ideal working conditions of the motor was used as a training set, and the rest of the vertices and other replicates of the same experiment were used as test sets. This approach was used because the normal operation conditions are well known. When qualifying algorithms with synthetic datasets, this strategy (usage of one vertex for training and the rest for prediction) can be applied, taking into account each of the vertices, thus calculating the scores for all possible permutations of training and test sets. This will allow knowledge of, for example, which algorithms will perform better, depending on the conditions of the training sets, and what impact every feature in the datasets has for every algorithm for the training and/or test sets.
Data science provides innovative tools to interrogate, analyze, and manage data sets generated by complex systems in science. The required accuracy and thoroughness that must be applied within AI model creation has to ensure the expected quality of the results. Verification and validation can prevent problems and allow the development of more useful and precise models (5) but qualification should be considered as the first stage in the procedure. QbD principles as they have been defined by the ICH for the pharmaceutical industry are a set of guidelines that aim to obtain knowledge from multivariable systems through a systematic approach. The application of QbD to the definition of datasets that match a controlled structure and take into account different properties such as the use of variables that are highly correlated, or have different orders of magnitude or very different standard deviations on their values, will allow us to select a tailored dataset to qualify the algorithm, taking into account the characteristics of the real problem to be tackled. In conclusion, the devised DoE and experiment strategy were adequate, and a valid qualification was obtained for the algorithm. A similar approach can be used for other algorithms, applying the corresponding abstraction level.
Conflict of Interest Declaration
The authors whose names appear at the beginning of this document confirm that they have a professional relationship because they all worked in the same company while the paper was prepared. Nevertheless, all the authors certify that their interest is totally scientifically oriented and they ratify that the subject matter discussed in this manuscript has been developed as a personal initiative without any financial or nonfinancial reward delivered by the company because of the document preparation.
Acknowledgments
This paper was developed based on an experimental data set generated by an equipment sponsored by Bigfinite and designed by Hitec SRL (Buenos Aires, Argentina). Data were donated by Bigfinite and were managed through the Bigfinite cloud platform in order to ensure good practices in the process of data governance. The Isolation Forest algorithm was executed from the Bigfinite platform, which was ceded for the experiments described in the document. The DoE was devised by Toni Ruiz and executed by Aina Manzano. The technical review was performed by Jordi Guitart, Cristina Fernàndez, and Rodolfo Díaz.
- © PDA, Inc. 2021


