
Abstract
According to the standard guidelines by the FDA, process validation in biopharma manufacturing encompasses a life cycle consisting of three stages: process design (PD), process qualification (PQ), and continued process verification (CPV). The validity and efficiency of the analytics methods employed during the CPV require extensive knowledge of the process. However, for new processes and new drugs, such knowledge is often not available from Process performance qualification and Validation (PPQV). In this work, the suitability of methods based on machine learning/artificial intelligence (ML/AI) for the CPV applied in bioprocess monitoring and cell physiological control of the yeast Pichia pastoris (Komagataella phaffii) was studied with limited historical data. In particular, the production of recombinant Candida rugosa lipase 1 (Crl1) under hypoxic conditions in fed-batch cultures was considered as a case study. Supervised and unsupervised machine learning models using data from fed-batch bioprocesses with different gene dosage clones under normoxic and hypoxic conditions were evaluated. Firstly, a multivariate anomaly detection (isolation forest) model was applied to the batch phase of the bioprocess. Secondly, a supervised random forest model for prediction of required operator's control actions during the semiautomated fed-batch phase under hypoxic conditions was assessed to maintain the respiratory quotient (RQ) within the desired range for maximizing the specific production rate (qP). The performance of these models was tested on historical data using independent evaluation of the process by the process control engineer (subject matter expert—SME), and on real-time data in the case of manual action prediction, where the model was implemented to guide the control of the bioprocess. The work presented here constitutes a proof-of-concept that multivariate analytics methods, based on machine learning, can be a valuable tool for real-time monitoring and control of biopharma manufacturing bioprocesses to improve its efficiency and to assure product quality.
- Bioprocess engineering
- Bioreactor
- Pichia pastoris
- Artificial intelligence (AI)
- Machine learning
- Anomaly detection
- Random Forest
Introduction
The PhRMA Quality Technical Committee defined manufacturing science in the pharmaceutical field in 2003 as the body of knowledge available for a specific product and process, including critical-to-quality product attributes and process parameters, process capability, manufacturing and process control technologies, and quality systems infrastructure. This definition is crucial to understand the scope of the research described in this work. In biopharmaceuticals, the expected requirements need to be met to ensure product quality. However, robust processes are synonymous with operational control, and robust processes represent an additional warranty to produce the expected quality. Advanced Process Control (APC) is a term used to describe procedures and technologies applied in industrial frameworks to ensure that processes are under control when there is a multivariable approach by more than one measurement, more than one final control element, the control addresses the interaction between process variables and incorporates functions such as constraint control that are intended to optimize process operations (1). Unfortunately, in pharma biomanufacturing, the APC systems are still managing processes by univariate controls (2). Multivariate analysis is a set of techniques used to understand and interpret the complexity embedded in a system governed by multiple dimensions, and it is useful in the biotech field (3). Although multivariate techniques are broadly accepted in biopharmaceutical environments, artificial intelligence (AI) is still not adopted in Good Manufacturing Practices (GMP) environments, even though it has a demonstrated value in the industry (4).
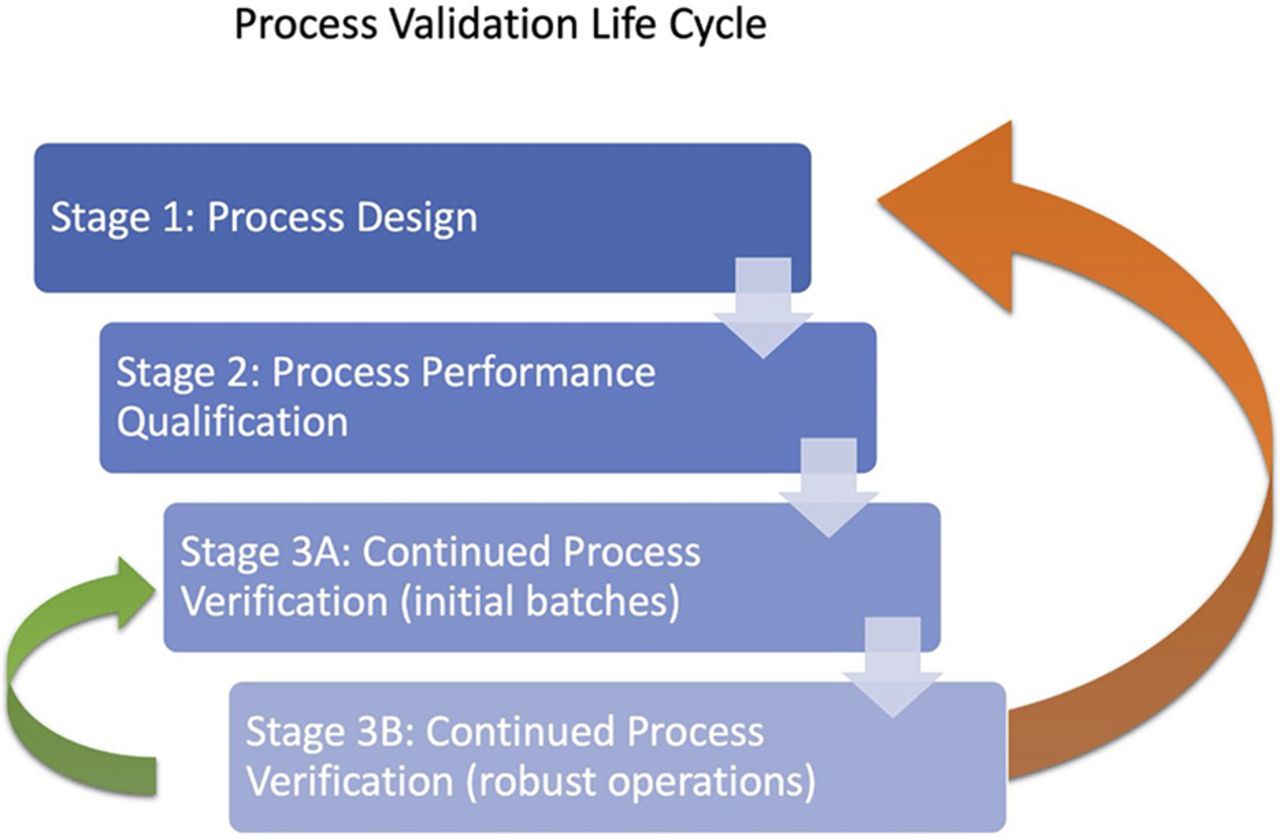
When the Food and Drug Administration (FDA) published the first version of the Process Validation guidelines (FDA, 2011) (5), the administration established the path for implementing the expected quality, safety, and efficacy by design in the product, as well as in the process. These guidelines establish the continuation of the initial proposal established by the International Conference on Harmonisation (ICH) guidances for industry, Q8(R2) Pharmaceutical Development, Q9 Quality Risk Management, and Q10 Pharmaceutical Quality System. process validation encompasses a life cycle approach that includes three stages: process design (Stage 1), process qualification (Stage 2), and continued process verification (CPV, Stage 3) (Figure 1).

Process validation schema based on the FDA guidance (FDA, 2011). The two arrows indicating the possibility to bring feedback to previous stages are an interpretation proposed by the authors based on the goal of this research applied to the FDA guidance.
Established conditions (EC) are defined as legally binding information (or approved matters) considered necessary to assure product quality (6). The ECs, which include critical material attributes (CMAs), critical process parameters (CPPs), key process parameters (KPPs), and critical quality attributes (CQAs), are not sufficient to describe a real and complete picture of the drug manufacturing bioprocess as they were designed at Stage 1. New results or additional factors not considered during Stage 1 or Stage 2 that would be relevant could appear during the production. Stage 3 is typically a long manufacturing phase in which extensive data is accumulated, trended, and analyzed to ensure that the bioprocess is always under control. The drug manufacturing and the implemented industrial processes are verified at Stage 2, but the inherent variability of the huge number of elements involved in the industrialization of the drug design is always providing uncertainty to the process. Depending on the robustness of the initial quality by design process, a backward movement to the previous stage or even to Stage 1 often has to be considered (Figure 1).
In general, chemical processes are usually considered much easier to be on-line monitored than bioprocesses. Therefore, the implementation of CPV in pharmaceutical industries is easier for products obtained by chemical transformations rather than biological processes or biotransformations. It is due to the lower complexity of the process and the need not to include so many key process variables. Moreover, CPV has been considered as an essential mechanism to implement APC in biomanufacturing processes (2) and a relevant procedure to ensure consistency of biologics manufacturing (3).
The methylotrophic yeast Pichia pastoris (Komagataella phaffii) is a widely used microbial cell factory for the metabolites and recombinant proteins production (RPP), including both biopharmaceutical and industrial enzymes (7⇓⇓⇓–11). Most of them are secreted to the culture broth facilitating the subsequent downstream processes due to the low secretion of native proteins and other metabolites. Although the inducible alcohol oxidase 1 promoter (PAOX1) has been the classical promoter used with the expression regulated by the presence of methanol, development of alternative new methanol-free expression systems is considered of great interest during the last years to avoid the drawbacks and costs associated with the storage and handling of methanol as well as the operational problems caused by the methanol metabolism (12). The most used methanol-free alternative is the widely used constitutive glyceraldehyde-3-phosphate dehydrogenase promoter (PGAP) (13⇓–15). Consequently, great efforts have been undertaken to improve bioprocess efficiency with PGAP, boosting the production yields and rates to become a cost-effective alternative to PAOX1 for the industrial production of recombinant proteins.
It has been reported in previous works that cellular stress in P. pastoris and other yeasts can trigger an increase in production parameters (12, 16). Therefore, implementation of hypoxic conditions as a novel and nonconventional cultivation strategy can lead to significant increases in terms of specific production rate (qP) and productivity (17⇓–19). This environmental stress leads to a shift from a respiratory to respiro-fermentative metabolism, which can be monitored by either ethanol production and/or an increase in the respiratory quotient (RQ) as indirect reporting parameters. Therefore, these parameters must be properly controlled not only to maximize protein production but also to keep a constant protein quality to standardize the process and to guarantee the reproducibility between lots.
Process modeling can be applied to perform an optimized, feasible, precise, and robust process control. Mechanistic and data‐driven modeling possess separate unique advantages as well as disadvantages and limitations due to their respective model structures. No general statement can be made about whether mechanistic, data‐driven, or hybrid approaches (20⇓–22) are more suitable, because the selection is strongly dependent on the available process knowledge and measurement systems (off-line/on-line) as well as the number of data sets and data points (23). However, the fact that P. pastoris bioprocesses have distinct process phases such as batch, transition, and fed-batch phases, with more than one substrate and time-varying key process rates, makes the likelihood of finding a single model that captures the information necessary for a proper predictive model rather low (22). Hence, the use of data-driven models in the sense of learning from experience with measurement data represents a suitable alternative. In addition, the run-to-run variability on bioprocess model parameters and predictions that present the currently available macroscopic models (24, 25) is not low enough for a successful use in process control. Thus, as an alternative, the relationships between state variables such as biomass, substrate, and product concentrations and the measured variables can be modeled to a sufficient degree of accuracy with modern data-driven AI methods developed by the machine learning (ML) community.
AI algorithms have been promoted as valid analytical methods, and good practices have been proposed for biopharmaceuticals manufacturing. Two AI algorithms (Neural Networks and Support Vector Machines) were introduced by the European Pharmacopoeia (26) as valid chemometric methods applied to analytical data in pharma contexts. The FDA proposed different tools and techniques to reduce the variability and to understand the effects of the unavoidable and unpredictable events on commercial manufacturing processes. Unknown factors can lead to byproducts formation due to perturbations on operating conditions or nonconsidered process variables, which may affect bioprocess efficiency and product quality. A more recent publication elaborated by the FDA described a methodology for AI application in medical devices (FDA, 2021). Thus, the CPV highly recommends bioprocess automation, use of process analytical technologies (PAT), risk assessment, and a deep knowledge of the biomanufacturing process and drug product attributes. They are considered and evaluated individually, although most of them are part of a multivariate and complex reality. Statistics and multivariable analysis can be complemented with AI to bring more knowledge at this stage.
Many AI algorithms have been developed and can be applied to tasks such as describing the relationships between variables in the bioreactor. The support vector machine regression (SVR) techniques are one example, neural networks and relevance vector machines are other alternatives (20, 27). Some recent examples of applications to P. pastoris bioprocesses include a neural network-based feedback control for methanol feeding (28) and final yield prediction (29) in case of recombinant antibody production, and a support vector machine (SVM) regression-based yield prediction in an insulinase production system (30).
However, another class of AI/ML algorithms that are particularly suitable for such tasks are algorithms based on decision trees, such as random forest regression, which has also been implemented due to its versatility, no need for complex parameterization, no need for variable normalization or scaling, relative insensitivity to outliers, and ability to extract the important predictors by feature importance, making the resulting models more interpretable (27).
In addition to supervised learning methods described previously, which aim to model the relationship between independent variables and a target variable (typically a critical quality attribute, CQA), another potentially useful application of AI methods is outlier detection. One of the main root causes of issues in drug manufacturing are mechanical human interactions within the production chain (31). The routine actions executed by process operators are often a source of failures. In contrast to univariate outlier detection, AI algorithms for outlier detection (or anomaly detection) can detect outliers in a dataset in a multivariate manner, considering not only data points that are anomalous in a single variable but also detecting potential anomalous combinations of variable values. Several ML algorithms have been adapted and developed for multivariate anomaly detection, such as one-class support vector machine (SVM), local outlier factor, and isolation forest (32⇓–34).
AI can replicate simple manual tasks of human cognition in an automated way, and as such, it is suitable for controlling multiple processes with a high number of variables to make fast decisions. AI is already extensively used in operations such as image recognition, multivariate prediction, or fast classifications (35, 36). The overall goal of the present work is to develop and implement AI for CPV to demonstrate that AI can be used as not only a multivariable tool for detecting bioprocess anomalies but also for estimating the most suitable operating conditions for bioprocess intensification, including bioprocess efficiency and product quality in real time. The previously described P. pastoris cell factory was selected as a case study producing Candida rugosa lipase 1 (Crl1) regulated by the constitutive PGAP, one of the most promising industrial lipase enzymes for biocatalysis (37, 38). Specifically, the use of AI modeling to detect anomalies in high automated bioprocesses and to develop a novel physiological control strategy based on AI has been explored.
Materials and Methods
Risk Assessment
Risk assessment was performed before the start of the study. The results of the risk assessment are in the Table A-I at the end of the document.
Strain and Cultivation Methods
Clone Construction and Gene Dosage Determination:
Two clones of P. pastoris harboring one (single-copy clone, SCC) and five (multicopy clone, MCC) copies of the C. rugosa lipase 1 (CRL1) expression cassette regulated by PGAP were tested in chemostat and fed-batch mode. The clone construction and the gene dosage determination have been previously described in other works (39, 40).
Chemostat and Fed-Batch Cultivation:
Chemostat cultivations with these clones (SCC and MCC) had been performed before this study to evaluate the effect of oxygen limitation as described in previous published works (19).
For the work presented hereafter, the producer clones were grown in carbon-limited fed-batch cultures with a preprogrammed exponential glucose feeding profile at a constant specific growth rate (μ) of 0.10 h−1 in both normoxic and hypoxic conditions. This strategy allows a pseudostationary state to be reached as has been described elsewhere (14, 41). Prior to the fed-batch phase, a glycerol batch phase was conducted (14). The composition of both batch and fed-batch media have been previously reported (19). Temperature and pH were controlled at 25°C and 6.0, respectively. The inlet gas flow rate was 2 L min−1. The fermentations were done in a 5 L Biostat B Fermenter (Sartorius Stedim, Goettingen, Germany), equipped with MFCS/win 3.0 Process Control software for the monitoring and control of the fermentation.
Analytical Methods
Biomass Concentration and Composition:
Biomass dry cell weight (DCW) analysis was performed as described previously (42). Biomass elemental composition was also determined as it was done in other studies (43). In both cases, the relative standard deviation (RSD) of the measures was below 5%.
Lipase Production:
Product quantification was performed through a lipolytic assay, using p-nitrophenyl butyrate (pNPB) as a substrate for Crl1, as previously described (44). Product titer is presented as activity units·mL−1, in which one activity unit is defined as the amount of enzyme needed to hydrolyze 1 µmol ester bond per min. RSD of the analysis was below 1%.
Carbon Source and By-Products Quantification:
The concentrations of substrates and potential fermentation by-products were analyzed through high-performance liquid chromatography (HPLC) for each sample. The software for the quantification and the column specifications are described elsewhere (45). The RSD of the method was below 1%. In addition, ethanol concentration was measured on-line with a Methanol Sensor System (Raven Biotech Inc., Vancouver, Canada) used in previous studies (46, 47). This sensor system is sensitive to other volatile compounds, and it was adapted to ethanol measurement, being calibrated in each fed-batch integrating HPLC data with the electric signal of the probe to obtain an on-line ethanol concentration profile.
Inlet- and off-Gas Analyses:
To analyze CO2 and O2 mole fractions of both the inlet- and the off-gas, a BlueInOne FERM (BlueSens, Herten, Germany) analyzer linked to the software BlueVis (BlueSens, Herten, Germany) was used. As described in previous works (19), the recorded data was used to calculate the respirometric parameters: carbon dioxide emission rate (CER), oxygen uptake rate (OUR), and respiratory quotient (RQ). The RSD was below 5%. The gas analyzer was recalibrated for every fed-batch to assure an accurate and reliable data set.
AI Algorithms
Anomaly Detection Model:
The anomaly detection models were trained using the isolation.forest function from the isotree package in R software, with default parameters, except for where the column weights were specified. The data were split in hourly intervals from the beginning of the fermentation, and a separate model was trained for every interval. Finally, the trained models were applied to each data point to compute the anomaly scores. For visual clarity, the anomaly scores (output of the model) were binned and averaged in 1-hour intervals for visual clarity.
Ideal Agitation Prediction Models:
The random forest model for stirring rate was trained using the ranger function from the ranger package in R software. Before training the models, data were filtered so that only the data points that were considered in the ideal regime were kept. The number of trees constructed for the random forest models was 500, variance was used as the splitting rule, and no constraints were put on maximal tree depth. Impurity was used to calculate the variable importance.
Data Governance and Deployment of AI Models:
The raw data were stored and managed, and the models were deployed in the AWS cloud using the Aizon platform (Aizon, Barcelona, Spain) to ensure data integrity and compliance.
Results
Bioprocess Background, Experimental Setup, and Data Gathering
Previously, the application of hypoxic conditions in the production of an antibody fragment (Fab) increased up to threefold the specific production rate (qP) and specific productivity (QP) (17⇓–19). In the present work, this culture strategy has been applied to the recombinant production of Crl1.
To gather information about the system, a systematic study of the effect of hypoxic conditions has been made in chemostat cultures at a dilution rate of 0.10 h−1 with both producer clones (SCC and MCC). Chemostat experiments have shown that at around 12% O2 molar fraction in the inlet-gas can be found the transition between normoxic and hypoxic conditions. Accordingly, and regardless of the gene dosage of the clones, RQ increased linearly from a constant value close to 1.2 in normoxic conditions up to 1.6 once the culture achieved the most restrictive oxygen condition tested. Similar behavior was observed for ethanol-specific production rate (qEthOH) from ∼ 0 under normoxic conditions to the highest value of 0032 gEtOH gX−1 h−1 under the most severe hypoxic condition.
On the other hand, it must be noticed that the pattern observed for qP with respect to oxygen limitation differed from that observed with RQ or qEtOH. Although the value of these last two parameters increased linearly when oxygen limitation was applied, qP values showed a high increase when applying hypoxia but remained constant regardless of the hypoxic level. It can be stated that, in terms of qP, hypoxia acted as an on/off switch, generating a fivefold higher qP for SCC and a threefold higher qP for MCC comparing hypoxic with normoxic conditions. As stated previously, the condition corresponding to 12% of oxygen in the inlet-gas acted as a transition between these two states, showing higher variability in qP values between replicates. In Table I, a summary of the main process parameters reached in chemostat culture is presented.
Summary of Crl1 and Ethanol Specific Production Rates, and RQ for the Stationary State at Different % O2 in the Inlet Gas Obtained in Chemostat Cultures
From these results, the next step was to design a culture strategy in fed-batch mode with P. pastoris under hypoxic conditions to reach the higher specific production rate observed under these operational conditions in chemostat cultures.
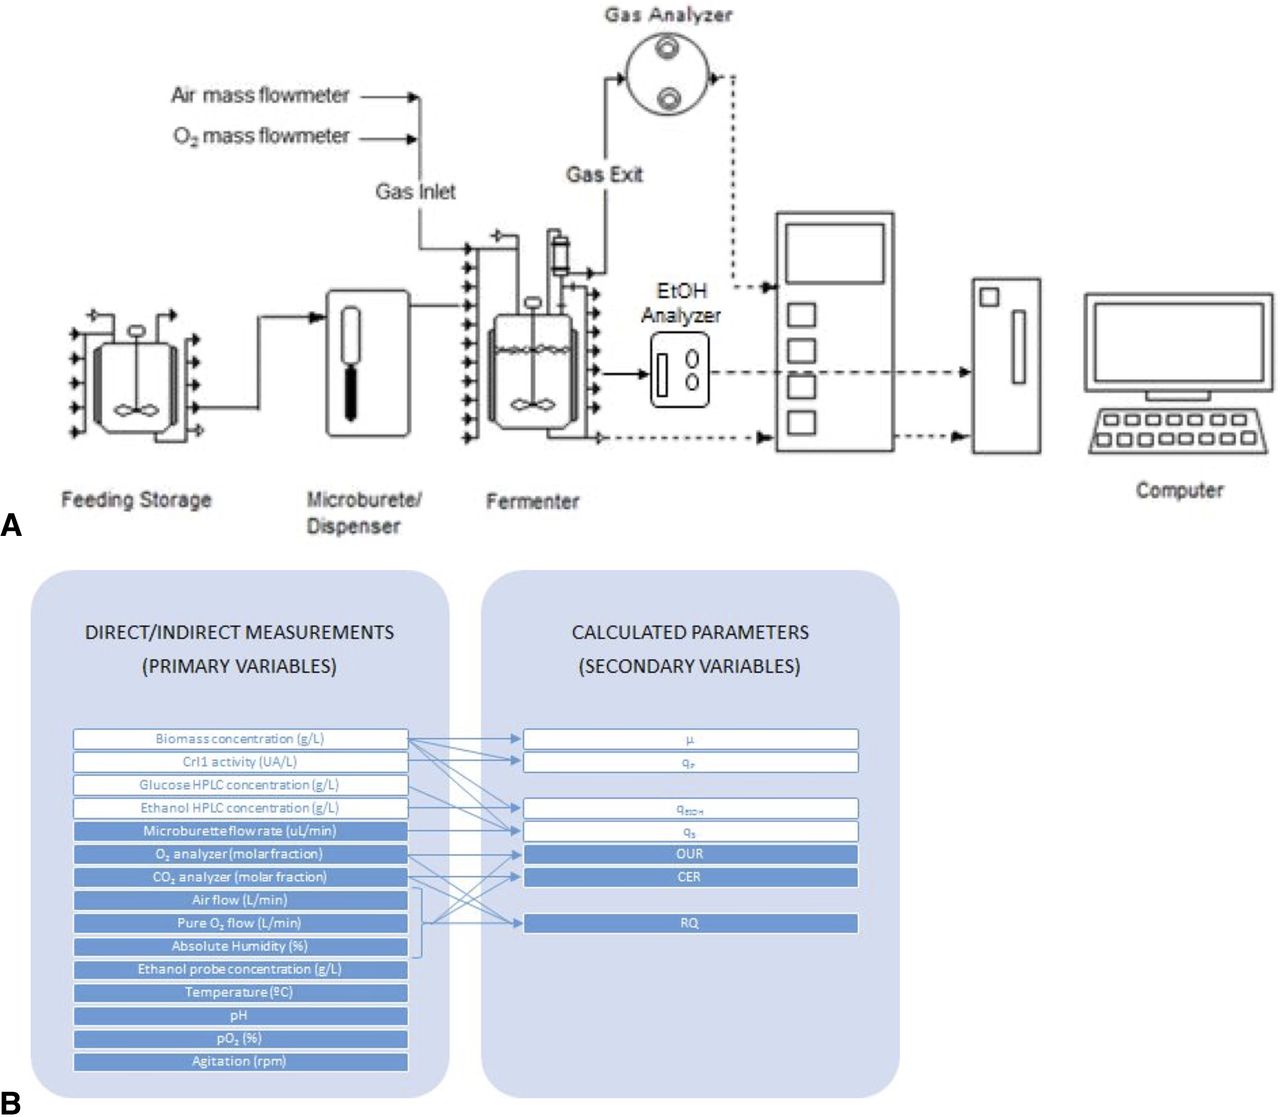
The experimental setup of the bioprocess is presented in Figure 2. A feeding glucose solution was added into the fermenter following a preprogrammed exponential profile through an automatic microburette to maintain a constant specific growth rate of 0.10 h−1. The out-gas was conducted through a gas analyzer to determine the O2 and CO2 molar fractions. Then, CER, OUR, and RQ (calculated as a ratio of CER and OUR) were calculated on-line from these measurements. In addition, a sensor of volatile compounds was coupled to the fermenter to monitor ethanol concentration. In Figure 2B, the collection of on-line and off-line data of the bioprocess is presented.

(A) Experimental setup to perform RQ control in fed-batch bioprocess. (B) Classification of off-line (white boxes) and on-line (blue boxes) data obtained from the bioprocess. Variables are separated depending on whether they are direct/indirect measurements (primary variables) or calculated parameters (secondary variables). Arrows indicate which measurements are used for the calculation of each parameter.
Physiological Control Strategy
From the previous bioprocess results obtained, RQ and qEtOH were selected as the most promising candidates to be controlled with the goal to maximize specific production rate (qP). Although both parameters can be monitored on-line, RQ was selected as the controlled variable, because it was considered more feasible and scalable as the control of ethanol production would be more complex and require some estimation techniques or software sensors. Considering an industrial scenario, the control was performed by modifying the stirring rate instead of the gas flow rate and composition, mainly with the aim of reducing costs, because lowering agitation power would decrease energy demands without the use of extra gases to modify gas composition in the inlet gas stream.
Thus, to maintain the RQ in the corresponding set point value or desired range, the agitation was modified following heuristic rules: to increase RQ, agitation was reduced to decrease O2 transfer rate to the culture media and therefore decrease OUR. To reduce RQ, the opposite action was carried out. Additionally, ethanol concentration was also monitored on-line using a Raven's probe, to double-check hypoxic level conditions.
In accordance with chemostat results previously described (48), preliminary experiments through manual action on stirring rate based on heuristic rules demonstrated that the control of RQ in fed-batch fermentations allows the obtainment of higher specific production rates. However, because the work aims to implement a feasible and robust control strategy, an estimation algorithm for the proper stirring rate is required.
Exploratory Analysis
A set of 11 fed-batch experiments was carried out at a constant specific growth rate of 0.10 h−1 with the single and multicopy clones under hypoxic and normoxic conditions. In Table II, the set of available experiments to feed AI algorithms is presented. MH-3-V was the experiment to validate the general algorithm under hypoxic conditions with the MCC.
Set of Experiments Performed in This Work, Classified According to the Clone Tested: Single-Copy Clone or Multicopy Clone (First Letter of the Fermentation Code, S/M); and Oxygen Supply Condition: Normoxic and Hypoxic (Second Letter of the Fermentation Code, N/H). Arrows Indicate the Good (↑), Average (→) or Bad (↓) Performance of Each Phase (Batch, Transition, Early Fed-Batch, and Later Fed-Batch)
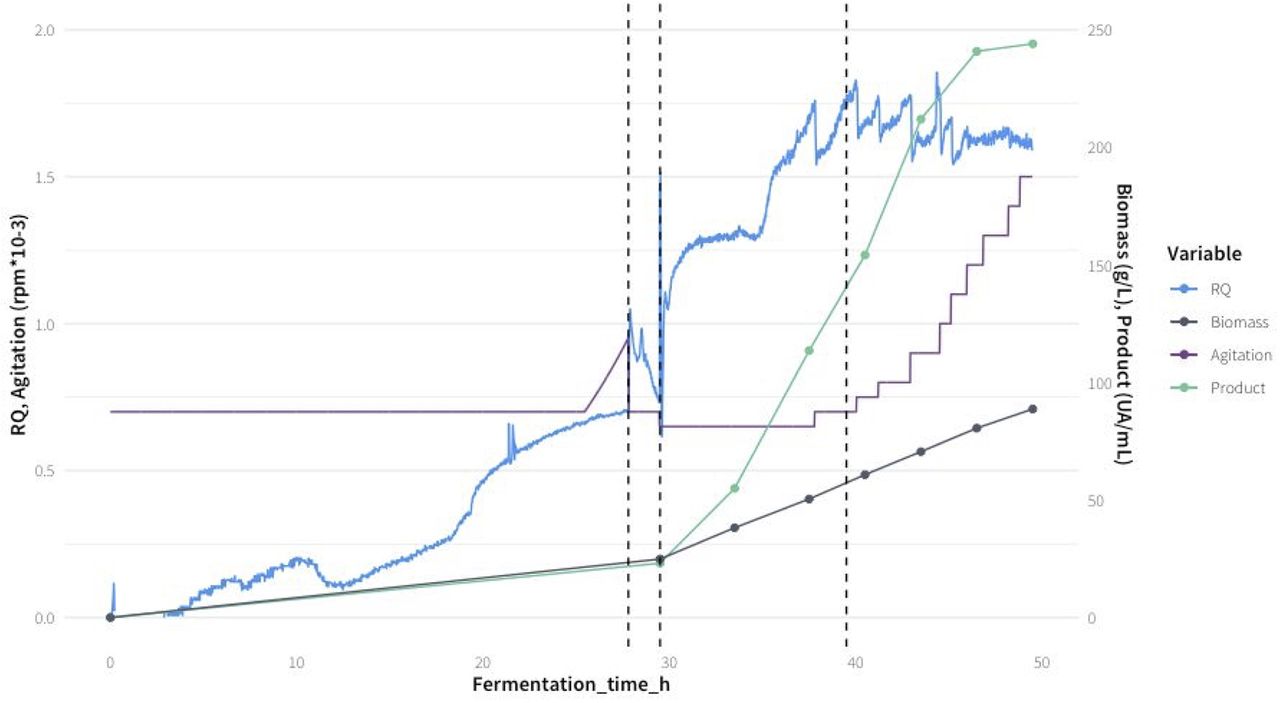
However, because the number of experiments to feed AI algorithms was quite limited, each fed-batch experiment was divided into four different phases as shown in Figure 3. Furthermore, the process was split into phases because they represent different subprocesses, with significantly different dynamics or time evolution characteristics due to the carbon source used, concentrations of substrates and biomass, and consumption and production rates.

The different phases of the bioprocess SH-3 as an example. The vertical lines represent the transitions between the 4 phases: Batch, Transition, Early fed-batch, Late fed-batch.
The main characteristics of the different phases for each process are detailed as follows:
Phase 1 Batch. This phase aims to generate a significant amount of biomass growing on glycerol. In the conditions used, the reached biomass concentration is about 25 g L−1. No off-line data is collected in this phase, and no manual actions are made; it can be considered as a routine phase before starting the fed-batch stage. The duration is around 20-24 h.
Phase 2 Transition. This phase runs between the end of the batch, once glycerol is completely depleted, and the beginning of the fed-batch, when the culture is fed with a glucose solution.
Phase 3 Early fed-batch. This phase lasts 10 h from the start of the fed-batch, and it is characterized by fewer control actions on the manipulated variable (stirring rate) required due to the slow dynamics of the culture.
Phase 4 Later fed-batch. The manipulated variable requires continued actions (increasing its value) to maintain the RQ set point. Normally, this phase starts when the biomass concentration is around 50 g L−1.
Finally, the different phases were classified by the process control engineer as “good”, “average”, and “bad”, according to their bioprocess expertise (Table II). The phase was classified as “good” if RQ was controlled within the desired range and the values of all parameters (especially biomass and ethanol concentrations and product titer) were those expected. On the other hand, the phase was classified as “average” if RQ was controlled within the desired range, but the value of any other parameter was significantly different from the expected (but without having a significant impact on biomass and ethanol concentrations and product titer). Finally, the phase was classified as “bad” if RQ was not controlled within the desired range and/or a significant impact on biomass and ethanol concentrations and product titer was observed. For the anomaly detections in phase 1, the experiments marked both as “good” and “average” were used, with a goal to detect the “average” experiments as anomalies (with suboptimal performance) in this phase. To calibrate the AI algorithms for the operator's control action to maintain RQ in its set point during phase 4, only the experiments under hypoxic conditions marked as “good” and “average” in phases 3 and 4 were used, not including experiment MH-3-V, which was only used for the model validation step.
Anomaly Detection:
As an alternative to univariate anomaly detection, whereby each process variable is monitored individually, a multivariate statistics method to efficiently summarize the entire bioprocess by transforming all the relevant variables into a single metric was selected. Ideally, this metric would indicate whether, and with what certainty, the bioprocess is anomalous. With this aim, the isolation forest algorithm (IFA) to implement the outlier detection was applied (32). The IFA was selected because it has been previously qualified for use for anomaly detection (49).
Even though there are a few manual operations such as inoculation, sampling, eventual foaming correction, and other minor operator's actions, the batch phase of the bioprocess is considered fully automated for this analysis. Thus, without considering manual actions, possible anomalies arise due to system perturbations, improper functioning of the equipment, and/or unexpected performance of the microorganism not detected. The dataset contains 10 fed-batches that were initially manually inspected and validated by the process control engineer. MH-3-V was not included in this set. Eight of them were labeled as “good” and unlikely to contain anomalous data points. In contrast, two were suboptimal, labeled as “average”, and it was hypothesized that these two fed-batches might contain data values that would be detected as anomalies.
Because the behavior of the variables is dynamic, combining all of the data points into a single model would not be an appropriate strategy, as the isolation forest model works by majority rule. Thus, the areas where variables change faster would be flagged as outliers. Because the outlier detection using isolation forest requires stationarity, it was necessary to split the data into subintervals for which the bioprocess can roughly be assumed to be constant. Taking into account that the batch phase lasts approximately 1 day and there are only slight differences in the duration between different batches, it was assumed that all the experiments proceeded at the same process rates and consequently, the experiments were aligned by absolute time. Thus, data were split into 1-h intervals and isolated forest models for each interval were trained. The training was made using multiple variables that included operating parameters (primary variables) such as pH, temperature, pO2, and O2 - CO2 molar fraction in the off-gas stream as well as the respirometry parameters (secondary variables): CER, OUR, and RQ. Because no significant differences were observed when the weights for individual variables were varied, the models were trained using equal weight for all variables. Comparing the distribution of anomaly scores of individual experiments revealed that some cultures consistently scored higher than others. Thus, these cultivations were further investigated.
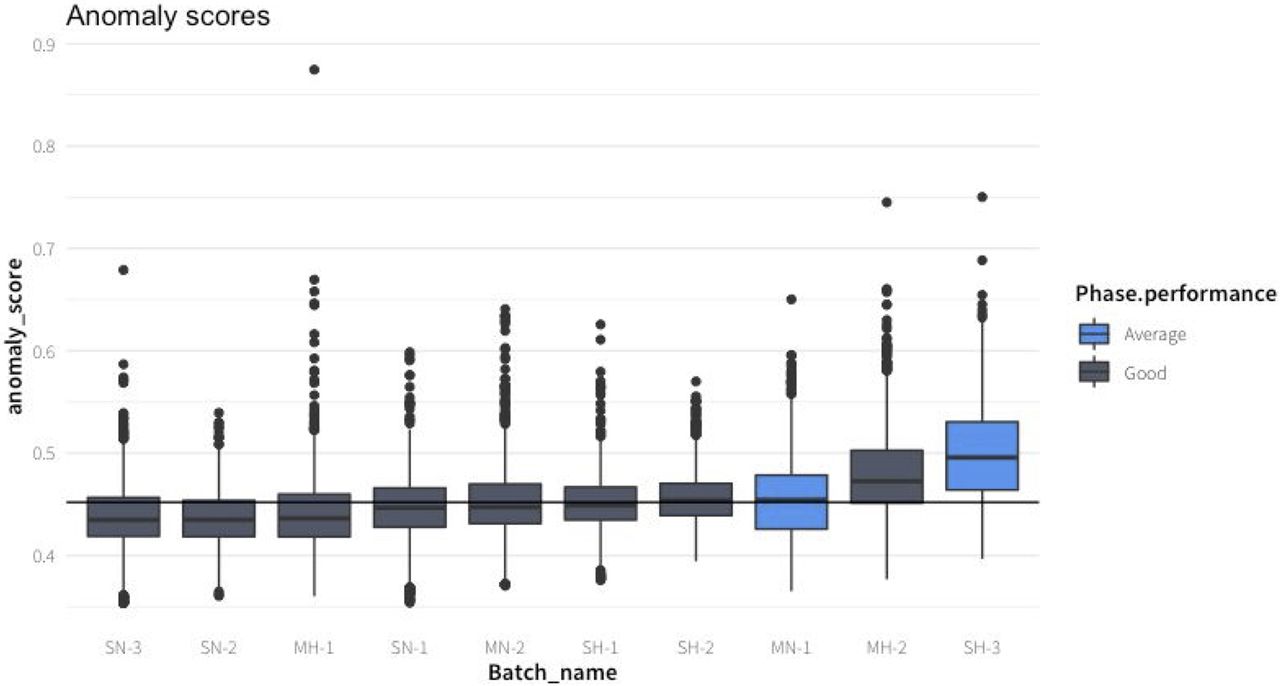
In Figure 4, the distribution of anomalies scored are presented for all experiments, and in Figure 5, the anomaly score over time is plotted. The highest anomaly score was obtained in SH-3; pO2 values were over 100% in the first hours, due to an undetected overpressure in the fermenter. In the experiment MH-2, which had the second highest anomaly scores, no untypical behavior was detected by the process control engineer. The third-highest scoring experiment (MN-1) was also flagged as suboptimal by the process control engineer operator: a malfunction of the base addition pump to keep the pH at the set point of 6 was detected. It is consistent with the previous knowledge that, except for the period during which the pH dropped in the time window around 15 h, the experiment was labeled as good.

Distribution of anomaly scores for each different batch culture colored by the expert according to the classification of the run. The batches were sorted by median anomaly score. The vertical line represents the global median anomaly score.

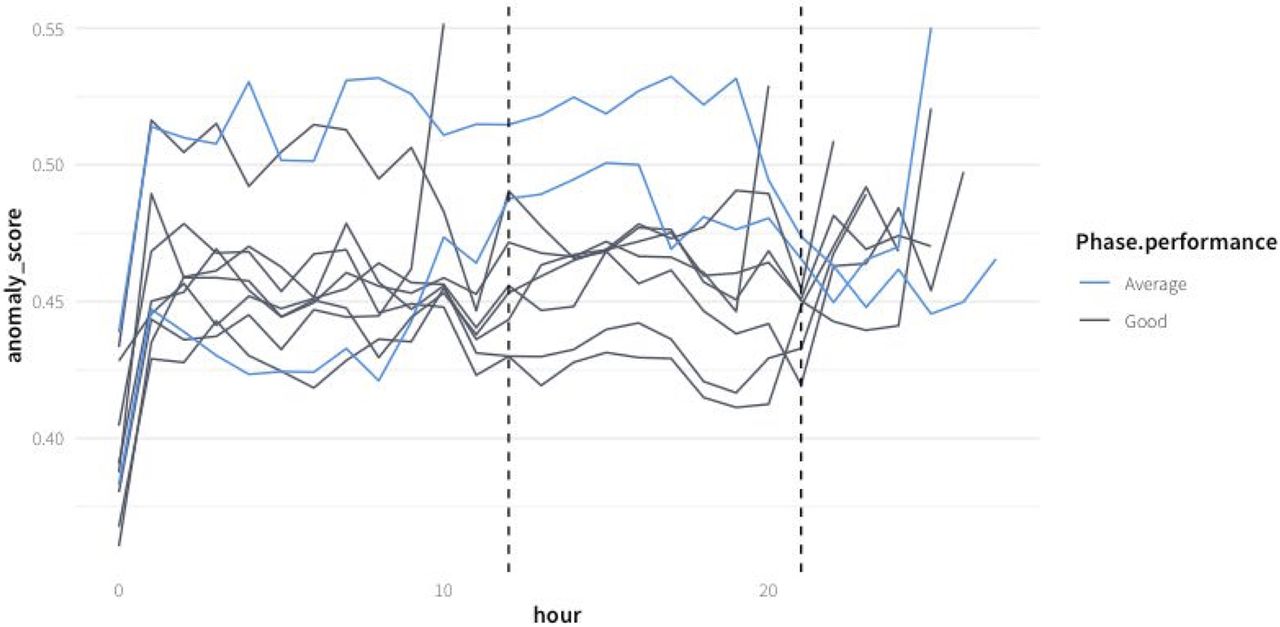
Anomaly score of the 10 analyzed batch cultures. The suboptimal experiments are plotted in light blue. The dashed lines represent the period for which the pH dropped below 5.5 during MN-1. Anomaly scores are averaged by hourly intervals for a cleaner visualization.
Overall, the anomaly score based on the isolation forest model accurately reflects known anomalous behavior.
AI Modeling Strategy to Predict Stirring Rate for RQ Control:
In contrast to the batch phase, where the bioprocess is considered fully automated, the fed-batch stages (phases 3 and 4) rely on manual actions to maintain the cell physiological state, especially when the culture is kept in hypoxic conditions. To maximize the specific production rate in hypoxic bioprocesses, RQ was selected as a controlled variable that was kept constant, and the stirring rate was manually controlled. Under hypoxic conditions, the suitable RQ values were selected to be in the wide range of 1.3–1.7, with 1.5 as the RQ set point value.
Due to the manual actions required during the fed-batch phase, it is expected to observe higher variability among the individual runs. Therefore, the application of anomaly detection in an unsupervised manner would not be a suitable strategy. Instead, a supervised modeling strategy was implemented. The approach was to give a dataset of successfully completed manually controlled fed-batches to formulate the problem of finding the ideal stirring rate at any moment as a supervised learning problem. Because the exact relationships between the concerned variables are unknown and very difficult to model without additional information, a deterministic model that does not account for empiric observations would likely yield inaccurate predictions.
This model was built based on the following assumptions: 1. Ideal stirring rate at a given time can be predicted only from the current state of the bioreactor, without considering the time evolution of bioprocess variables; 2. no explicit previously known relationship between variables is needed; 3. in the successful manually operated fed-batches, the actual stirring rate is considered ideal as long as the RQ is kept successfully between 1.3 and 1.7, and the data points where the value of RQ was out of the range were excluded.
Random forest regressor models were trained to predict the stirring rate based on the five critical variables that are concerned with the physiological state of the cell culture: RQ, CER, OUR, ethanol concentration, and substrate feeding rate.
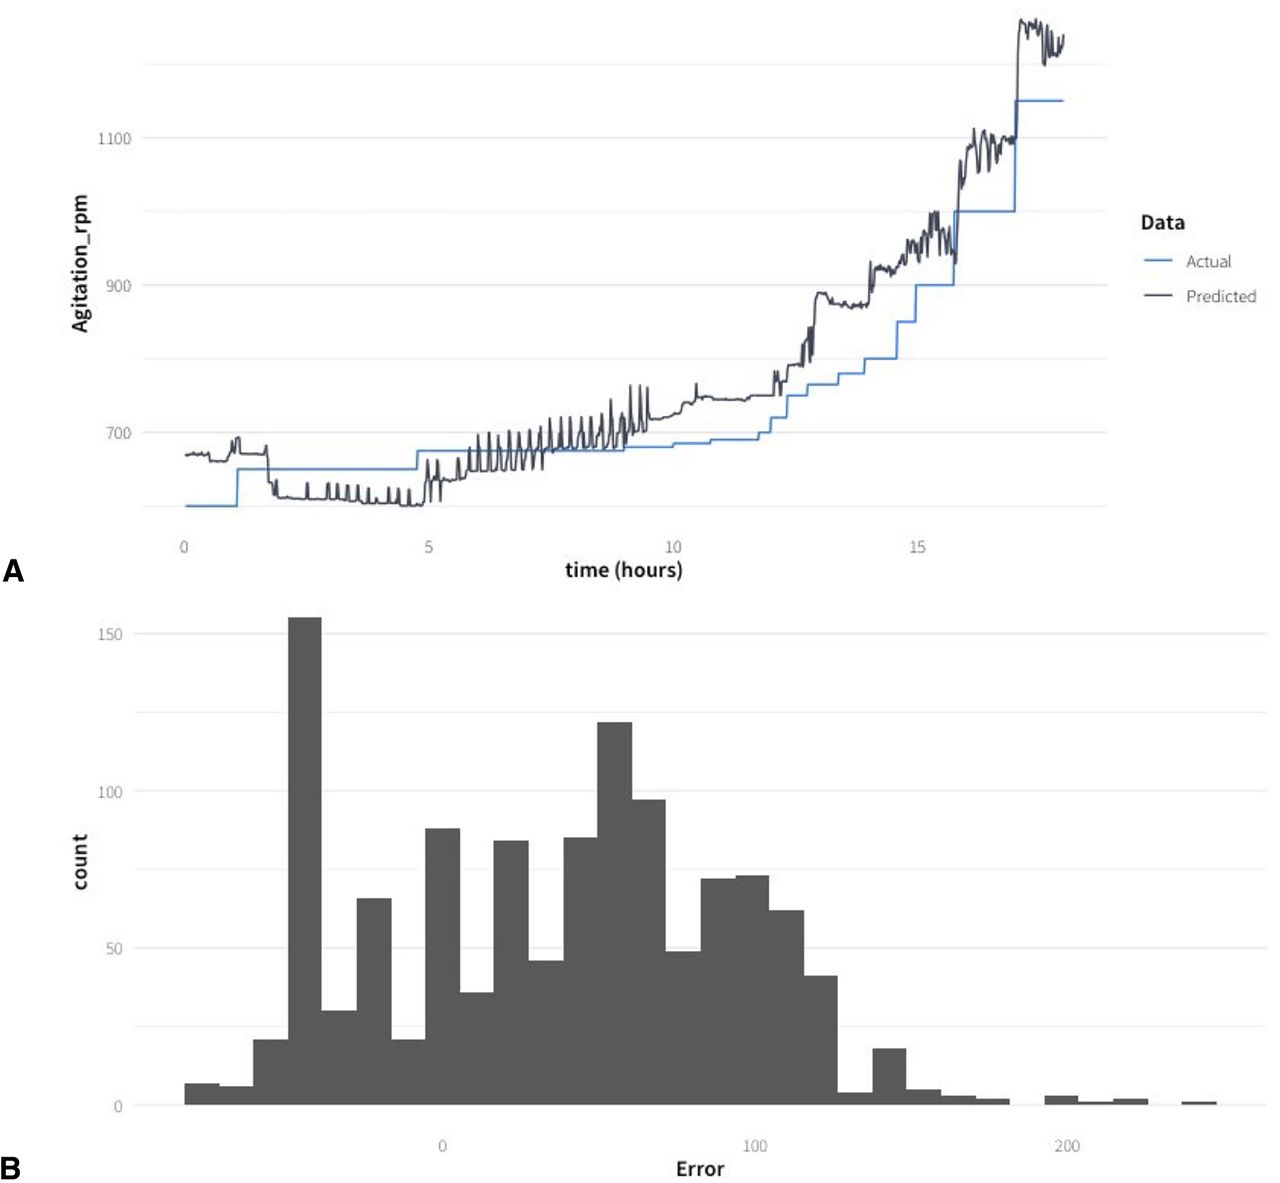
A first random regressor model (Model_1) was trained with three historical datasets from hypoxic fed-batches including SCC and MCC (SH-3, MH-1, and MH-2). The validation of the model was made with data from the SH-2 experiment. The predicted stirring rate is presented in Figure 6A showing a similar trend compared with the manual actions of the operator, and the mean absolute error of the prediction is 57 rpm. However, the predicted stirring rate is systematically higher than that chosen by the process control engineer (mean error = +38 rpm), and the model has a clear bias as the error distribution is not symmetric around 0 (Figure 6B). This bias of the model predictions likely represents a systematic error due to the run-to-run variability.

(A) Comparison of the stirring rate implemented by the process control engineer with the predicted values based on Model_1 for the SH-2 experiment dataset. (B) Distribution of the error from Model_1 evaluated on the unseen data (the entire SH-2 dataset).
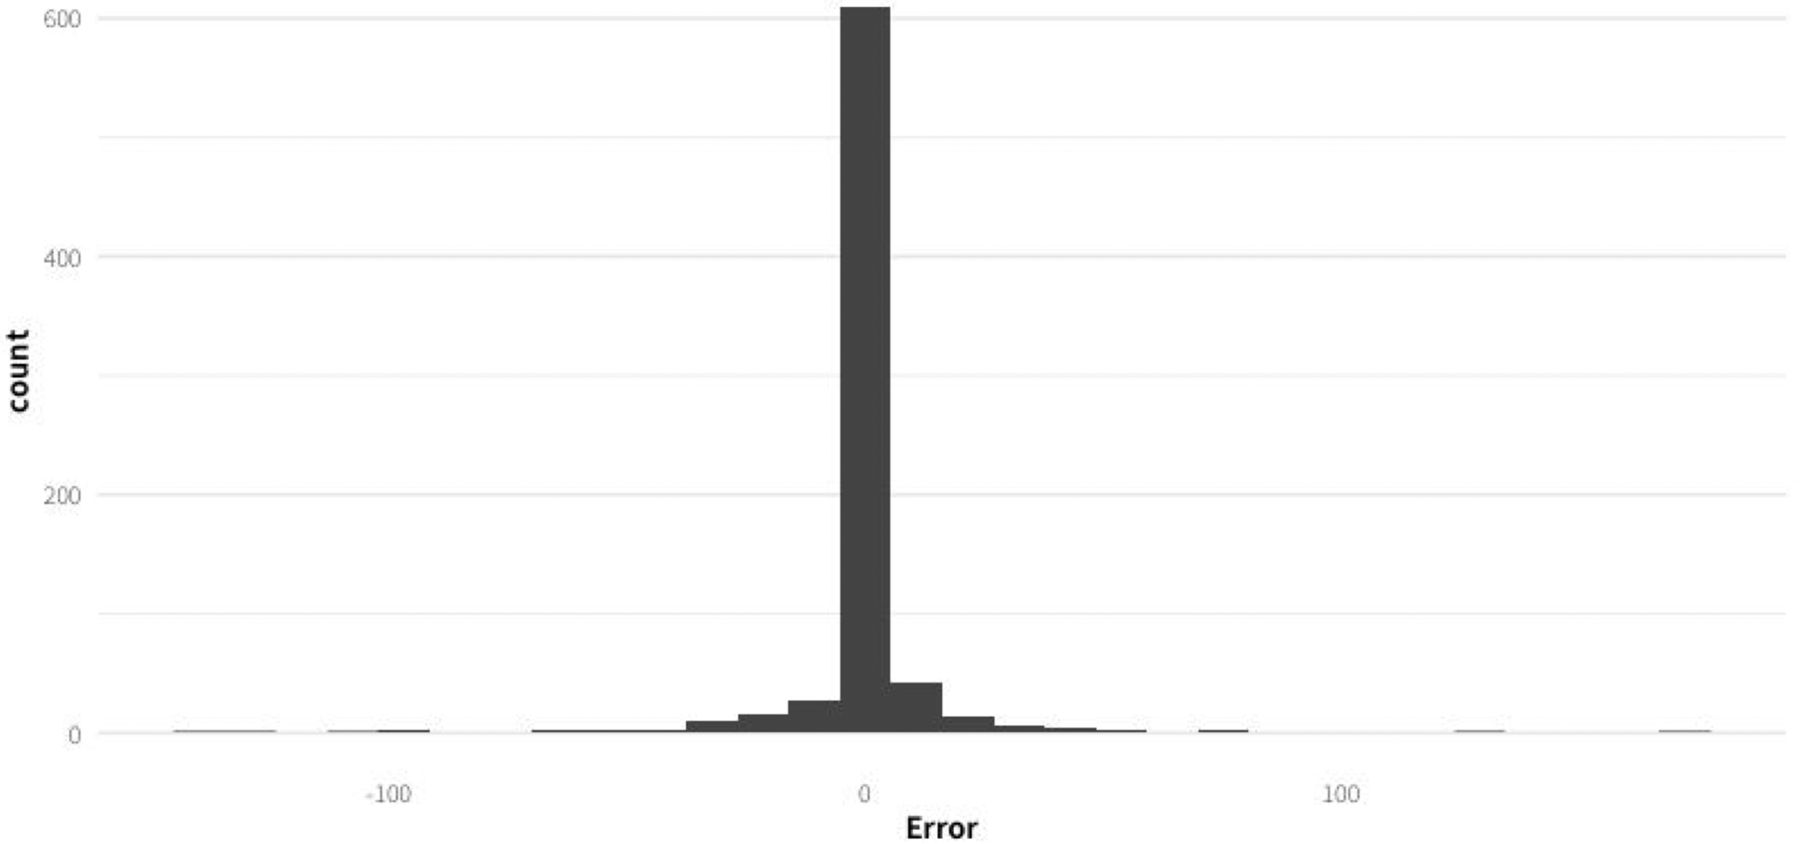
To evaluate this possibility, a second random forest regressor model (Model_2), which was trained on all four historical hypoxic fed-batches (SH-2, SH-3, MH-1, and MH-2), was built and evaluated. The same criteria for the inclusion of the data points were used considering them to be in the ideal regime. However, this time the dataset was evaluated on 25% of the data points that were randomly selected from all four fed-batches, whereas the remaining 75% of the data points were used for training the model. With this evaluation approach, the error of the model on the test set was much lower than for Model_1 (mean absolute error = 5.6 rpm), and the distribution showed no bias (mean error = −0.2 rpm) as can be observed in Figure 7.

Distribution of the error from Model_2 evaluated on the unseen data (randomly sampled data points from all four historical fed-batch datasets).
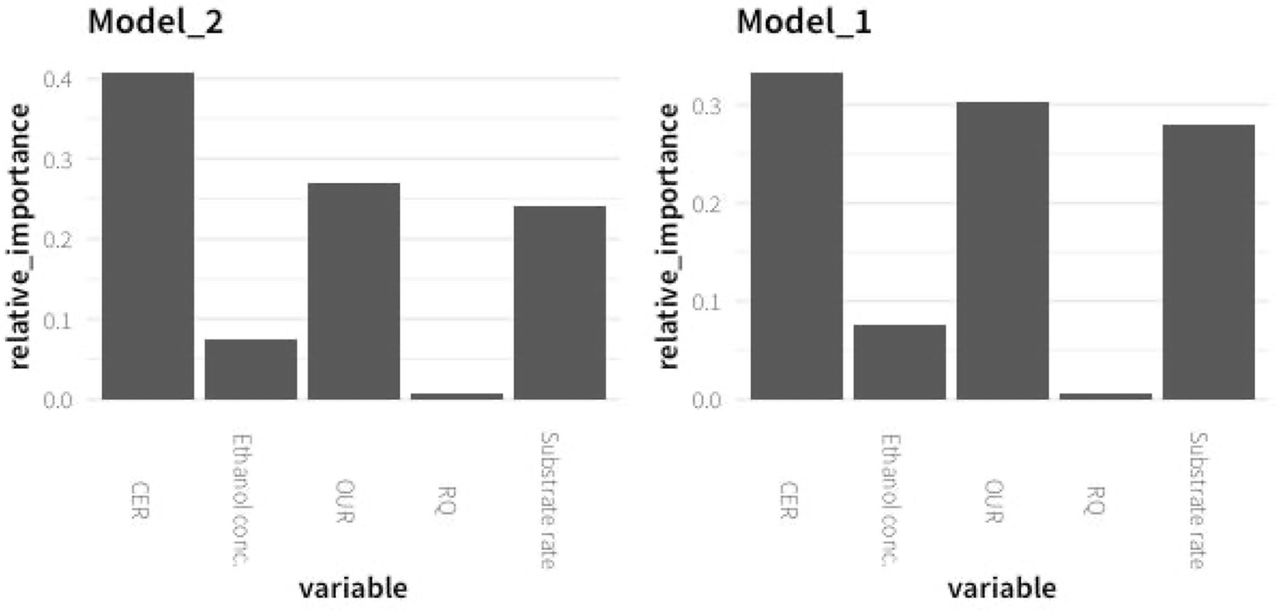
To understand how the model makes predictions and what features contribute to its performance, the relative importances of each independent variable used in the training of both models were analyzed. The importance of a feature (variable) is defined as the sum over the number of splits (across all trees in the constructed random forest model) that include the feature, normalized by the number of samples it splits. As expected, the highest importances were found for CER, OUR, and substrate feeding rate, because these three variables correlate very well with stirring rate due to the relation among oxygen transfer rate (OTR), governed by the stirring rate, and the other variables concerned with cell activity. In contrast, the RQ, which fluctuates around a rather constant value during the bioprocess, contributes almost nothing to the prediction of the model, which is expected for small fluctuations without a trend. Additionally, it is important to bear in mind that the RQ is directly related to CER and OUR, because it is calculated as the quotient between them. The ethanol concentration showed a moderate relative importance. Because it is an indicator parameter of the cell metabolism, it is expected that a higher increase is produced when a higher limited oxygen transfer rate is applied and consequently higher hypoxic conditions are implemented. The ethanol concentration is the variable that fluctuates the most between fed-batches, highly contributing to the systematic bias on the model prediction (Figure 8).

Relative importance of the critical variables selected in the Random forest regressor models, Model_1 and Model_2.
Real-Time Prediction and Implementation of the Stirring Rate:
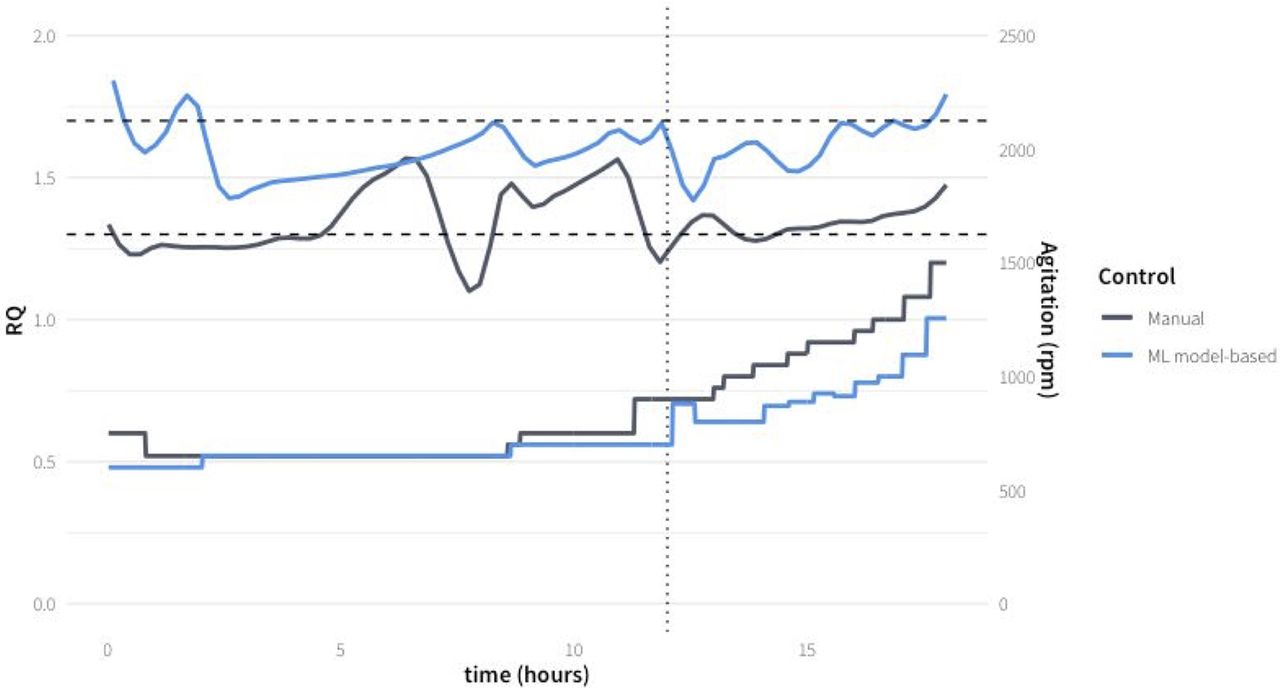
Finally, to drive the prediction stirring rate in real time, Model_1 was evaluated in real time to control the bioprocess. The prediction of the required stirring rate using the model every 30 min during a 6 h time window of late fed-batch (phase 4) was implemented in the validation process MH-3-V. The last 6 h of the fed-batch were controlled by the model, because in this latter phase the control is most demanding, because the changes on RQ are more important due to the high biomass concentration present in the culture broth, and the changes on stirring rate are more frequent according to the faster dynamics of the bioprocess. Using the stirring rate predicted by the model, the RQ was successfully kept within the desired operation range (Figure 9). Bioprocess efficiency in terms of specific production rate of Crl1 was similar to that obtained with heuristic controlled fed-batches (Table III). This result demonstrates that the developed AI ML-based modeling strategy can be satisfactorily applied to the prediction of operating conditions such as stirring rate in a bioreactor to maximize the bioprocess efficiency through the application of physiological control.

AI-Model prediction of stirring rate to maintain RQ in a mean set point of 1.5 in the validation fed-batch process MH-3-V (gray) compared with a heuristic control MH-2 (blue).
Comparison between Heuristic Controlled Fed-Batches and AI ML Model Validation Fed-Batch
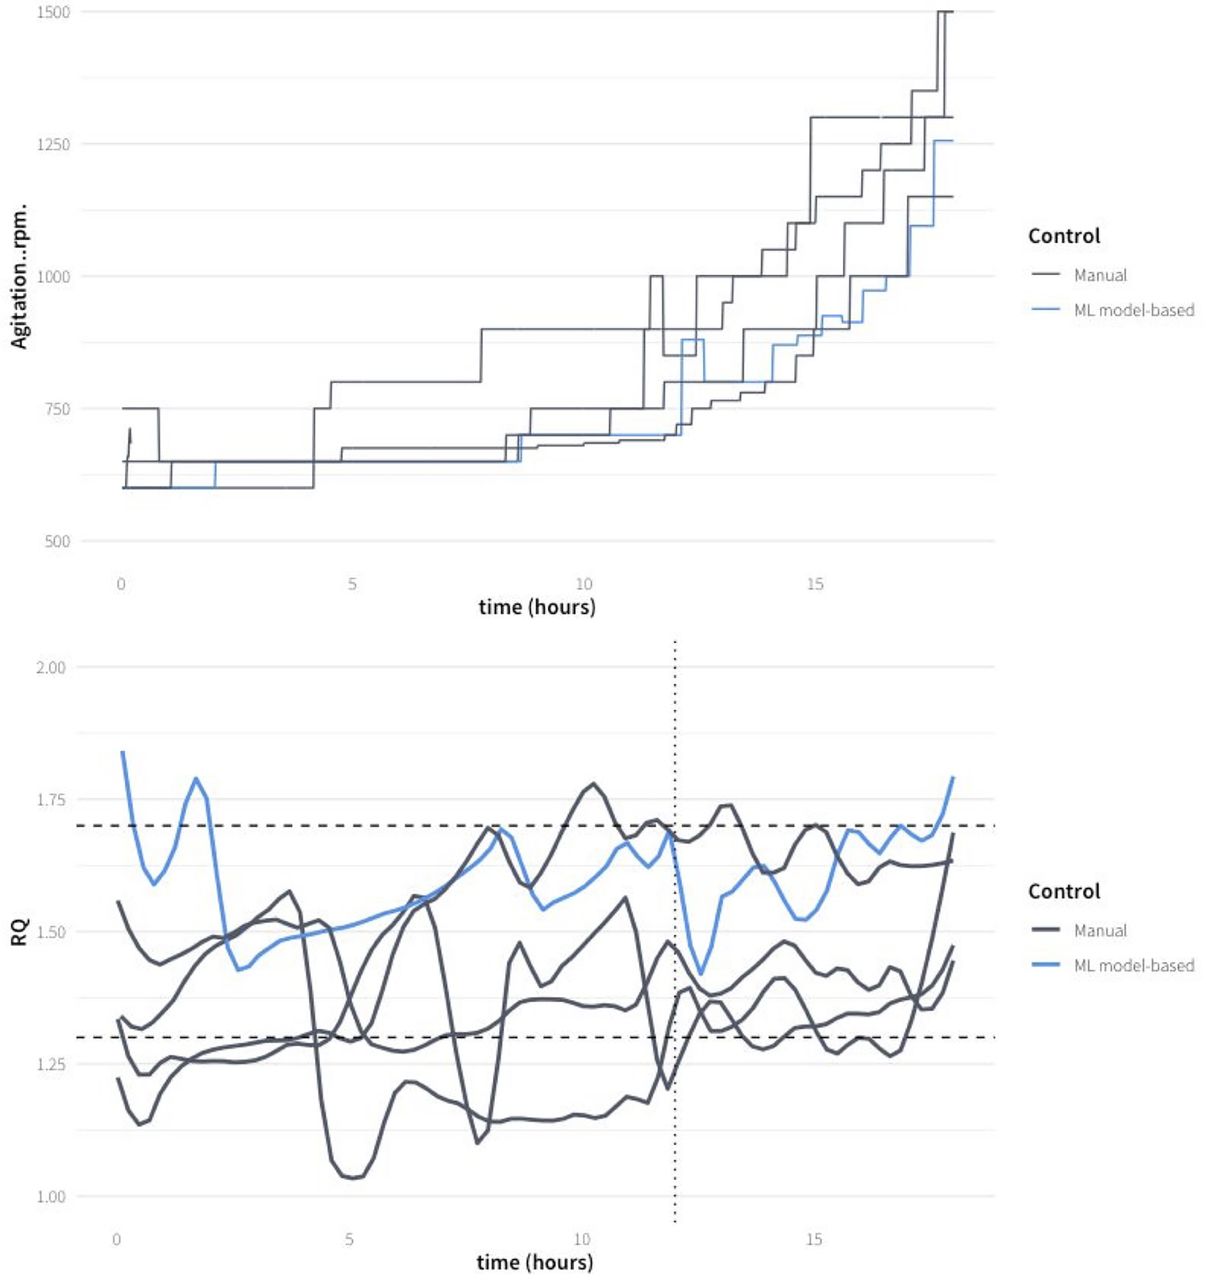
In Figure 10, the evolution of RQ for all hypoxic fed-batch experiments and the stirring rates predicted with the AI-ML are compared with the ones carried out following heuristic rules. The four manually controlled fed-batch fermentations varied significantly around the RQ set point of 1.5, although in all the fed-batches the RQ was mostly kept within the interval 1.3–1.7. However, in MH-3-V, the validation experiment, the fluctuations of the RQ were lower, within the interval between 1.5 and 1.7, normally working at RQ not lower than 1.5. In fact, the trend seems to be slightly above the set point. The predicted stirring rates are lower than those applied in most heuristic-guided experiments. Thus, the AI-ML strategy can be considered more efficient while keeping the RQ within the optimal interval.

Results comparison achieved with the AI-ML model-strategy in fed-batch MH-3-V and the four heuristic-guided fed-batches. The top graph represents stirring rate (actuation variable), the bottom graph represents RQ (controlled variable). The dashed lines represent the selected range of RQ values. The AI-ML model-based prediction of the stirring rate was implemented from 12 h after the beginning of the fed-batch (dotted line). LOESS smoothing, span = 0.1, was used for the RQ plot.
Conclusions
The industry in general has identified a great value in the adoption of the technology provided by the Fourth Revolution (50). The digitization, big data, and computing power considered as a trigger of the last industrial revolution brings process insights, reliable control, and operation improvement. The use of Internet of Things (IoT), cloud computing, big data technologies, and AI has accelerated the mechanisms to orchestrate the huge amount of data generated in the supply chain. The transformation of data into information and finally into knowledge is the pinnacle of the digitization journey.
The level of control and process understanding needed to deploy a CPV strategy around the biotech process requires a high maturity of digitization, and the techniques described in this article support this assumption. The final goal of a total CPV implementation is to keep the full process under control with the ability of near real-time interaction with the system. A first approach to this vision has been deployed in this work, consolidating these ideas and establishing the foundation for a broad scope in which a full control would drive the bioprocess using adaptive mechanisms provided by AI. It is important to highlight that the AI strategy proposed in this research is not replacing the classical univariate or multivariate statistical process control tools used in CPV. The implementation of AI techniques is useful to complement the existing and validated methods already in place. Actually, the mechanisms described in the study explore better process control in combination with existing mathematical models.
The complexity inherent to biological systems makes it difficult to manage and control upstream processes from a pure analytical perspective and even more so when manual actions are required to keep the process under control. Although the critical process parameters and the expected quality attributes are well-known by the subject matter experts, the cell metabolism could react unexpectedly in light of unknown factors or as a consequence of the complex combination of variables that are governing the bioreaction.
The experimental process described in this article has shown that AI works successfully as a modeling mechanism to detect anomalies in highly automated processes. Thus, these results demonstrate that even with scarce data, the IFA can be used as an analytical tool to reliably detect anomalous batches in near real time.
Additionally, an AI/ML modeling strategy based on random forest regressor models has been shown to be a useful tool in the bioprocessing area, especially in multivariate systems requiring feedback in near real time. In this work, this approach has been successfully applied to the prediction of the stirring rate to maintain the RQ set point, maximizing the specific production rate of a heterologous protein with the P. pastoris cell factory.
This study is related to the first phase of a broad initiative led by the PDA where the final purpose is to empirically demonstrate the effectiveness of the application of digital twins in upstream biomanufacturing operations for drug manufacturing. Digital twin can be defined as a cyber copy of a physical system that is replicated by a virtual system that interacts with the rest of the elements in a similar way as the real object does. AI is the mechanism that orchestrates the digital twin, preventing issues and proposing optimal conditions. Under a biopharma perspective, the regulatory approach is required, and this article is part of the preliminary approach that will be developed in a second phase, including the compliant vision.
Conflict of Interest Declaration
The authors have no conflicts of interest to declare.
Acknowledgments
This work was funded by the Spanish Ministry of Science and Innovation (Project PID2019-104666GB-100) and the Product Quality Research Institute (PQRI). The authors are members of the group Continued Process Verification of the Future of the Parenteral Drug Association (PDA). AGF acknowledges the award of a scholarship (FI-DGR 2019 from Generalitat de Catalunya).
APPENDIX
The Table of Issues and Mitigation Plans Identified during the Risk Assessment
Footnotes
↵# Andrej Ondracka and Arnau Gasset contributed equally
- © PDA, Inc. 2023


