
Main menu

  • Home
  • Content
    • Current Issue
    • Past Issues
    • Accepted Articles
    • Email Alerts
    • RSS
    • Terms of Use
  • About PDA JPST
    • JPST Editors and Editorial Board
    • About/Vision/Mission
    • Paper of the Year
  • Author & Reviewer Resources
    • Author Resources / Submit
    • Reviewer Resources
  • JPST Access and Subscriptions
    • PDA Members
    • Institutional Subscriptions
    • Nonmember Access
  • Support
    • Join PDA
    • Contact
    • Feedback
    • Advertising
    • CiteTrack
  • .
    • Visit PDA
    • PDA Letter
    • Technical Reports
    • news uPDATe
    • Bookstore

User menu

  • Register
  • Subscribe
  • My alerts
  • Log in
  • My Cart

Search

  • Advanced search
PDA Journal of Pharmaceutical Science and Technology
  • .
    • Visit PDA
    • PDA Letter
    • Technical Reports
    • news uPDATe
    • Bookstore
  • Register
  • Subscribe
  • My alerts
  • Log in
  • My Cart
PDA Journal of Pharmaceutical Science and Technology

Advanced Search

  • Home
  • Content
    • Current Issue
    • Past Issues
    • Accepted Articles
    • Email Alerts
    • RSS
    • Terms of Use
  • About PDA JPST
    • JPST Editors and Editorial Board
    • About/Vision/Mission
    • Paper of the Year
  • Author & Reviewer Resources
    • Author Resources / Submit
    • Reviewer Resources
  • JPST Access and Subscriptions
    • PDA Members
    • Institutional Subscriptions
    • Nonmember Access
  • Support
    • Join PDA
    • Contact
    • Feedback
    • Advertising
    • CiteTrack
  • Follow pda on Twitter
  • Visit PDA on LinkedIn
  • Visit pda on Facebook
Article CommentaryCommentary

An Analytical Strategy Based on Multiple Complementary and Orthogonal Chromatographic and Detection Methods (Multidetector Approach) to Effectively Manage the Analytical Evaluation Threshold (AET)

Mark Jordi and Ted Heise
PDA Journal of Pharmaceutical Science and Technology May 2021, 75 (3) 289-301; DOI: https://doi.org/10.5731/pdajpst.2020.012047
Mark Jordi
1Jordi Labs, Mansfield, MA; and
  • Find this author on Google Scholar
  • Find this author on PubMed
  • Search for this author on this site
  • For correspondence: mjordi@jordilabs.com
Ted Heise
2MED Institute Inc., West Lafayette, IN
  • Find this author on Google Scholar
  • Find this author on PubMed
  • Search for this author on this site
  • Article
  • Figures & Data
  • References
  • Info & Metrics
  • PDF
Loading

Article Figures & Data

Figures

  • Tables
  • Figure 1
    • Download figure
    • Open in new tab
    • Download powerpoint
    Figure 1

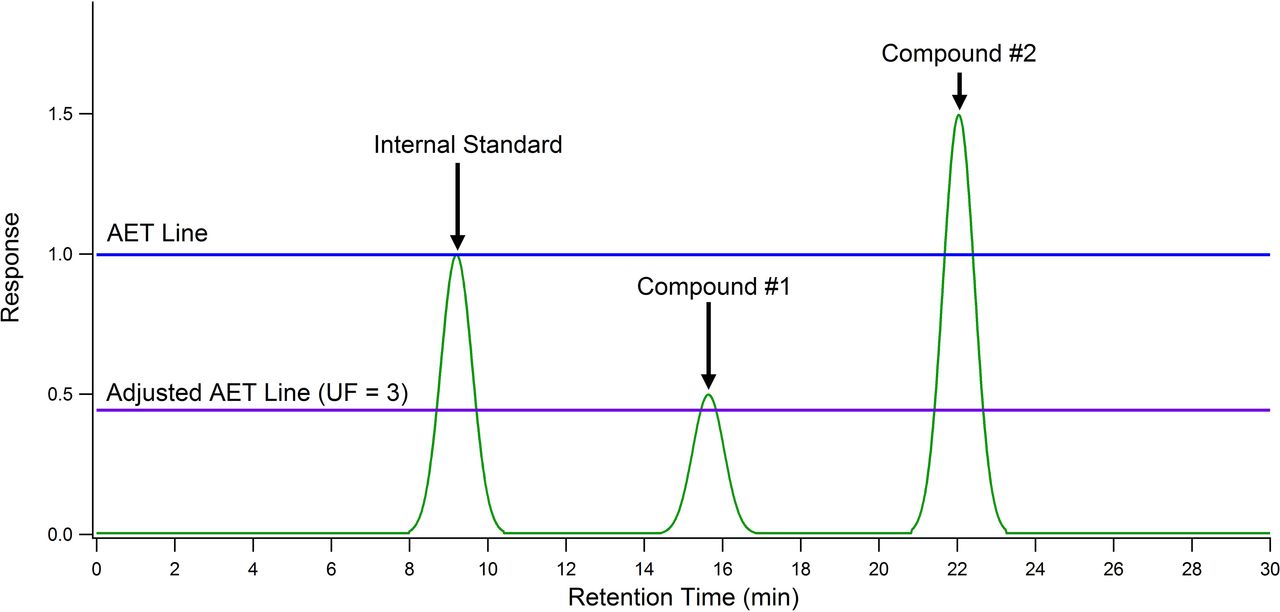
    Analytical evaluation threshold (AET): pictorial representation of the AET. An internal standard has been added to the extract at a concentration equal to the AET. When the extract is analyzed, a line at the apex of the internal standard peak is drawn horizontally across the chromatogram. Peaks whose responses are above the line must be reported for toxicological risk assessment. Peaks whose responses are below the line need not be reported for toxicological risk assessment, as they are deemed to have a negligible adverse effect on patient safety. Application of the AET in this manner is based on the assumption that the internal standard and the analytes have the same response factor. Assuming all three compounds are at an equal concentration (AET concentration), an “AET gap” is caused by differing response factors. This gap is corrected by using an uncertainty factor that takes into account response variation between analytes and internal standards. This has the effect of moving the AET line lower in the chromatogram and results in compound #1 being successfully “captured” by the AET assessment.

  • Figure 2
    • Download figure
    • Open in new tab
    • Download powerpoint
    Figure 2

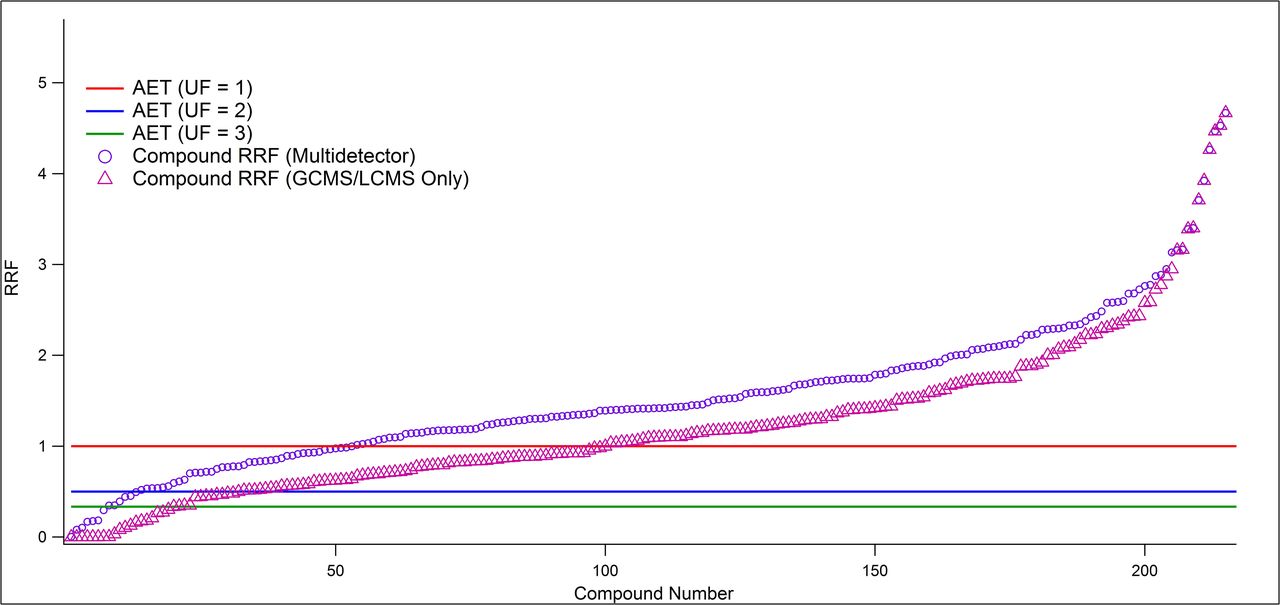
    Compound response (relative response factor or RRF) versus analytical evaluation threshold (AET) for different detector configurations. The multidetector approach for mitigating nonreporting. The plot shows the maximum RRF values for liquid chromatography mass spectrometry (LCMS) and gas chromatography mass spectrometry (GCMS) only (triangles) or the maximum RRF value for the multidetector approach (LCMS–ultraviolet-visible detector–charged aerosol detector [LCMS-UV-CAD] and GCMS–flame ionization detection [GCMS-FID]) shown as circles. Normalized RRF values for each compound are presented such that an RRF > 1 indicates a compound would be assessed as above AET at uncertainty factor (UF) = 1 using an internal standard of an average response. As more detectors are added to the analytical strategy, the analytical strategy becomes more protective in terms of ensuring that compounds at a level above the AET are flagged. The location of the AET threshold for a UF of 2 or 3 is also indicated.

Tables

  • Figures
    • View popup
    TABLE I

    Statistical Analysis of a Database of Response Factors

    ItemValue per Detection Methoda
    MS, + IonMS, − IonUV, 230 nmCADGCMSFID
    nb15673113122129129
    Mean1.0c1.0c1.0c1.0c1.0c1.0c
    Standard Deviation1.11.20.600.650.520.54
    % RSD108%119%60%65%52%54%
    • ↵a The detection methods were as follows: MS, + is mass spectrometry, positive ion mode; MS, − is mass spectrometry, negative ion mode; UV is ultraviolet-visible detector; CAD is charged aerosol detector; GCMS is gas chromatography mass spectrometry; and FID is flame ionization detection.

    • ↵b The total number of analytes investigated in this study (10) was 217. Mutliple analytes produced no response in one or more of the detection methods.

    • ↵c The response factors for the individual analytes were divided by the mean response factor for the entire database, thus producing a mean of 1.0.

    • View popup
    TABLE II

    Relative Response Factor (RRF) Values for Five Organic Extractables

    Name of Example Extractable CompoundsMolecular FormulaCAS NumberRRF LCMS PosaRRF LCMS NegRRF UV 230 nmRRF CADRRF GCMSRRF FID
    Bis(2-ethylhexyl)phthalateC24H38O4117-81-71.92NDb0.6220.8021.711.86
    Dibenzyl phosphateC14H15O4P1623-08-10.1342.27ND1.41NDND
    1,3,5-TriphenylbenzeneC24H18612-71-5NDND1.940.813NDND
    4-SulfamoylbenzoicacidC7H7NO4S138-41-0ND0.3482.300.888NDND
    5-Amino-1-pentanolC5H13NO2508-29-40.126NDND2.600.0950.663
    • ↵a Note: LCMS Pos is liquid chromatography-mass spectrometry, positive ion mode; LCMS Neg is liquid chromatography-mass spectrometry, negative ion mode; UV is ultraviolet-visible detector; CAD is charged aerosol detector; GCMS is gas chromatography-mass spectrometry; and FID is flame ionization detection.

    • ↵b ND is Not detected.

    • View popup
    Table III

    Percentage of Compounds Correctly Reported as at or above the Analytical Evaluation Thresholda

    DetectorUF = 1UF = 2UF = 3UF = 4
    GCMSGCMS-FIDGCMSGCMS-FIDGCMSGCMS-FIDGCMSGCMS-FID
    LCMS54%63%85%86%91%92%93%93%
    LCMS-UV63%70%90%91%95%95%95%96%
    LCMS-CAD62%71%90%91%95%95%96%96%
    LCMS-UV-CAD69%75%93%94%97%97%97%97%
    • ↵a Abbreviations: UF is uncertainty factor; GCMS is gas chromatography-mass spectrometry; FID is flame ionization detection; LCMS is liquid chromatography-mass spectrometry; UV is ultraviolet-visible detector; CAD is charged aerosol detector.

PreviousNext
Back to top

In This Issue

PDA Journal of Pharmaceutical Science and Technology: 75 (3)
PDA Journal of Pharmaceutical Science and Technology
Vol. 75, Issue 3
May/June 2021
  • Table of Contents
  • Index by Author
  • Complete Issue (PDF)
Print
Download PDF
Article Alerts
Sign In to Email Alerts with your Email Address
Email Article

Thank you for your interest in spreading the word on PDA Journal of Pharmaceutical Science and Technology.

NOTE: We only request your email address so that the person you are recommending the page to knows that you wanted them to see it, and that it is not junk mail. We do not capture any email address.

Enter multiple addresses on separate lines or separate them with commas.
An Analytical Strategy Based on Multiple Complementary and Orthogonal Chromatographic and Detection Methods (Multidetector Approach) to Effectively Manage the Analytical Evaluation Threshold (AET)
(Your Name) has sent you a message from PDA Journal of Pharmaceutical Science and Technology
(Your Name) thought you would like to see the PDA Journal of Pharmaceutical Science and Technology web site.
CAPTCHA
This question is for testing whether or not you are a human visitor and to prevent automated spam submissions.
1 + 11 =
Solve this simple math problem and enter the result. E.g. for 1+3, enter 4.
Citation Tools
An Analytical Strategy Based on Multiple Complementary and Orthogonal Chromatographic and Detection Methods (Multidetector Approach) to Effectively Manage the Analytical Evaluation Threshold (AET)
Mark Jordi, Ted Heise
PDA Journal of Pharmaceutical Science and Technology May 2021, 75 (3) 289-301; DOI: 10.5731/pdajpst.2020.012047

Citation Manager Formats

  • BibTeX
  • Bookends
  • EasyBib
  • EndNote (tagged)
  • EndNote 8 (xml)
  • Medlars
  • Mendeley
  • Papers
  • RefWorks Tagged
  • Ref Manager
  • RIS
  • Zotero
Share
An Analytical Strategy Based on Multiple Complementary and Orthogonal Chromatographic and Detection Methods (Multidetector Approach) to Effectively Manage the Analytical Evaluation Threshold (AET)
Mark Jordi, Ted Heise
PDA Journal of Pharmaceutical Science and Technology May 2021, 75 (3) 289-301; DOI: 10.5731/pdajpst.2020.012047
Twitter logo Facebook logo Mendeley logo
  • Tweet Widget
  • Facebook Like
  • Google Plus One

Jump to section

  • Article
    • Abstract
    • Introduction: The Analytical Evaluation Threshold
    • AET Evaluation Using Multiple Orthogonal and Complementary Separation and Detection Methods
    • Answers to Some Potential Critiques
    • Practical Considerations When Applying a Multidetector AET Approach
    • Conclusion
    • Conflict of Interest Declaration
    • References
  • Figures & Data
  • References
  • Info & Metrics
  • PDF

Related Articles

  • No related articles found.
  • PubMed
  • Google Scholar

Cited By...

  • No citing articles found.
  • Google Scholar

More in this TOC Section

  • A Risk Based Approach for Pre-Use/Post-Sterilization Integrity Test Simulation During Bacterial Retention Testing as Part of the Process Specific Filter Validation of Sterilizing Grade Filters
  • Challenges and Solutions to Manufacturing of Low-Viscosity, Ultra-High Concentration IgG1 Drug Products: From Late Downstream Process to Final Fill Finish Processing
  • Retrospective Evaluation of Cycled Resin in Viral Clearance Studies - A Multiple Company Collaboration - Post ICH Q5A(R2) Review
Show more Commentary

Similar Articles

Keywords

  • Extractables
  • Leachables
  • Analytical Evaluation Threshold
  • AET
  • Uncertainty Factor
  • Response factor variation
  • Multidetector approach

Readers

  • About
  • Table of Content Alerts/Other Alerts
  • Subscriptions
  • Terms of Use
  • Contact Editors

Author/Reviewer Information

  • Author Resources
  • Submit Manuscript
  • Reviewers
  • Contact Editors

Parenteral Drug Association, Inc.

  • About
  • Advertising/Sponsorships
  • Events
  • PDA Bookstore
  • Press Releases

© 2025 PDA Journal of Pharmaceutical Science and Technology Print ISSN: 1079-7440  Digital ISSN: 1948-2124

Powered by HighWire