
Abstract
Virus filtration has been demonstrated to be an effective and robust dedicated viral clearance step that is used in biopharmaceutical manufacturing processes. Here we present virus filtration data from a multicompany collaboration with data compiled from WuXi Advanced Therapies’ and Charles River Laboratories’ internal viral clearance databases spanning more than 25 years. The data were sorted by virus removal and type and then further subdivided into murine leukemia virus only, pseudorabies virus only, and reovirus type 3 only categories to allow for analyses of viral clearance results. A total of 2311 virus filtrations were analyzed, composed of 1516 murine leukemia virus, 385 pseudorabies virus, and 410 reovirus type 3 virus filtrations. These data provide clear evidence that will help supplement both internal and industry-wide initiatives focused on using prior knowledge for the creation of modular claims for small virus retentive filters and allow better allocations of resources typically spent on potentially unnecessary studies.
- Virus filtration
- Modular viral clearance
- Small virus retentive filter
- Large virus retentive filter
- Viral clearance
- Murine leukemia virus (MuLV)
- Reovirus (Reo-3)
- Pseudorabies virus (PrV)
Introduction
A viral control strategy is required for biopharmaceutical therapeutics manufactured using mammalian-derived cell substrates because of possible viral contaminants from endogenous or adventitious viruses (1). Guidelines for mitigations of these risks include cell line characterization testing, raw material controls, testing for virus in unprocessed bulk, and quantifying virus removal capabilities of the manufacturing process using scaled-down models of individual unit operations with model viruses. Although many unit operations have demonstrated the ability to remove or inactivate viruses, most biotherapeutic manufacturing processes include dedicated viral clearance steps such as low pH inactivation (2, 3), detergent inactivation (4), and/or virus filtration (5).
Virus filtration has been demonstrated to be an effective and robust dedicated viral clearance step (6) that is used in nearly all murine cell-derived biopharmaceutical manufacturing processes. The size-based removal mechanism of virus filtration is well understood (5, 7, 8), and validation of virus removal using only worst-case small model viruses has become more acceptable for both early- and late-stage regulatory filings (9). In this worst-case virus strategy, the log reduction values (LRVs) from parvovirus experiments are used as worst-case estimates for larger viruses, like murine leukemia virus (MuLV). The use of smaller viruses as a surrogate for larger viruses, however, bears the risk of reduced LRVs because of the potential breakthrough of smaller viruses, especially for earlier iterations of small virus or parvovirus retentive filters (8).
Modern small virus retentive filters are designed to provide more consistent and robust retention of small viruses such as murine minute virus (MMV) (6⇓–8, 10). The results are even more reliable for larger enveloped viruses, including MuLV, a retrovirus commonly used in small-scale viral clearance studies to model retrovirus-like particles (11⇓–13). Multicompany cross-industry analyses reported no detectable large enveloped virus in 198 experimental points (12), and data published from regulatory agencies showed no reported detection of retrovirus for infectivity-based assays (13).
Consistently reliable and effective removal of large enveloped viruses has led some companies to develop modular claim proposals for larger viruses (5) using small virus retentive filters. Modular claims, based on internal data, can allow biopharmaceutical manufacturers relief from early-phase clinical viral clearance testing requirements (14, 15). In fact, many regulatory agencies are amenable to parvovirus as worst case in filings with the European Medicines Agency (EMA) stating this clearly in a recent meeting report (9).
One difficulty in the implementation of modular claims has been the relative lack of published data within the biopharmaceutical industry. Although many companies have published their individual experiences with virus filtration, these reports are frequently based on and limited to their production platform (5, 16, 17). Although there has been at least one multicompany publication on the robustness of virus filtration (12), these data still represent only a small fraction of accumulated experience. Here, we expand the publicly available data for virus retentive filtration of larger viruses, spanning >25 years of viral clearance testing results from both the WuXi Advanced Therapies (WuXi) and Charles River Laboratory (CRL) databases. EMA regulators emphasized at a joint workshop with industry stakeholders that “….publication of ‘generalizable’ internal knowledge could be a way to increase transparency and scientifically validate the evolving knowledge to foster new or changes to existing guidelines” (9). These data provide clear evidence to help supplement both internal and cross-industry initiatives focused on the creation of modular claims, allowing better allocations of resources typically spent on potentially unnecessary studies.
Methods
The data evaluated in this study were collected from databases containing all viral clearance data for studies executed at WuXi as well as CRL over the course of >25 years from tens of thousands of entries. These databases are compilations of general study information collected during the execution of validation studies, including: viral clearance type (removal or inactivation), unit of operation, product type, virus type, method of detection (quantitative polymerase chain reaction [qPCR], median tissue culture infectious dose [TCID50], plaque assay), percent virus spike, and LRV. In some cases, information specific to a filtration study is collected as well, including: virus filter, volume processed, pH, conductivity, and operating temperature.
The information in these databases was initially pared down by filtering for the following: virus removal, virus filtration, and virus type (MuLV, reovirus type 3 [Reo-3], and pseudorabies virus [PrV]). The returned values were further subdivided into MuLV only, PrV only, and Reo-3 only categories so that analyses on the viral clearance results could be evaluated separately for each virus.
For each virus, the clearance results were collated by product type (monoclonal antibody [mAb] and nonmAb), operating temperature (ambient and cold), and type of virus assay performed (qPCR, plaque, TCID50). These results were further broken down into what timeframe the study fell within: pre-2000, 2001–2009, 2010–2014, and 2015 to present. A numeric count of results with no detectible virus was subdivided into results with LRVs of ≤3.0, >3.0, >4.0, >5.0, and >6.0 (Table I). Study results that showed detectable virus were subdivided into ≥4.0 LRV clearance and <4.0 LRV clearance. In addition, the Total Log of Virus Spiked was recorded (when available) by groupings of <6, 6–7, 7–8, 8–9, and >9. Once these groupings were completed by both WuXi and CRL, the data were combined. Subsequent analyses of the data generated are discussed in the Results/Discussion section of this paper.
Summary of Runs with No Detectable Virus across Time of Experiment Performancea
Results/Discussion
Collected data are summarized collectively and individually by virus type.
Overall Dataset
The overall dataset used for these analyses focused on large viruses ranging in size from 60–200 nm (all substantially larger than the nominal pore sizes of small virus retentive filters) including MuLV, PrV, and Reo-3. A total of 2311 virus filtration runs were analyzed and can be broken down into 1516 MuLV, 385 PrV, and 410 Reo-3 virus experiments. Each “run” refers to a single filtration experiment most often having a corresponding “replicate run” within the database. Although not every study captured the filter type, based on those which did report a filter type, the database consisted primarily of small virus retentive filter data and is known to contain clearance results from filtrations with these filters (in no particular order) Millipore NFP, Millipore Viresolve Pro, Millipore Viresolve 180, Millipore Viresolve NFP, Pall SV4, Pall Pegasus Prime, Pall DV20, Pall DV50, Planova 20 N, Planova 15 N, Planova BioEX, Sartorius Virosart HC, Sartorius Virosart HF, and Sartorius CPV. Approximately three-quarters of the virus filtrations in the database were for antibodies, whereas the remainder were simply classified as nonantibody. For experiments in which test article conditions were available, the conductivity range was 0.6– 140 mS/cm, pH range was 4.5–9.0, and the load concentration range was 0.15–24.0 g/L.
Results were first separated into nondetectable and detectable virus. The detectable virus results were further separated into “detectable and ≥4.0 LRV” clearance, “detectable and <4.0 LRV”, and “detectable and <4.0 LRV and replicated” (Table II). A "nondetectable" result is a run demonstrating removal to below the assay limit of detection; a "detectable and ≥4.0 LRV" result is a run demonstrating quantifiable virus with a LRV at or above 4.0; a "detectable and <4.0 LRV" result is a run demonstrating quantifiable virus with a LRV below 4.0; and a "detectable and < 4.0 and replicated" result is a run demonstrating quantifiable virus with a LRV below 4.0 and has a replicate run demonstrating the same. Results were separated into ≥ 4.0 and < 4.0 LRV as this is a common cutoff for robust and nonrobust clearance.
MuLV, PrV, and Reo-3 Virus Filtration Database Summary of Runs Evaluateda
MuLV Data Summary
The bulk of existing data presented are for MuLV, a commonly used retrovirus model (Table II, Figure 1). This is because of the requirement to provide a calculated safety margin for retroviruses for both early- and late-stage filings with only those projects advancing to marketing applications requiring additional large viruses.

Total filtration runs for MuLV. (A) Total runs studied (orange) with number of runs with detectable virus (blue); (B) Overview of runs with detectable virus broken down into two bars: ≥4.0 LRV and ≥4.0 LRV clearance. The ≥4.0 bar is further subdivided into Replicate with No Detectable Virus (blue) and Replicate with No Detectable Virus tested by qPCR assay (orange). The <4.0 bar is subdivided into Replicate with No Detectable Virus (blue), qPCR Assay (orange), and Undetermined (gray). LRV = log reduction value; MuLV = murine leukemia virus; qPCR = quantitative polymerase chain reaction.
The total number of runs for MuLV was 1516 with only a small subset, 28 runs, demonstrating detectable virus in the filtrate (Table II and Figure 1A). Out of the 28 runs with detectable virus, 13 demonstrated detectable virus and < 4.0 LRV clearance (Figure 1B), and 15 demonstrated detectable virus and ≥ 4.0 LRV clearance (Figure 1B). With the expectation that all large viruses would be cleared effectively (LRV ≥ 4.0 log10), the runs demonstrating detectable virus and < 4.0 LRV clearance were further investigated. Upon closer analyses, 5 out of the 13 runs had corresponding replicates that demonstrated clearance to below the assay detection limit, indicating those quantifiable results were not reproducible. The remaining 8 runs (4 replicate pairs) were from validation studies for which replicates agreed (Table II). After further investigation to determine the underlying cause of these unexpected results, 2 runs (1 replicate pair) used qPCR for viral quantitation and may have detected viral nucleic acid not infectious intact virus. The other 6 runs (3 replicate pairs) had no discernible explanation (Table III). The 15 runs with detectable virus and ≥4.0 LRV clearance results all had corresponding replicates with no detectable virus, indicating that even these quantifiable results of ≥4.0 LRV were not reproducible. Six of these runs with detectable virus and ≥4.0 LRV clearance results were tested by qPCR.
MuLV, PrV, and Reo-3: Detectable and <4.0 LRV and Replicated Parameters Summarya
PrV Data Summary
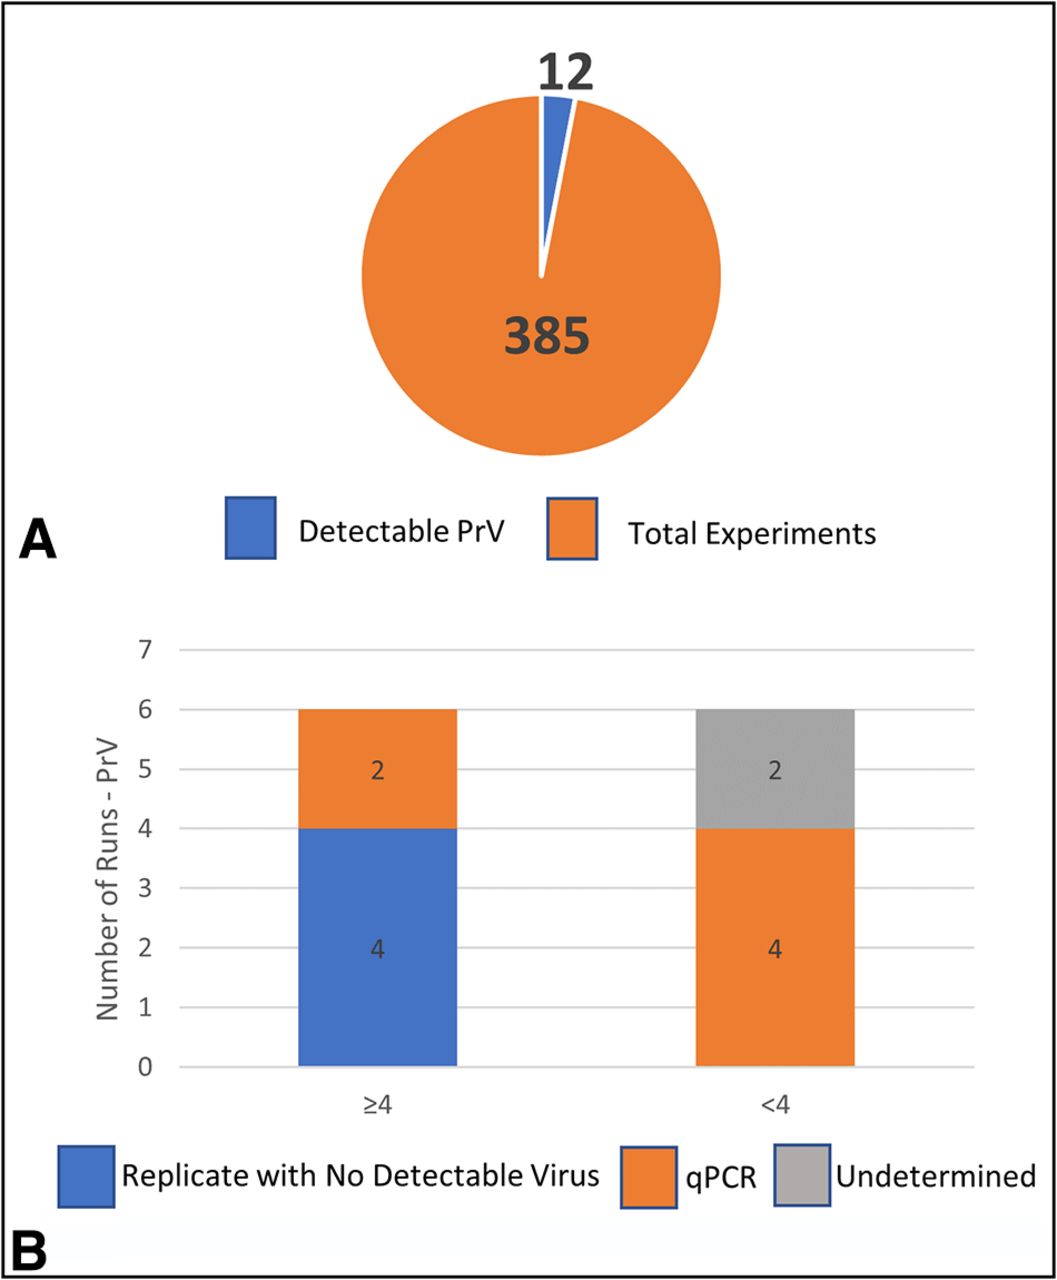
The total number of runs for PrV was 385 with only 12 demonstrating detectable virus in the filtrate (Table II and Figure 2A). Out of the 12 runs with detectable virus, 6 demonstrated detectable virus and <4.0 clearance and 6 demonstrated detectable virus and ≥4.0 LRV clearance (Figure 2B). Of the 6 runs with detectable virus and <4.0 clearance, all had replicates from a validation study that were in agreement (Table II). After further investigation, it was determined that 4 of these 6 runs used qPCR for viral quantitation and may have detected viral nucleic acid not infectious intact virus. The other 2 runs (1 replicate pair) had no discernable explanation (Table III). The 6 runs with detectable virus and ≥4.0 LRV clearance all had corresponding replicates with no detectable virus, indicating those quantifiable results were not reproducible. Two of these runs with detectable virus and ≥4.0 LRV clearance results were tested by qPCR.

Total filtration runs for PrV. (A) Total runs studied (orange) with number of runs with detectable virus (blue); (B) Overview of runs with detectable virus broken down into two bars: ≥4.0 LRV and <4.0 LRV clearance. The ≥4.0 bar is further subdivided into Replicate with No Detectable Virus (blue) and Replicate with No Detectable Virus tested by qPCR assay (orange). The <4.0 bar is subdivided into qPCR assay (orange) and Undetermined (gray). LRV = log reduction value; PrV = pseudorabies virus; qPCR = quantitative polymerase chain reaction.
Reo-3 Data Summary
The total number of runs for Reo-3 was 410 with only 22 demonstrating detectable virus in the filtrate (Table II and Figure 3A). Out of the 22 runs with detectable virus, 20 demonstrated detectable virus and ≥4.0 LRV clearance (Figures 3B) and 2 runs demonstrated detectable virus and <4.0 LRV clearance. Upon closer analysis, the 22 runs with detectable virus all had corresponding replicates with no detectable virus, indicating those quantifiable results were not reproducible. Two of these runs with detectable virus and ≥4.0 LRV clearance results were tested by qPCR.

Total filtration runs for Reo-3. (A) Total runs studied (orange) with number of runs with detectable virus (blue); (B) Overview of runs with detectable virus broken down into two bars ≥4.0 LRV and <4.0 LRV clearance. The ≥4.0 bar is further subdivided into Replicate with No Detectable Virus (blue) and Replicate with No Detectable Virus tested by qPCR assay (orange). The <4.0 bar shows Replicate with No Detectable Virus (blue). LRV = log reduction value; Reo-3 = reovirus type 3; qPCR = quantitative polymerase chain reaction.
Overall Data Summary
Overall, the analyses of a virus filtration database consisting of 2311 individual runs demonstrated 62 instances of detectable virus in the filtrate (Table II and Figure 4A). Out of the 62 runs with detectable virus, 21 demonstrated detectable virus and <4.0 LRV clearance (Figure 4B). Of these 21 runs, 7 had replicates with no detectable virus, indicating those quantifiable results were not reproducible. Only 14 runs were reproducible as they were represented by 7 replicate pairs (Figure 4B). Of the 14 runs with detectable virus and <4.0 LRV clearance, 6 of these runs used qPCR to quantitate virus levels in filtrate.

Total filtration runs for MuLV, PrV, and Reo-3. (A) Total runs studied (orange) with number of runs with detectable virus (blue); (B) Overview of runs with detectable virus broken down into two bars ≥4.0 LRV and <4.0 LRV clearance. The ≥4.0 bar is further subdivided into Replicate with No Detectable Virus (blue) and Replicate with No Detectable Virus tested by qPCR assay (blue dots). The <4.0 bar is subdivided into Replicate with No Detectable Virus (blue), qPCR Assay (orange), and Undetermined (gray). LRV = log reduction value; MuLV = murine leukemia virus; PrV = pseudorabies virus; Reo-3 = reovirus type 3; qPCR = quantitative polymerase chain reaction.
Several possibilities were considered for why detectable virus may have been observed during filtration through pore sizes that are substantially smaller than the viruses tested. Experiment attributes such as filter type (small or large virus retentive filter), type of recombinant product (mAb, novel protein, and so forth), assay type, viral load, volumetric throughput, and chemical attributes such as pH and conductivity were evaluated for correlation with detection and no obvious explanations were found.
Assay types were also evaluated to ensure that detection of virus in the filter flow through was in fact because of transmission of an infectious virus particle. Real-time PCR is not a reliable method for quantitating infectious intact viral particles because it is not able to differentiate between residual naked viral RNA or DNA in the viral spike preparation and viral genomes from intact viral particles. Nearly half of the studies with reproducible detectable virus utilized PCR, whereas <2% of runs in the overall data set utilized PCR. Another explanation considered was large-volume testing and the increased sensitivity and probability of detecting infectious virus when testing a larger sample volume. However, because of the small number of samples with detectable virus, no additional conclusions could be drawn.
With highly sensitive infectivity assays, there exists the possibility of user errors introducing virus into the filtrate collection vessel. A splash or drop of virus-spiked load material could easily contaminate the collection vessel or vessels in an experiment. Although root cause investigations are performed if discrepant results are found, some issues that are not easily identifiable can occur. A recent example of this was found in a study in which a slow leak developed in the pressurized vessel holding the virus-spiked load, which dripped onto the surface below. Although the leak was not directly above the collection vessel, the filtrate was found to have quantifiable virus, whereas the replicate and a subsequent repeat filtration demonstrated virus removal to below the limit of detection. Errors such as the one described here can impact both replicates as duplicate runs are often carried out simultaneously in the same biological safety cabinet. Finally, when filter integrity tests are performed with small-scale filters, qualitative air diffusion tests are often employed. These types of integrity tests rely on a visual assessment for bubbles exiting the outlet of the filter and still may not detect virus-sized defects in the filter, although this currently remains unproven.
Conclusions
Small virus retentive filters were clearly shown to be effective across a wide range of parameters and material attributes, showing at least 4.0 logs of removal or removal to below the assay limit of detection in almost every instance, 2297 out of 2311 (99.4%) of these experiments analyzed. Process parameter and material attribute ranges analyzed included load concentration (0.15–24.0 g/L), load pH (4.5–9.0), load conductivity (0.6–140 mS/cm), load volume (>1000 L/m2), experimental temperature, pressure fluctuation, and filter flux decay or complete fouling. In the small number of runs with detectable virus and an associated replicate, no obvious relationship existed between any parameter or material attribute and detectable virus. However, virus assay type stood out when comparing the 14 instances of confirmed large virus detection to the overall dataset. In these 14 instances, 6 used qPCR assays, leaving only 8 instances out of 2311 experiments (0.35%) in which large virus was detected in the filtrate in replicate runs.
Overall, these data are in alignment with previously published large virus LRV data (12, 13) that showed no detectable large virus measured in the filtrate of small virus retentive filters. Some small virus retentive filters may be more prone to parvovirus breakthrough and are more susceptible to the impact of low process pressure and/or process pauses on virus removal (18). However, in studies in which both large and small viruses were co-spiked, large viruses did not break through even when small viruses were detected in the filtrate (5).
Likely causes of detectable virus have been identified here as the use of qPCR as a detection assay and splashes or aerosolization of virus-spiked load materials. Other potential causes may include operator error, calculation error, exclusion of “<” in reported LRV, the large time scale evaluated within this review, and potential use of nonintegral lab scale filters. Detectable virus is very unlikely to be because of technical failures of these small virus retentive filters (12, 13) because from a physical standpoint, large viruses cannot pass through integral small virus retentive filters. Detectable virus in the filtrate should only happen in experiments in which the events listed previously or similar events have occurred. The data reviewed here along with previously published data clearly show small virus retentive filters consistently, effectively, and robustly remove large viruses, making small virus retentive filtration an ideal unit operation for modular claim(s).
The justifiable LRV for modular claims from studies in which virus is almost always undetectable is not an obvious value to quantify (2). When virus is undetectable, LRV estimates are completely dependent on viral spike titer, load volume, and assay sensitivity. These estimates are not dependent on any small virus filter retention limitation and are always equivalent to or underestimates of the actual LRV. A U.S. Food and Drug Administration review showed large virus retentive filters (8) (having pore sizes larger than small virus retentive filters) reliably clear >5 log10 of MuLV (13). Matilla et al. (12) showed an average clearance 5.86 LRV ± 0.91 for retrovirus with small virus retentive filters. Stuckey et al. (5) suggested that the highest estimated LRV from a dataset with all undetectable LRV results could be used as a modular LRV claim. Although we agree with the approach proposed by Stuckey et al., that set of data was derived from one filter type within one pharmaceutical company. For a broader claim across multiple filter types and pharmaceutical companies, a conservative value of 5.0 LRV can be justified. On the basis of the shared data, we propose a conservative modular claim of 5.0 LRV when using small virus retentive filters within recommended manufacturer operating ranges and in conjunction with passing pre and post use integrity tests for large viruses (MuLV, Reo-3, or PrV) for early-phase viral clearance studies.
Conflict of Interests
The authors are not aware of any conflicts of interest.
Acknowledgements
The authors would like to acknowledge Vitali Stanevich for his technical assistance and Dominick Vacante for his help and guidance, both from Janssen; Carolin Blank, Pia Heyermann, Stephanie Koelln, and Daniela Kreutz from Charles River for all of their help with the collection and verification of data; and Jim Bylund from WuXi Advanced Therapies for his guidance and review.
- © PDA, Inc. 2022


