
Abstract
During the distribution of temperature-sensitive products (cold chain distribution), unintentional exposure of typical glass drug vials to subzero (below 0 °C) temperatures introduces potential risks of glass vial breakage during freeze (as well as thaw) and potential destabilizing effects of any biologic or pharmaceutical contained within. Vial breakage during freezing not only leads to product loss, but also to potential safety/sterility issues. This paper focuses on the physical aspects of tested glass vials as well as thermodynamic behaviors observed (specifically supercooling) in liquid product. In this study, filled glass vials varying from 5 to 500 mL were subjected to specific temperature levels (−15, −10, and −6 °C) in controlled chambers. Thermocouples were used to record temperatures within various probed vials and the ambient temperature of the controlled chamber. Vials were visually inspected for cracks/fractures after every cycle of conditioning. Samples of the cracked and non-cracked vials were sent to a third party glass analysis laboratory for further observations. This study provides insight into the physical impact of exposing filled glass vials to subzero temperatures for short durations commonly observed during cold chain distribution.
- Subzero
- Freezing
- Supercooling
- Glass vial breakage
- Expansion during freezing
- Distribution
- Cold chain
- Thermal shock
Introduction
Scope
It is common knowledge that water freezes at 0 °C and that during phase change, water expands roughly 10% by volume. If a glass container cannot withstand the force of expansion, vial integrity failure (breakage) may occur. This failure in glass vials containing product is the main focus of this study.
During cold chain distribution of finished product (1–4), there are situations where product can be exposed to subzero (below 0 °C) conditions. Subzero exposure does not inherently make any product unfit for use, but it does pose unknown risk factors from a quality perspective. The purpose of this study is to evaluate risk(s) involved with subjecting finished product to subzero conditions.
The scope of this study was limited to the physical aspects of the glass vials and not the stability of the biologic product. The main points of study were the following: The first was the nature of supercooling (5) and how it would affect the freezing process of liquid product. The second was to investigate a concern with liquid expansion in vials (and the resulting internal stress), and the possibility of the formation of microfractures, or cracks that are too small to be caught using simple visual inspection methods, that may lead to a breach between the outside non-sterile environment and the inside sterile environment of the vial. A glass testing laboratory evaluated the rate and likelihood of microfracture occurrence.
Thermal Energy Quantification
In order to create a method of comparison, thermal treatment needs to be quantifiable. We will use Newton's Law of Cooling to obtain the measurement of degree hours (dh), detailed below.
Newton's Law of Cooling and the Heat Transfer Coefficient state the following:

where
Quickly rearranging the formula, we find that because h and A are constants within a particular vial size family, the total amount of energy transferred is dependent on the temperature difference multiplied by the elapsed time. This is demonstrated below.

In our experiments, we are measuring temperature difference from 0 °C (the assumed freezing point for all products tested) to the experimental temperature. This is represented by the variable ΔT. The time duration measured would be from the start to finish of subzero temperature exposure. This would be represented by the variable Δt. Because we are dealing with environmental chambers, temperature is kept constant, regardless of how much energy (ΔQ measured in J) has been transferred. The units used to measure thermal energy transfer can therefore be quantified as degree (subzero temperature conditioned at) hours (subzero temperature duration experienced). It follows then that degree hours of subzero exposure are calculated by multiplying the temperature of subzero exposure in Celsius by the duration of subzero exposure in hours.
It should be noted that degree hours are not entirely universal and transferable. A certain number of degree hours applied to product will behave differently depending on the severity (temperature) of the subzero excursion. This is due primarily to the effects of supercooling, which will be discussed extensively below.
Due to the fact that the product was preconditioned at a temperature close to 0 °C, energy required to lower the product to 0 °C is not in the scope of our discussions.
Supercooling
Supercooling is defined as cooling a liquid below its known freezing temperature, without it becoming a solid. The liquid will remain in this supercooled state until a spontaneous source of nucleation is obtained, usually from agitation, a lone ice crystal, container surfaces, etc.
At the moment of nucleation, nearly all of the liquid product will quickly (within seconds) solidify into a semisolid/slush-like state. As supercooling prevents a liquid from becoming a solid, it also prevents internal force to be generated from freezing due to expansion. In this experiment, the rate of supercooling is observed.
Other studies of supercooling have demonstrated that the duration of supercooling is a stochastic function that depends on both temperature and duration of subzero temperature experienced (degree hours in this study). The findings in Heneghan's study (6) indicate that for a sample of 200 uL of pure water, 80% of samples nucleate between temperatures of −12.38 and −15.18 °C (sample temperature decreased at a rate of 1.08 K min−1).
Methods and Materials
Methods
All experiments experienced preconditioning (storage) at 5 °C until equilibrium was reached and then subsequently at 1 °C for 4 h prior to being subjected to experimental conditions. Detailed experimental setup is shown in Table I.
Experimental Setup and Conditioning
Subzero conditioning was then segmented into three distinct experimental conditions, and each experimental condition was repeated for three cycles with the exception of Experiment 2, which was repeated for four cycles. Visual inspection of each individual vial followed each experiment cycle. Temperature intensity and duration were selected based on prior temperature excursion history observed during distribution.
Hydrostatic internal pressure testing and/or vacuum leak testing was performed to test vial integrity. Hydrostatic pressure and durations were set, respectively, at 15 psi for 30 s, and then at 25 psi for 30 s upon passing the 15 psi test. Vacuum leak testing was performed by bringing the vial to −90 kPa in 1 to 2 min, and then holding it at −90 kPa for 10 min.
Materials
Conditioning was done in validated, temperature-controlled chambers capable of maintaining temperatures of −20 °C to 45 ± 2 °C. Type T thermocouples were used to monitor and log the temperature of our liquid product and the ambient temperature of the chamber.
Filled molded or tubular pharmaceutical-grade glass vials of varying sizes from 5 to 500 mL were obtained for testing (see Table II). No individual vial was used in more than one experiment.
Test Product Groups
Results and Discussion
Reading Temperature Profiles
Figure 1 is an example of temperature information obtained from experimentation. This figure illustrates data from Experiment 1, where the ambient conditions were set at −15 °C. From this data we are able to read the temperature of the product as it is being supercooled, to when nucleation occurs, to when freezing takes place, to when the solid cooling phase occurs. This information was captured for vials that were probed and later analyzed. Incidentally, this supercooling instance is known as a benign event, which we will discuss later.

Temperature information with phase/state notation.
Stimulating Supercooling
During Cycle 1 of Experiment 1, it was found that there was roughly an 80% rate of supercooling lasting the duration of the experiment (20 h) among the experimental groups. Having the liquid product solidify in our vials was critical in assessing the physical strength of the vials. After this cycle, a nucleation aid (ribbed metal wiring) was inserted into our product to provide a source of nucleation. In subsequent cycles of Experiment 1, there were zero instances of supercooling events that lasted the entire length of the cycle, indicating the nucleation aid was sufficient in increasing nucleation rates.
Benign Supercooling Events, Entire Supercooling Events, and Non-Supercooling Events
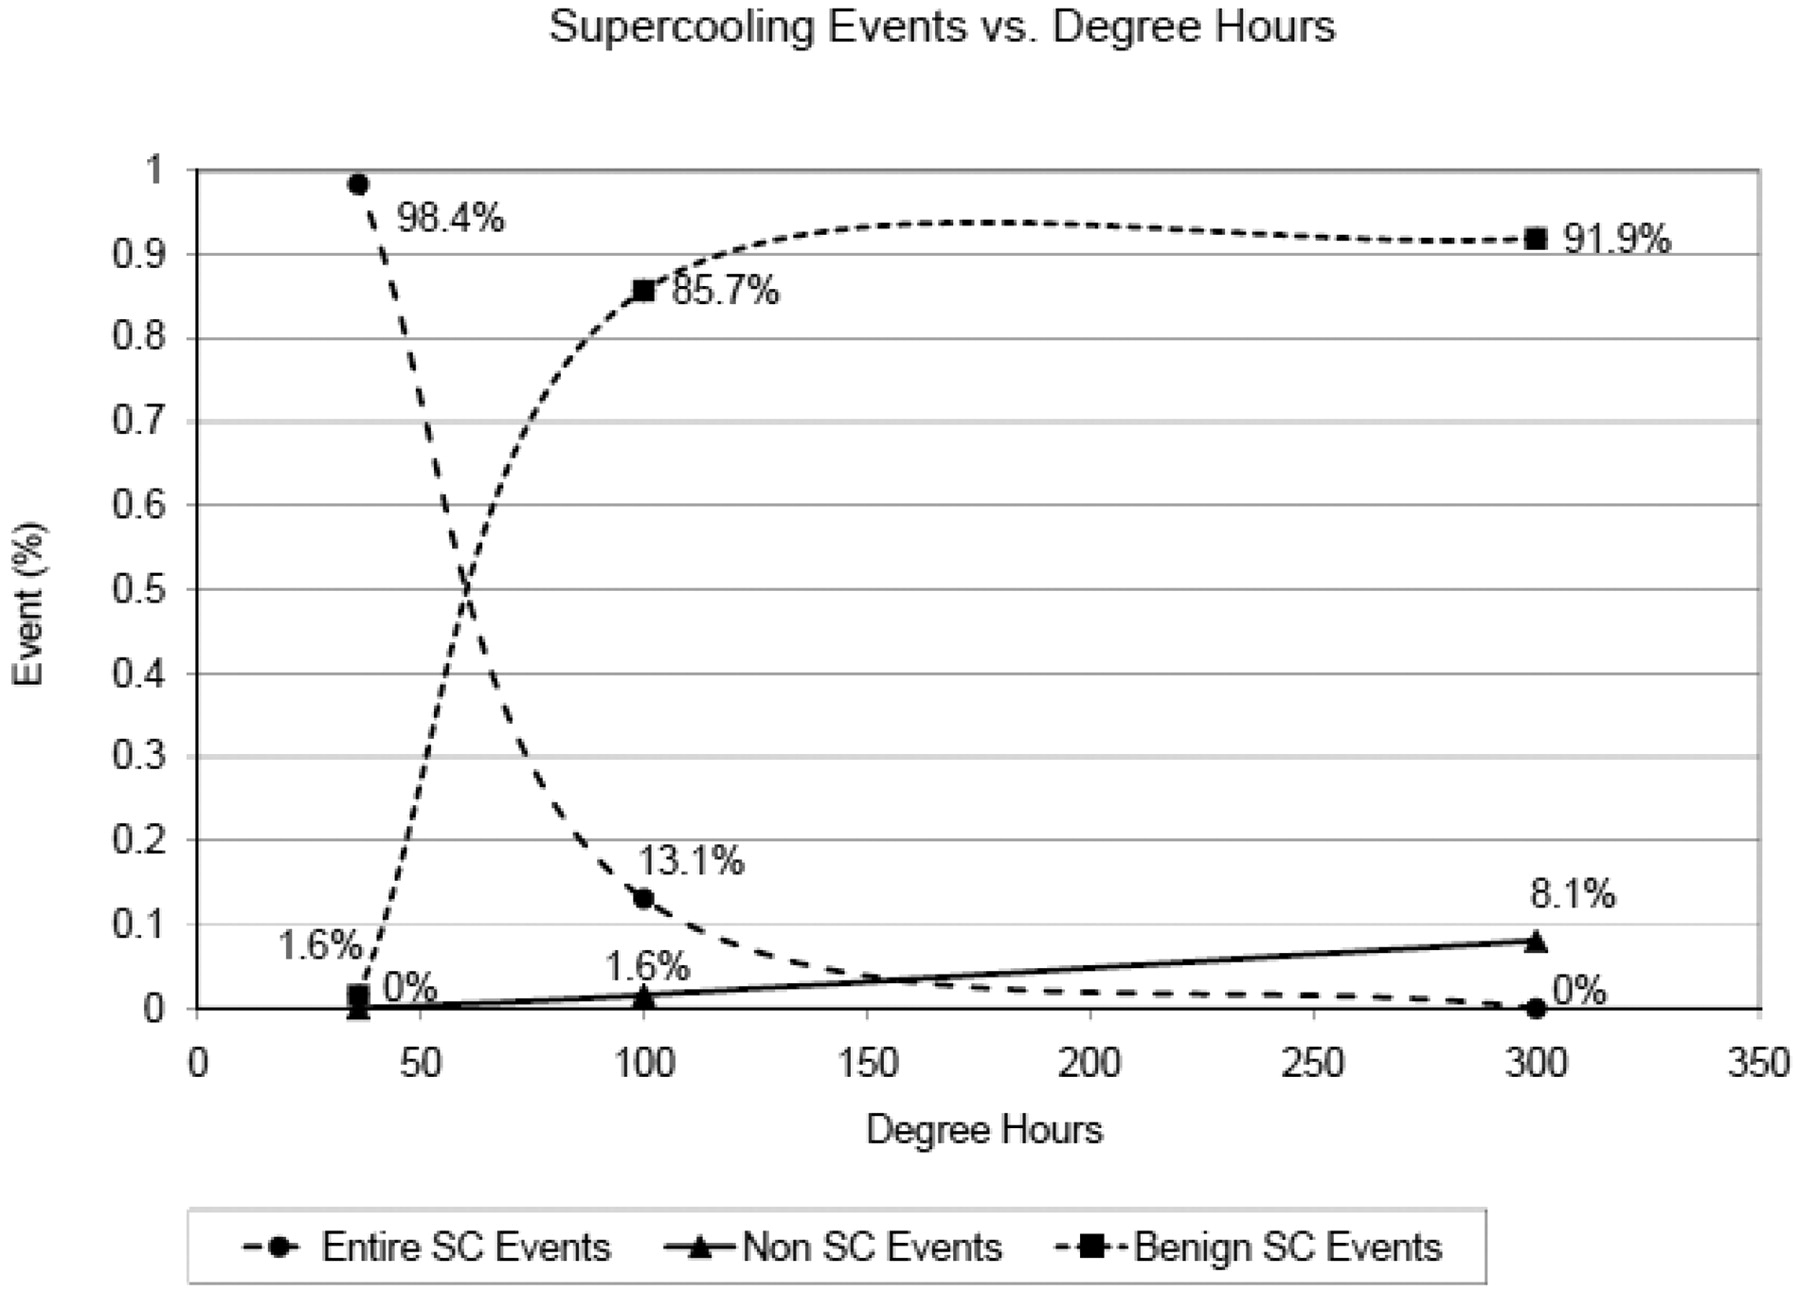
For the purposes of this paper, a benign supercooling event is where the liquid temperature probe has detected a finite supercooled duration with a start defined by reaching a subzero temperature and an end defined by the onset of freezing. Entire supercooling events are when the liquid temperature probe has detected that supercooling has spanned the entire duration of the subzero conditioning and no freezing or crystallization has occurred. Non-supercooling events are when product does not experience supercooling.
Effect of Temperature and Degree Hours on Supercooling
From Figure 2 we can gather that at a relatively weak subzero exposure (36 dh at −6 °C for 6 h), 98.4% of the samples experienced entire supercooling events, with 1.6% benign events, and 0% instance of non supercooling events. In contrast, with a strong subzero exposure (300 dh at −15 °C for 20 h), we notice that 91.9% of supercooling events are benign, 8.1% are non-supercooling events, and 0% are entire supercooling events.

Supercooling events versus degree hours exposed.
Average Degree Hours Required To Freeze
Based on probe results, we have calculated the rough averages of the degree hours that are required to freeze a product of certain volume. This information is displayed in Table III.
Average Degree Hours Required To Freeze
Percentage of Vial Breakage Based on Degree Hour Exposure and Degree Hours Required To Freeze
The percentage of breakage in product exposed to fewer degree hours than required to freeze was 0% (0/194). The percentage of breakage in product exposed to more degree hours than required to freeze was roughly 22% (278/1270).
Glass Vial Analysis
A random sample of both “flawless” vials that had passed visual inspection conditions as well as vials that were “flawed” were sent to a glass research and analysis lab, where further glass study was conducted. Vials were leak-tested as well as microscopically analyzed for flaws. From these analyses, it was determined that there was no presence of microfractures or signs of stress on glass vials that have survived the freezing process. The simple visual inspection methods used during experimentation to notate “flawed” from “flawless” vials after experimentation was 100% successful in detecting vials with physical defects as a result of subzero temperature exposure.
The majority of the failures were found to originate in the lower side wall of the vial. The exact origin was typically found to be caused by some benign defect, such as glass or metal (stainless steel) contact. These microscopic defects are somewhat common, resulting from the typical rigors of a manufacturing line. They are inherent weak points for breaks to originate and would pose concern under the stresses of freezing. Additionally, analysis had confirmed that the failures observed were due to the forces associated with freezing (in conjunction with origin defects), and not any other factor.
The failure modes and origins observed were similar to the failure modes and origins identified by Jiang et al., who observed glass vial breakage for frozen formulations of both mannitol and other amorphous proteins (3, 4), suggesting a common origin region (location) for vial breakages associated with product phase change. See Figure 3 for images of sample damaged vials.

Sample damaged vials.
Conclusion and Practical Application
During the perils of cold chain distribution, subzero excursions may happen. From the data gathered within this experiment, we can analyze excursion data against what has been observed here to determine the severity of impact the excursion may have had on the physical integrity of the glass vial. Assuming that when vials physically break, they break near the endpoint of complete freezing (due to expansionary forces, somewhere in the >90% frozen range), Table III can serve as a base against which to compare excursion data to make quality decisions. However, each quality organization is suggested to determine individual product degree hour thresholds independently, as product attributes may differ and affect rate and duration of freeze. Table IV serves as an example as to how to utilize contained study data to estimate level of risk.
Sample Risk Assessments
Further study is recommended to investigate the probability of vial breakage as a function of degree hour exposure, and to further observe the phenomena of supercooling, as well as its impact on vial breakage.
Additional Conclusions
Microfractures or signs of stress on glass do not occur in vials as a result of freezing. Failures in glass are clearly visible and able to be detected upon visual inspection.
Average degree hours of energy required to completely freeze various liquid products can be found in Table III. In this study, vials have been shown not to break until (at least) the minimum required energy for complete freezing is met.
Supercooling and delayed nucleation are inevitabilities with exposing product to subzero temperatures. The duration of supercooling and subsequent chances of nucleation have been discussed and estimated in Figure 2.
Vials containing protein solution or sterile water for injection will experience roughly a natural 80% supercooling rate in vials.
Less severe subzero temperature exposure results in fewer instances of nucleation (higher rate of supercooling) across the same duration of exposure.
Conflict of Interest Declaration
The authors declare that they have no competing interests.
Acknowledgments
The author would like to thank Ben Kitaguchi of Baxter Healthcare for support in this study.
- © PDA, Inc. 2012


