
Abstract
This paper describes the assessment of the BioVigilant® IMD-A™, a novel optical spectroscopy technology for the detection, sizing, and quantification of both viable and nonviable particles in real time. A comparative-study of a prototype design with conventional air sampling systems (the MAS-100™ and the CLiMET CI-450t) is presented. Studies have demonstrated that the BioVigilant IMD-A is capable of simultaneously and instantaneously enumerating both viable and nonviable particles in a variety of classified and uncontrolled environments. In general, the data for the IMD-A and the CLiMET followed a similar trend of increasing counts for both the ≥0.5 μm and the ≥5.0 μm nonviable particles when sampling progressed from the most controlled area (Grade A) to the least controlled area (a loading dock open to the outside of the facility). Zero viable particle counts were observed for both the IMD-A and the MAS when sampling the Grade A location. However, there was a trend for the IMD-A to detect significantly greater numbers of viable particles when monitoring all other sampling locations, especially those locations representing the least controlled environments. In addition, the IMD-A also detected, sized, and enumerated both viable and nonviable particles in a continuous sampling mode. The IMD-A technology's ability to provide real-time data may offer the industry an unprecedented advantage over growth-based bioaerosol samplers for monitoring the state of microbiological control in pharmaceutical manufacturing environments.
Introduction
A robust program for the monitoring of viable and nonviable particles during the manufacture of pharmaceutical dosage forms should be well-defined and sustainable throughout the life cycle of the product. This is especially true for aseptic processing operations, as an effective environmental monitoring program can provide meaningful information about the quality of critical manufacturing zones and ancillary clean areas. Furthermore, the environmental monitoring program should provide interpretable data that can assist in identifying actual or potential contamination issues associated with specific equipment, components, processes, and/or operational activities. From a manufacturing control perspective, environmental monitoring data should be capable of detecting an adverse drift in environmental conditions in a timely manner that would allow for meaningful and effective corrective actions to be undertaken (1).
Environmental monitoring programs are normally comprised of two components examining viable (i.e., microorganisms) and nonviable particles. The U.S. Food and Drug Administration (FDA) Guidance for Industry: Sterile Drug Products Produced by Aseptic Processing—Current Good Manufacturing Practice (2) and the European Commission EU Guidelines to Good Manufacturing Practice, Annex 1, Manufacture of Sterile Medicinal Products (EU Annex 1) (3) are publications providing direction for the monitoring of viable and nonviable particles in aseptic processing clean areas. For example, EU Annex 1 states that each manufacturing operation requires an appropriate environmental cleanliness level in the operational state in order to minimize the risks of particle or microbial contamination of the product or materials being handled (3). Similarly, the FDA Guidance for Industry recommends taking measurements at sites posing great potential risk to the exposed sterilized product, containers, and closures to confirm air cleanliness in critical areas (2).
A number of factors should be considered when establishing an environmental monitoring program. Cleanrooms should be routinely monitored in operation, and the monitoring locations should be based on a formal risk analysis study (3). It is also important that locations posing the most microbiological risk to the product be designated as a key part of the program (2). Furthermore, when identifying critical sampling sites, consideration should be given to the points of contamination risk in a process, including factors such as difficulty of setup, length of processing time, and impact of interventions (2). EU Annex 1 (3) recommends cleanrooms should be routinely monitored in operation, and particle monitoring should be undertaken for the full duration of critical processing, including equipment assembly, in Grade A zones. Where aseptic operations are performed, monitoring should be frequent using methods such as volumetric air sampling. Additionally, the Grade A zone should be monitored at such a frequency, and with a suitable sample size, that all interventions, transient events, and any system deterioration would be captured and alarms triggered if alert limits are exceeded (3). The FDA Guidance for Industry recommends regular monitoring during each production shift, and describes routine particle monitoring as a beneficial tool in rapidly detecting significant deviations in air cleanliness from qualified processing norms, such as clean area classification (2). With respect to sample volumes, EU Annex 1 states a minimum sample of 1 m3 should be taken per sample location when classifying Grade A zones and that a suitable sample size be collected during routine monitoring (3). The FDA recommends using active devices when assessing the microbial quality of air and using sufficient sample sizes in order to optimize the detection of environmental contaminants at levels that might be expected in a given clean area (2). A more comprehensive review regarding how to establish a meaningful and manageable environmental monitoring program may be found in Environmental Monitoring, A Comprehensive Handbook (4).
Both the FDA's Guidance for Industry and EU Annex 1 specify the maximum allowable level of viable and nonviable particles per measured volume of air (i.e., 1 m3) when an active air sample is obtained (Tables I and II).
FDA Air Classificationsa
EU Air Classifications
Opportunities for Using a Rapid Microbiological Method for Environmental Monitoring
Available air sampling systems are currently limited in their ability to deliver on the expectations of a robust environmental monitoring program. For example, sampling technologies for the continuous and real-time assessment of nonviable particles are utilized today; however, the pharmaceutical industry continues to rely on single-point, growth-based methodologies for the detection and quantification of microorganisms in volumetric air samples. One of the most commonly used sampling method employs the process of particle impaction: airborne microorganisms are forcibly deposited onto an agar surface where (under the right growth conditions) they replicate, and develop into colony-forming units (CFUs), which are subsequently enumerated. For many years this practice has provided the industry with an understanding about the state of microbiological control in critical manufacturing environments. There are, however, significant limitations to this growth-based methodology, including a significant time delay between the point when the air sample is initially acquired to the point when CFUs are visually detected and enumerated on an agar plate (e.g., 3–5 days).
In some cases, confluent growth may hamper efforts to accurately report the true number of CFUs that were in the original air sample, and some laboratories are discovering that airborne microbes—when stressed due to nutrient deprivation, or damaged following exposure to sub-lethal concentrations of chemical or physical antimicrobial agents, such as preservatives, disinfectants, heat or decontaminating gases—may not replicate and form CFUs when cultured on artificial media. One explanation for this observed lack of growth may be attributed to the collected organisms being in a viable but non-culturable (VBNC) state, in which the artificial medium and/or incubation conditions are not optimal for the resuscitation and subsequent proliferation of the captured microbes (5–16). Additionally, currently available bioaerosol samplers are limited by their design with respect to their collection methods and subsequent recovery of microorganisms. For example, the aerodynamics of many air samplers limits the efficiency and consistency of capturing microorganisms on an agar plate. High air flow rates, shearing forces and/or desiccation may damage microorganisms, resulting in reduced or no microbial growth (17–20).
For these reasons, the modern microbiological laboratory should look towards developing innovative approaches to the detection and quantification of CFUs or microorganisms in environmental monitoring samples. Recently, the introduction of rapid microbiological methods has filled this void, offering significantly reduced time-to-result for microbial detection and quantification—and for some technologies, results in real-time (21). In this instance, rapid microbiological methods can be applied as PAT platforms, when information about the microbial control of a manufacturing process can be obtained, for example, during purified water and in-process bioburden testing, and during environmental monitoring (22, 23).
A novel optical spectroscopic technology for the detection, sizing, and quantification of both viable and nonviable particles in real time is described here. The researchers present a comparative study of the prototype design with conventional viable and nonviable air sampling systems, and demonstrate that the commercially available system is able to sample in a continuous monitoring mode.
Materials
This study utilized the BioVigilant IMD-A, an optical spectroscopic technology that simultaneously detects, sizes, and enumerates both viable and nonviable particles in real time. The system relies on Mie-scattering, in which scattered light is concentrated in a forward direction, and the scattered portion of the light is proportional to the particle size. When airborne particles are processed through the IMD-A, the system detects and quantifies particles within a 0.5–15 μm range. At the same time, a 405-nm laser intersects the particle beam, and causes particles of biological origin, such as vegetative bacteria, yeast, and spores to autofluoresce, due to the presence of cellular NADH, riboflavin, and dipicolinic acid. Data is acquired instantaneously and the system is capable of analyzing a single volumetric air sample or operating in a continuous monitoring mode. A full description of the technology may be found in the Encyclopedia of Rapid Microbiological Methods (24). A picture of the commercially available IMD-A instrument is shown in Figure 1, and an example of the data display screen is shown in Figure 2.
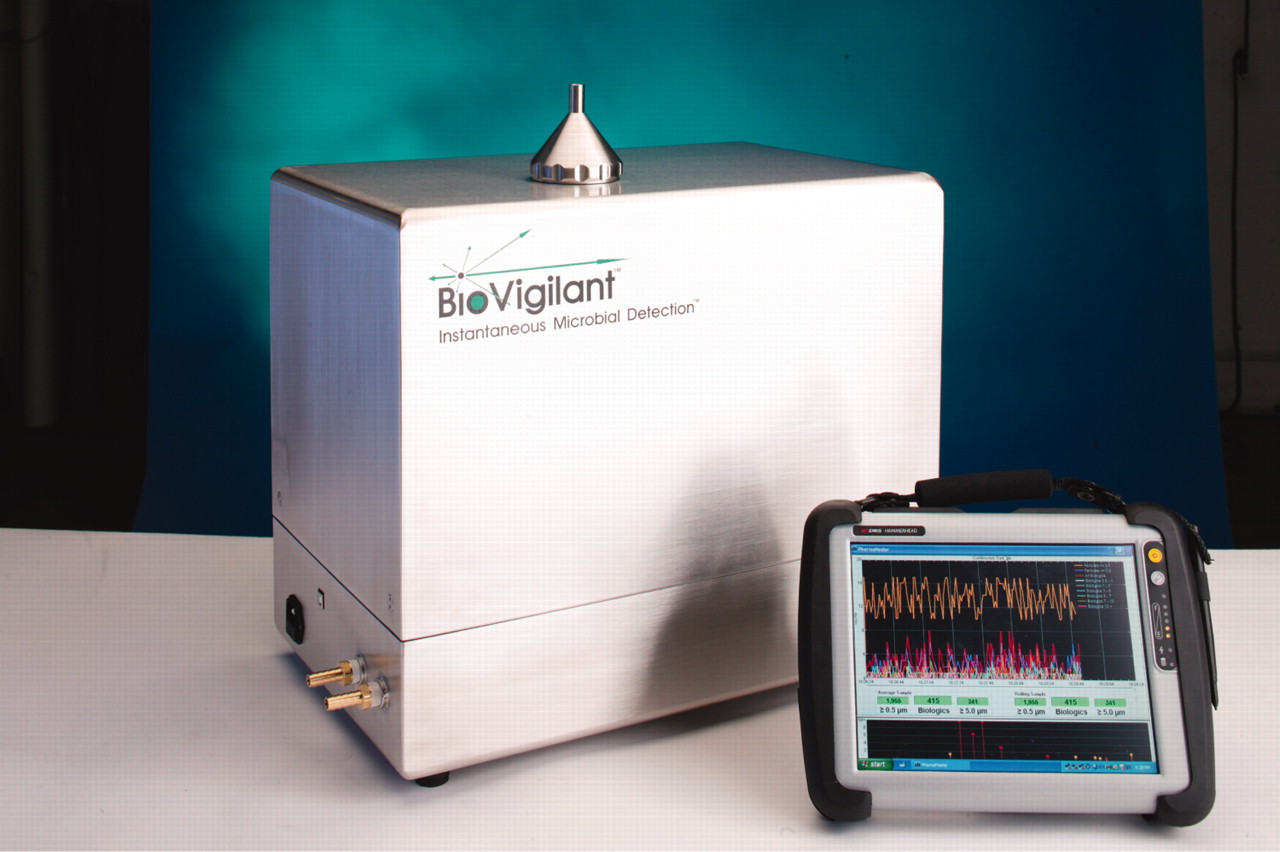
BioVigilant IMD-A. Air is sampled through the inlet port located on the top of the instrument, and is expelled through two outlet ports located on the lower side panel. An external laptop computer controls the instrument using BioVigilant's PharmaMaster™ control and analysis software. Reprinted with permission from BioVigilant Systems, Inc.
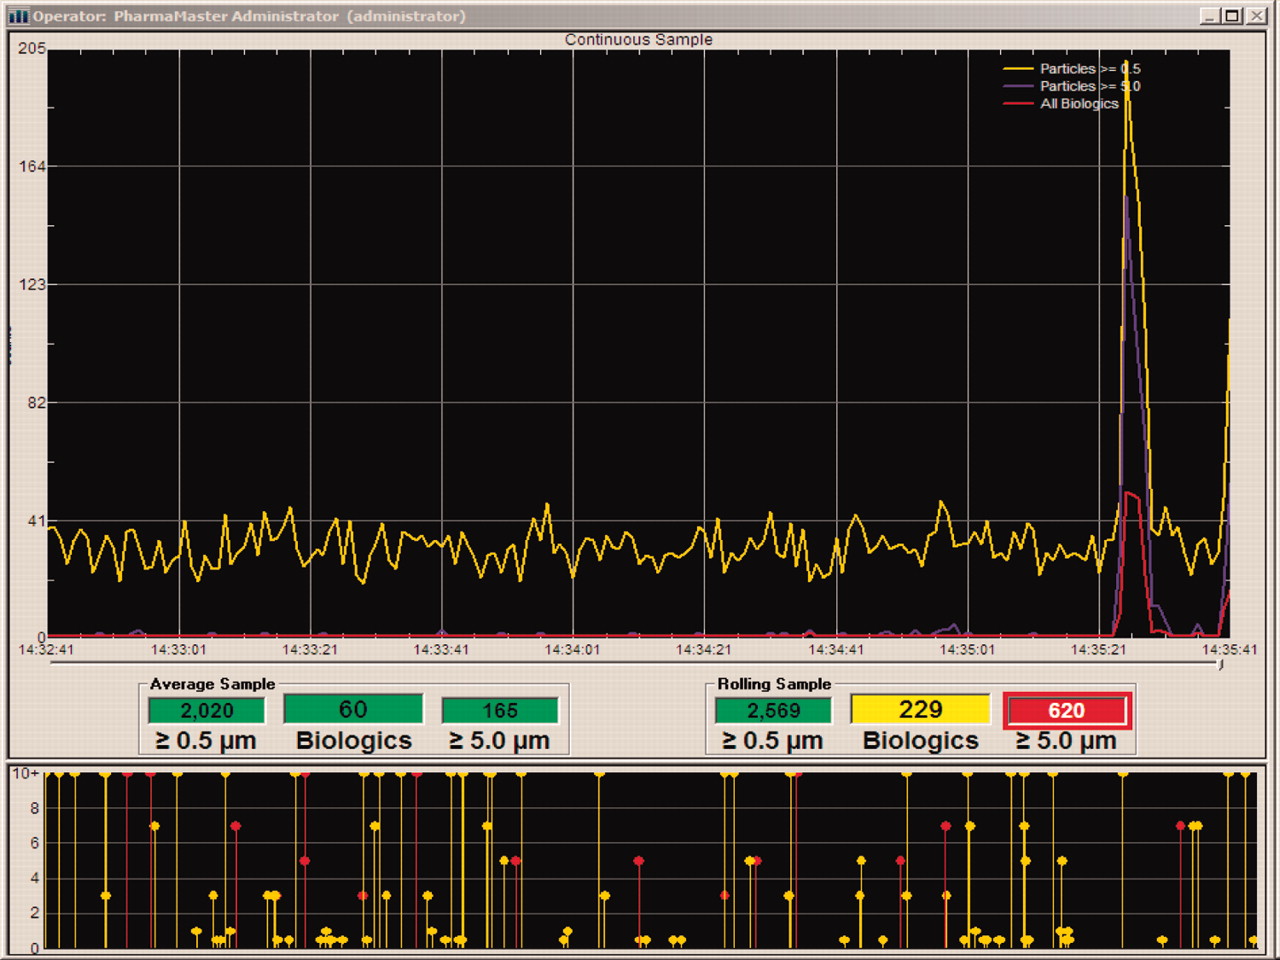
BioVigilant IMD-A data display screen. The lower screen represents data that is displayed and refreshed every 1 s. The number of viable particles and total particles are shown in red and yellow, respectively. Data from the lower screen is transferred (every 1 s) to a continuous time chart of viable particles (shown in red) and nonviable particles ≥0.5 μm and ≥5.0 μm (shown in yellow and blue, respectively) in the upper screen.
In Figure 2 the peaks at the far right side of the upper screen show an excursion of viable and nonviable particles that occurred at 14:35:26. The rolling sample data (right side numbers) represent the cumulative particle counts in a user-defined volume of air (e.g., 1 m3) at any given time during sampling. The average sample data (left side numbers) represent the average particle counts for all acquired data (from the start of the monitoring run) per volume of air. Green boxes represent data that are within acceptable levels (these have been pre-determined by the user), yellow boxes correspond to data that have exceeded alert levels, and red boxes denote data that have exceeded action levels.
A prototype design of the BioVigilant IMD-A was used during our comparative studies. The prototype employed the same Mie-scattering principle and laser source as the currently available commercial design. However, the system was rated at an effective airflow rate of 12 liters of air per minute (LPM). Comparative testing was performed using an EMD Chemicals Inc. MAS-100™ (hereinafter referred to as MAS) air sampler (100 LPM) with Tryptic Soy Agar (TSA) for viable particles and a Climet Instruments Company CI-450t (hereinafter referred to as CLiMET) airborne counter (50 LPM) for nonviable particles. Three commercial IMD-A instruments were used (Serial #2, 3, and 17) during subsequent continuous monitoring studies conducted in a laboratory environment.
Methods
Environmental monitoring was conducted in a variety of classified and uncontrolled areas in two separate facilities. The IMD-A technology platform was still in development during the time of these studies, so we chose to initially assess this system in classified areas (i.e., EU GMP Grade A, B, C, and D of a parenteral clinical operations facility) that were previously decommissioned for use. In each of these areas, high efficiency particulate air (HEPA) flow and velocity were operating under normal conditions; however, the rooms were not routinely disinfected nor was there restricted access to personnel without appropriate gowning. For these reasons, we had no preconceived expectations for the amount of viable or nonviable particles we would observe in these areas during the course of the studies. We also evaluated each system in uncontrolled environments, including a warehouse and a loading dock that opened to the outside of a separate facility. All monitoring occurred while the rooms were in the “at rest” or “static” condition, and individuals conducting these studies wore appropriate attire (i.e., gowns, gloves, etc.) in the controlled areas to minimize the impact of personnel-generated particles.
The location of sample positions (Table III) was based on preliminary screening and risk-based mapping (e.g., as recommended in the FDA Guidance for Industry and EU Annex 1), which took into consideration the operational knowledge of the area (fixed equipment layout personnel flow, equipment and material flows); areas of possible low airflow or still air (e.g., room corners and distal areas from HEPA filters); difficult-to-access areas for cleaning due to equipment configuration; and/or proximity of the sample location to areas where open operations may occur or locations containing high traffic and/or human activity.
Comparative Study Sample Locations
For each monitoring event, all three instruments (IMD-A, MAS, and CLiMET) were positioned such that they would sample the same air stream but would not interfere with the operation of air collection capabilities of the other instruments. When initiating a sample monitoring event, all three instruments were started at the same time.
Although the IMD-A is capable of actively monitoring air in a continuous monitoring mode, we chose to acquire data on individual, replicate sample volumes during these studies. The software can be programmed to sample a volume of air in either cubic feet (ft3) or cubic meters (m3). The sample size for these studies was set at 1 m3 of air; the same volume used by the EU and the FDA to set active air monitoring acceptance levels (Tables I and II). However, none of the instruments were capable of sampling 1 m3 of air within the same time period because each system operated under a different sampling flow rate. The effective air flow rate for the IMD-A, and stated flow rates for the MAS and CLiMET was 12 LPM, 100 LPM, and 50 LPM, respectively. Although the MAS was able to collect 1 m3 of air in 10 min, the other two instruments required longer running times in order to sample the same 1 m3 volume. If we shut down the MAS when the required sample of air was obtained but continued to sample on the other two instruments, inconsistencies could appear in the final outcome of the study because the MAS would not have been exposed to the additional airborne contaminants that may have been present. Therefore, for the purpose of this study, all three instruments sampled air for the same time period (10 min), and a conversion factor was applied to the resulting data that provided a corresponding viable and total count per 1 m3 of air for the IMD-A and the CLiMET. The IMD-A unit has an effective flow rate of 12 LPM. The total effective air sampling volume is 120 L (0.12 m3) for a 10-min sampling time, and a conversion factor of 8.33 was applied to the mean data. The CLiMET has a flow rate of 50 LPM. The total air sampling volume is 500 L (0.5 m3) for a 10-min sampling time, and a conversion factor of 2 was applied to the mean data. Following the collection of viable particles in the MAS, TSA plates were incubated at 20–25 °C for a minimum of 72 h, followed by incubation at 30–35 °C for a minimum of 48 h. The resulting CFUs were enumerated.
We utilized a statistical approach to determine the number of single samples for an appropriate sample size (N) for each area based on the number of counts observed from the IMD-A during the time of testing. The sample size was determined assuming that a difference of 25% (at most) of the average reading is considered equivalent and that the sample sizes are the same for various sampling methods (Table IV). With these sample sizes there is a 0.8 probability that a true mean reading difference of at least 25% will be detected and a 0.05 probability of falsely rejecting equivalency.
Sample Size Based on Recovery Results
Data Analysis for Comparative Studies
An equivalence test was used to assess the statistical and practical equivalence between the population mean of the IMD-A-generated data and the two conventional methods. Equivalence testing compares the two population means using the following hypotheses structure:
 where μIMD-A is the long term average of measurements obtained for the IMD-A, and μMAS is the long term average of measurements obtained for the MAS.
In this approach, the null hypothesis assumes the two population means are different by at least a pre-defined threshold amount. If the confidence interval is entirely within the lower and upper bounds, the two population means are declared comparable. If the confidence interval is not entirely within the bounds, the two population means are not declared comparable and the null hypothesis remains in effect stating that the two population means are different.
Evaluation of Three Instruments Under Laboratory Conditions
Three commercially available IMD-A systems (Serial #2, 3, and 17) were obtained and laboratory studies were conducted to demonstrate that the instruments were capable of acquiring data continuously while sampling HEPA-filtered air and laboratory ambient air. The three instruments were placed on the same laboratory work bench during these studies.
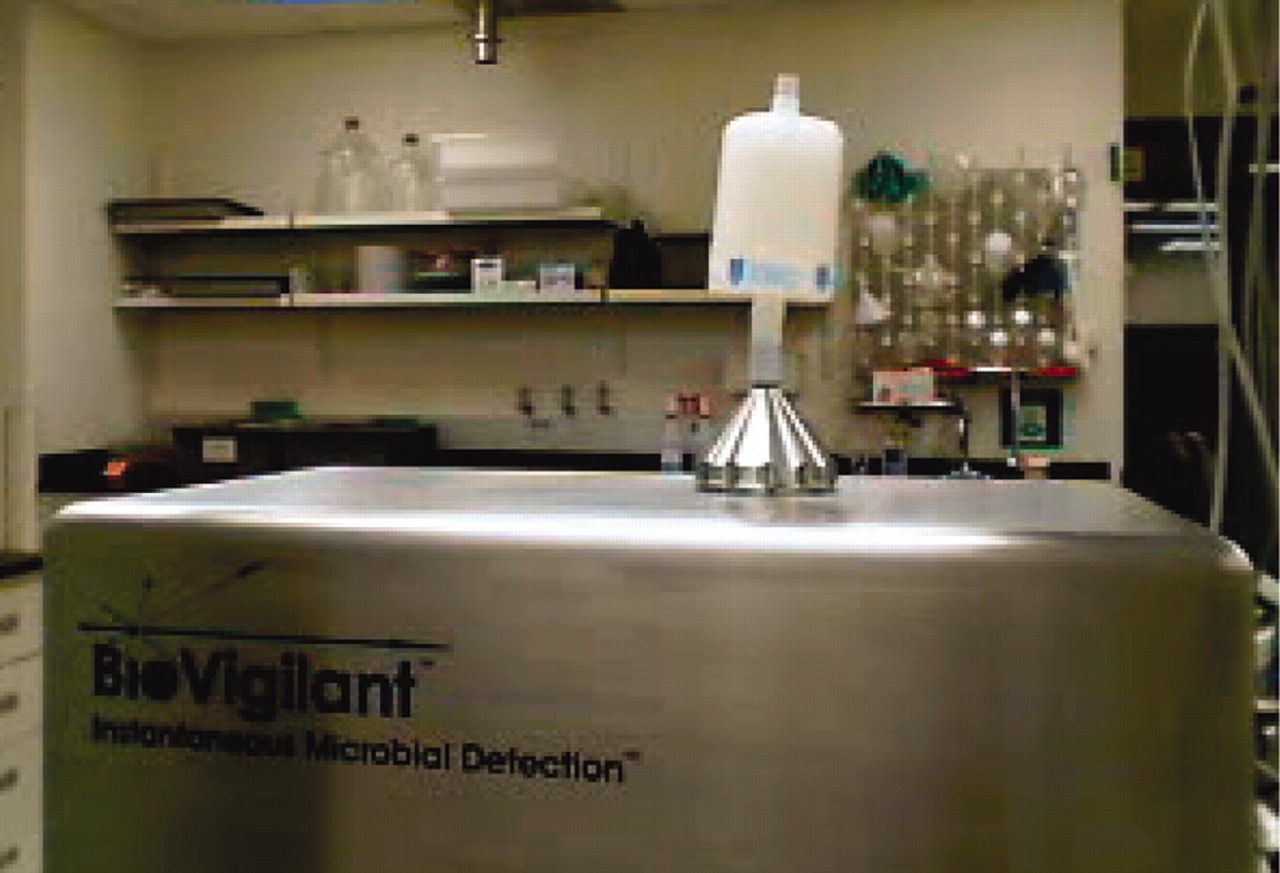
To evaluate the systems under HEPA-filtered conditions, a Whatman HEPA-CAP in-line HEPA filter was attached to the air inlet on each of the IMD-A instruments (Figure 3). The IMD-A is capable of sampling and reporting results either in cubic feet or cubic meters, and because we previously measured in cubic meters during the comparative studies, we assessed the functionality of this software option by sampling continuous cubic feet volumes of air during the laboratory studies. Initially, each instrument was run continuously with the in-line HEPA filter in place for at least 1 h to completely purge the sampling path of particles that may have been introduced during the vendor's initial commissioning. When the level of particles was reduced to an acceptable baseline, each instrument was then run continuously until a minimum of 1500 ft3 of HEPA-filtered air was sampled. Following these sampling runs, the HEPA filters were removed from the air inlets and each instrument was run continuously until at least 5400 ft3 of ambient, laboratory air was sampled. All of the data was collected and archived on a laptop computer specific to the IMD-A instrument it was controlling, and the results were reported as the mean particle count (i.e., ≥0.5 μm, ≥5.0 μm, and viable) per ft3 of sampled air.

Location of in-line HEPA filter on the air inlet of an IMD-A instrument.
Results and Discussion
Comparative Studies
The data generated during the comparative studies demonstrated that the BioVigilant IMD-A technology was capable of detecting, sizing, and enumerating varying levels of viable and nonviable particles in each of the monitored environments. Recovered counts for replicate 1-m3 air samples for the IMD-A, MAS, and the CLiMET are provided in Table V. The number of replicates acquired during the study was based on the IMD-A recovered viable counts at the time of testing and the guidance in Table IV. The number of replicates were equal to 10 for sample location CT6, 4 for sample locations CT5 and CT19, and 2 for the remaining sample locations. In general, the data for the IMD-A and the CLiMET followed a similar trend of increasing counts for both the ≥0.5-μm and the ≥5.0-μm nonviable particles when sampling progressed from the most controlled area (Grade A, CT6) to the least controlled area (a loading dock open to outside the facility, LD1).
Comparative Summary Data for Total and Viable Particles
The IMD-A detected substantially greater numbers of ≥0.5-μm particles at the Grade A location CT6 when compared with the CLiMET. The reason for this discrepancy is unclear, as the disparity in ≥0.5-μm particle counts for the two instruments were not as obvious in the Grade B, C, or D areas. Additional studies were not conducted to further investigate these results because modifications to the prototype were already in progress for the commercial design. Both the IMD-A and the CLiMET did not detect any ≥5.0-μm particles at the Grade A location CT6; however, the IMD-A detected greater numbers of ≥5.0-μm particles for all other sampling locations. Zero viable particle counts were observed for both the IMD-A and the MAS when sampling the Grade A location CT6; however, there was a trend for the IMD-A to detect significantly greater numbers of viable particles when monitoring all other sampling locations, especially those locations that represented the least controlled environments. Except in the cases where all readings were zero (0) (i.e., viable counts at sample point CT6 for the IMD-A and the MAS, and ≥5.0-μm nonviable counts at sample point CT6 for the IMD-A and the CLiMET), the data was statistically different at the P ≤ 0.2 level (the data did not discredit the “Non Equivalent” assumption [α = 0.20]). Similar results were recently reported by Bhupathiraju et al. (25) in their evaluation of the IMD-A and a conventional, agar-based air sampler (Bioscience International SAS) in cleanroom environments. Bhupathiraju et al. demonstrated that the IMD-A recovered substantially higher counts than the conventional method in Grade C, D, and E areas, and both the IMD-A and the conventional method detected no viable counts in a Grade A area (25).
Because the classified areas in our study (CT6, CT5, CT19, and CT9) were previously decommissioned and were not maintained to the level of a standard operating manufacturing facility (e.g., routine disinfection, restriction of people flow, etc.), it would not be surprising to observe a higher number of viable particles than normally expected for these types of controlled environments (i.e., as specified by the EU and FDA). However, we did observe significantly higher viable counts for the IMD-A as compared with the MAS in all areas outside of the Grade A environment. To better understand the reason or reasons for these disparities, we must comprehend how these monitoring devices operate and the method by which they detect viable particles.
The IMD-A and the MAS both use an impaction-type sampling device to collect airborne particles for analysis. Impaction is particle motion that results in the collection or collision of particles at a surface due to particle inertia. All impactors are based on the same principle: particles separate from the carrying air by inertial force (26). In bioaerosol samplers, the inertia of the airborne particles affects their ability to impact onto a solid agar medium surface (as would be the case in the MAS air sampler) or carries them downstream as a concentrated particle stream in what is known as a virtual impaction device (as would be the case for the IMD-A concentrator) (27). How well an impaction bioaerosol sampler collects airborne microorganisms is based on that sampler's impaction, or collection efficiency, and its particle cut-off size. Collection efficiency on an object in an airstream can be defined as (i) the number of particles striking the obstacle divided by the number that would have passed through the space occupied by it if the object had not been there (28), or (ii) the fraction of airborne particles of a certain size that will be removed from the air and deposited onto the collection medium (20). The cut-off size of particles (also known as the d50) impacted or collected is defined as the particle size at which the collection efficiency is 50%. This is equivalent to assuming that the mass of particles larger than the cut-off size that get through the sampler equals the mass of particles below the cut-off size that are collected by the sampler (26). For the purpose of our discussion, the smaller the d50, the more efficient the air sampler is at collecting smaller-sized particles.
A recent study by Yao and Mainelis (19) provides experimental data on the effective collection efficiencies and d50 for seven commercially-available bioaerosol samplers, including the MAS-100. Yao and Mainelis used polystyrene latex particles ranging from 0.5 to 9.8 μm to evaluate the MAS, SMA MicroPortable, BioCulture, Microflow, Millipore Air Tester (MAT), SAS Super 180, and the RCS High Flow portable samplers. In general, all the tested samplers demonstrated an effective collection efficiency of 10% or less for 0.5-μm particles. The effective collection efficiency for the MAS was above 60% for particles of 2 μm when the agar plate (containing 50 mL agar) was 2.8 mm from the sampling jet, and decreased to 30% for the same particles when the jet-to-plate distance was 6.4 mm (using a 30-mL agar plate). When establishing similar data using 1.0-μm particles, the MAS effective collection efficiency dropped to below 10% for both jet-to-plate distances. This is substantially lower than the experimental collection efficiency equal to 50% for the IMD-A concentrator using 1.0-μm particles (supplier specification). Next, the Yao and Mainelis study reports that the experimental cut-off sizes, or d50, of the investigated samplers ranged from 1.2 μm for the RCS High Flow, 1.7 μm for the MAS, 2.1 μm for the SAS Super 180, 2.3 μm for the MAT, and close to or higher than 5 μm for the other three samplers. This data can be compared with the experimental d50 for the IMD-A concentrator, which is equal to 1.0 μm (supplier specification). Furthermore, the IMD-A is capable of detecting individual viable particles in the range of 0.5–1.0 μm. This attribute, in addition to the substantially higher IMD-A concentrator collection efficiency and lower cut-off (d50) size as compared with the MAS, may explain why higher microbial counts were observed in the IMD-A during the present comparative studies.
A follow-up investigation by Yao and Mainelis (20) assessed the biological performance of the same seven air samplers by their ability to maintain biological properties of the collected particles (i.e., the sampler's ability to maintain culturability of collected microorganisms). The researchers used bacterial (Pseudomonas fluorescens, Escherichia coli and Bacillus subtilis) and fungal spores (Cladosprium cladosporioides, Aspergillus versicolor, and Penicillium melinni) ranging in size from 0.61 to 3.12 μm in aerodynamic diameter. The MAS demonstrated effective collection efficiencies of approximately 60% when sampling fungal spores; however, this was reduced to 22% when sampling B. subtilis and E. coli, and was only 10% for P. fluorescens. The low collection efficiencies reported in this study, especially for the MAS, are consistent with what was previously reported in the Yao and Mainelis investigation (19) regarding the physical collection characteristics of these same air samplers. These low collection efficiencies further support the notion that the MAS may collect lower numbers of microorganisms, especially individual bacterial cells, when compared with the IMD-A.
A number of publications have also suggested that air samplers can affect the viability of microorganisms as a result of the collection process. Yao and Mainelis (19) implied that stress, such as desiccation and impaction, may further reduce the number of culturable bacteria recovered by air samplers. In an evaluation of eight bioaerosol samplers challenged with bacterial aerosols, Jensen et al. (18) concluded that currently available samplers cannot recover viable airborne particles without some inactivation or loss during or after sampling. They also stated that viability loss may occur in air samplers that create sufficient shearing force to cause the destruction of some vegetative cells. Macher and First (17) also suggested that losses in viability can occur when cells are subjected to the collecting forces of a sampling device. Finally, in a study of four aerobiological sampling methods, Buttner and Stetzenbach (29) concluded that long sampling times and sampling stress may have contributed to an observed decrease in the viability and recovery of vegetative bacteria and spores.
Conventional microbiological media may not be optimal for the resuscitation and subsequent growth of microorganisms that may be present but are environmentally stressed, nutrient-deprived, and/or physically or chemically damaged. This factor might contribute to the reduction in recovered microorganisms, especially when using agar-based air sampling systems. These microorganisms are considered viable but non-culturable (VBNC), and a number of researchers have suggested that growth-based recovery systems provide an underestimation of the true number of viable organisms in natural and clinical settings (6–16). Additionally, it has been suggested that stressed and VBNC organisms may be responsible for the underestimation of airborne cells in environmental monitoring samples (30, 31).
The concept of VBNC organisms plays an important role in further explaining why the IMD-A technology may detect higher numbers of microorganisms when compared with conventional, growth-based methods, and why this phenomenon may be enhanced for environmentally stressed organisms, for cells exposed to sanitizing agents, or preservatives (5). The IMD-A detects microorganisms based on the presence of cellular viability markers (namely, riboflavins, NADH and dipicolinic acid) and does not rely on the same microorganisms' ability to grow on agar media. If we assume that a proportion of the airborne microorganisms collected during our studies were physically stressed or in a VBNC state, this could explain why we observed an increase in microbiological counts in the IMD-A as compared with the MAS. The detection of greater numbers of microbial counts (when compared with growth-based methods) has also been observed with other viability-based rapid microbiological methods, such as flow cytometry (32) and solid phase cytometry (33). In a study comparing the recovery of airborne microorganisms using the IMD-A and an all glass impinger (organisms in the glass impinger collection fluid were enumerated in the Chemunex ScanRDI,® a solid-phase cytometry technology using a viability stain, and a laser detection system), Bhupathiraju et al. (25) reported almost identical results when both instruments sampled air from an unclassified office environment. The same investigators reported that the IMD-A recovered substantially higher microbial counts when compared with a conventional, agar-based air sampler (SAS) during the evaluation of cleanroom environments, further supporting the results from the present studies.
Evaluation of Three Instruments Under Laboratory Conditions
The results of the laboratory studies demonstrated the effectiveness of the IMD-A system to detect, size, and enumerate both viable and nonviable particles in a continuous sampling mode. The three instruments provided similar results when in-line, HEPA-filtered laboratory air was evaluated (Table VI).
HEPA-Filtered Air Monitoring
A mean count of 1 or 4 particles per cubic foot was observed for the ≥0.5-μm nonviable particles, and a mean count of zero (0) particles per cubic foot was observed for both the ≥5.0-μm nonviable particles and the viable particles. However, over the course of these continuous monitoring runs, very low levels of individual counts for both the ≥5.0-μm nonviable particles and the viable particles were observed (data not shown). These results suggest that the in-line HEPA filter used in these studies may have allowed some airborne ≥5.0-μm nonviable particles and microorganisms to pass through the HEPA filter, which were subsequently detected and counted by the IMD-A instruments. This finding is not surprising, given the fact that the supply air to the in-line filter was uncontrolled, and that HEPA filters are depth filters, not sterilizing filters, with a filtration efficiency of 99.97% for airborne particles that are 0.3 μ in size. Furthermore, the FDA's Guidance for Industry and the European Commission's EU Annex 1 allow up to 3520 particles that are ≥0.5 μm in size per cubic meter, and EU Annex 1 allows up to 20 particles that are ≥5.0 μm in size per cubic meter, in ISO Class 5 or Grade A aseptic areas. One explanation why we observed low levels of viable counts during our HEPA-filter studies is that we detected airborne microorganisms, either as planktonic, free-floating entities or while attached to a nonviable particle, that fell within the same size range of nonviable particles (i.e., 0.5 to 5.0 μm) that we currently allow to be present in HEPA-filtered environments. A second explanation is that the IMD-A detected the presence of very low levels of VBNC organisms, as previously discussed. Although it is unclear whether or not these results can predict what the IMD-A will detect in actual cleanroom or barrier isolator environments, this question will be explored in a separate paper (Part II of these comprehensive studies).
The three IMD-A instruments were also shown to detect airborne particles from laboratory (ambient) air samples, and the results between the three instruments were similar in observed counts, with the exception of IMD-A #17 for the ≥0.5 μm total particle count (Table VII). This may have been due to variability in the room air as a result of uncontrolled air patterns (i.e., air flow, velocity, and location of HVAC panels) in the laboratory as well as placement of each of the instruments on the work bench.
Ambient Laboratory Air Monitoring
Summary
These studies demonstrate that the BioVigilant IMD-A is capable of simultaneously and instantaneously detecting, sizing, and enumerating both viable and nonviable particles in a variety of controlled and uncontrolled environments. The technology's ability to provide real-time data may offer the industry an unprecedented advantage over growth-based bioaerosol samplers for monitoring the state of microbiological control in pharmaceutical manufacturing areas. It has been well documented that currently available air samplers are limited by their design and operation. Ljungqvist and Reinmüller reported a 5–10 fold variability in microorganism recovery among different microbial air samplers (34). Yao and Mainelis (19) concluded that the use of most of the bioaerosol samplers they tested may result in a substantial underestimation of bacterial concentrations, especially of individual microbial cells with diameters in the range of 0.5–1.0 μm. They continue to state that it appears that most of the portable samplers tested would provide only qualitative data when collecting individual bacteria. It is necessary, for this reason, to further develop more robust bioaerosol samplers with cut-off sizes as low as 0.5 μm. The BioVigilant IMD-A is capable of detecting individual viable particles in the range of 0.5–1.0 μm, and this may be one reason why greater viable counts were observed when compared with a conventional, growth-based method.
It is understood that the environmental and physical stresses that airborne microorganisms are exposed to can contribute to the reduced ability of growth-based sampling systems to provide a realistic understanding of the actual microbial load that may be present during active air monitoring. Culture methods assume that the organisms will grow and produce classical characteristics within a specified period; however, this period can take several days or weeks to perform. Therefore, rapid, accurate means to monitor airborne microorganisms are needed to overcome the constraints encountered with traditional culture-based methods (15). Finally, the desire to implement a continuous, viable particle monitoring platform is important if we want to establish a more robust method for trending environmental data, improve our product and process understanding, and move toward a continuous improvement model for microbiological control during pharmaceutical manufacturing (35, 36).
Over 15 years ago, Buttner and Stetzenbach (37) stated that a single air sample at a single location at a discrete point in time may have limited value when the concentration of viable airborne microorganisms is assessed with currently available samplers due to the instruments' lack of repeatability and sensitivity. The current studies have demonstrated that the BioVigilant IMD-A can detect viable and nonviable particles in a continuous sampling mode. The use of this technology as a real-time environmental monitoring platform for barrier isolator environments will be explored in Part II of this comprehensive evaluation.
Footnotes
- © PDA, Inc. 2009
References


Jump to section
Related Articles
Cited By...
- Challenges Encountered in the Implementation of Bio-Fluorescent Particle Counting Systems as a Routine Microbial Monitoring Tool
- Environmental and Personnel Monitoring Programs--A Risk-Based Case Study of Cutibacterium acnes
- Investigation of the Detection Ability of an Intrinsic Fluorescence-Based Bioaerosol Detection System for Heat-Stressed Bacteria