
Abstract
Recent initiatives summarized under the term quality by design (QbD) urge for science and risk-based pharmaceutical bioprocess development strategies. One of the most accepted concepts communicated by the regulatory authorities is the concept of design space—a multidimensional combination of critical process parameter (CPP) ranges where the quality acceptance criteria (critical quality attributes, CQAs) are fulfilled. Current design space development along QbD principles focuses on the investigation of statistical CPP/CQA interactions, while the biological mechanistic of this interaction is hardly considered. Furthermore, the plethora of available online and offline data gathered within design space development is typically not used for the demonstration of process understanding. Here we present a methodology about how typical recorded process data can be processed and used to gather mechanistic process knowledge within upstream design space development, without the need for further experiments or additional analytical procedures. Data derived from online and offline measurements (off gas quantification, air flows, substrate flows, biomass dry cell weight measurements) were processed into scale-independent information in the form of specific rates and yield coefficients (data processing). Subsequently, the obtained information was regressed with the investigated process parameters aiming at the investigation of mechanistic interactions (information processing). The power of the presented approach was demonstrated on a multivariate study involving two process parameters (induction phase temperature and induction phase feeding strategy) aiming at the production of recombinant product in an Escherichia coli K12 strain. The knowledge successfully extracted indicated a time dependency of the metabolic load posed on the system, a possible down regulation of the promoter at reduced temperatures, and reduced cell lysis at higher specific feeding regimes. The presented data and information processing methodology for mechanistic process knowledge extraction is fully complementary to the task of design space development for QbD submissions and can serve as the basis of mechanistic modeling.
LAY ABSTRACT: Manufacturing of pharmaceuticals intended for human use is under tight control of government authorities. To further improve product quality and allow more manufacturing flexibility, government agencies started to encourage manufactures to investigate and understand their manufacturing processes scientifically. This should lead to quality by design (QbD), hence a manufacturing that is so well understood that final product quality can be guaranteed by the manufacturing process itself.
- Quality by design
- Process development
- Process optimization
- Multivariate data analysis
- Design of experiments
- Design space development
- Data processing
- Information processing
Pharmaceutical production processes are submitted to unintended changes, for example, changes of raw materials or changes within manufacturing. QbD demands to investigate the impact of these changes on pharmaceutical product quality.
As regards biopharmaceuticals (pharmaceutical products that are produced using living organisms), a change within manufacturing affects the living organism used for the production of the drug. This can lead to poor pharmaceutical product quality. Following QbD principles, these changes of the physiology of the living organisms need to be described and investigated.
In this contribution we provide a methodology about how physiological changes of living organisms can be described and investigated within process development along QbD principles.
This aims at increased understanding of biopharmaceutical manufacturing processes and lays the basis for process and drug quality improvements.
1. Introduction
1.1. Quality by Design (QbD)
According to the International Conference on the Harmonization of Technical Requirements for Registration of Pharmaceuticals for Human Use (ICH) Q8 definition, “quality should be built-in or should be by design” rather than “tested into products” (1). This constitutes a major change in pharmaceutical development, replacing the very product-centered, traditional approaches with the more process-focused and risk-based QbD approach. For the manufacturers, this opened new perspectives regarding the introduction of more flexible and cost effective processes.
Key demand from the side of the regulatory bodies is the science-based proof of process understanding (2), achieved through sound pharmaceutical development. Following this major move towards more science for process and product understanding, several guidelines have been published, presenting a new leading strategy (1, 3): Based on the quality target product profile, which summarizes the quality characteristics of the product, all properties of the drug product affecting its quality are to be identified (critical quality attributes, CQAs). Process understanding is achieved, if the multivariate interactions between process parameters and the critical quality attributes are scientifically analyzed. If the variation of a parameter has an impact on a critical quality attribute, it is called a critical process parameter (CPP). If the manufacturer is able to provide evidence that the CPPs are scientifically identified in course of process development and controlled alongside the manufacturing process, there is the possibility for real-time release, circumventing final product testing (4).
A major milestone for putting QbD into pharmaceutical practice was the introduction of design space (1). The establishment of a design space includes the clear differentiation between critical and non-critical CPPs, followed by the scientific investigation of the multivariate interdependencies between the CPPs and the CQAs. Besides the possibility of real-time release testing, the enhanced process and product knowledge gained through QbD can pave the way for more efficient and economical manufacturing processes, reducing product recall compliance procedures and post-approval modifications of change (5).
1.2. The Impact of Process Parameters on the Biological System Precedes the Change in Product Quality
Current design space developing practice for biopharmaceutical upstream processes involves risk assessment for the identification of CPPs followed by (multivariate) experimentation efforts for the investigation of the CPP's impact on product quality, as illustrated by several excellent recent publications (6⇓⇓⇓⇓⇓⇓⇓⇓–15). Simplistically speaking, experiments are conducted along a statistical experimental design with changing levels of CPPs. For each individual experiment, (multiple) process outcomes that stand in connection to product quality (CQAs) are measured. The design space is developed by regression of the fixed CPPs (factors) with the measured CQAs (responses). This allows the estimation of multivariate interdependencies of process parameters for the sound estimation of product quality while working within the investigated space of CPPs (design space).
However, one has to consider that the knowledge displayed in the design space, which is suggested to be part of the Chemistry, Manufacturing, and Controls (CMC) file within regulatory submissions of QbD processes (16), is derived from a statistical regression and is therefore of a pure statistical nature. At this point the question arises whether this statistical understanding of the investigated system is sufficient for QbD submissions. Recent contributions (17) suggest otherwise. Hence, strategies are needed to fulfill the regulatory demand of process understanding beyond statistical regressions for QbD submissions.
By default, process developers are forced to a process-outside perspective. Process parameters such as pH, feeding strategy, dissolved oxygen, nutrient supplements, and others are the screws to turn from the outside; product titer and product quality are the variables measured by process developers and act as the observed effects of the initiated change. The design space carries the information of what happens to product quality in case one or multiple screws are turned. However, it does not carry the information of what happens to the individual production units—the cells—in case a process parameter is changed.
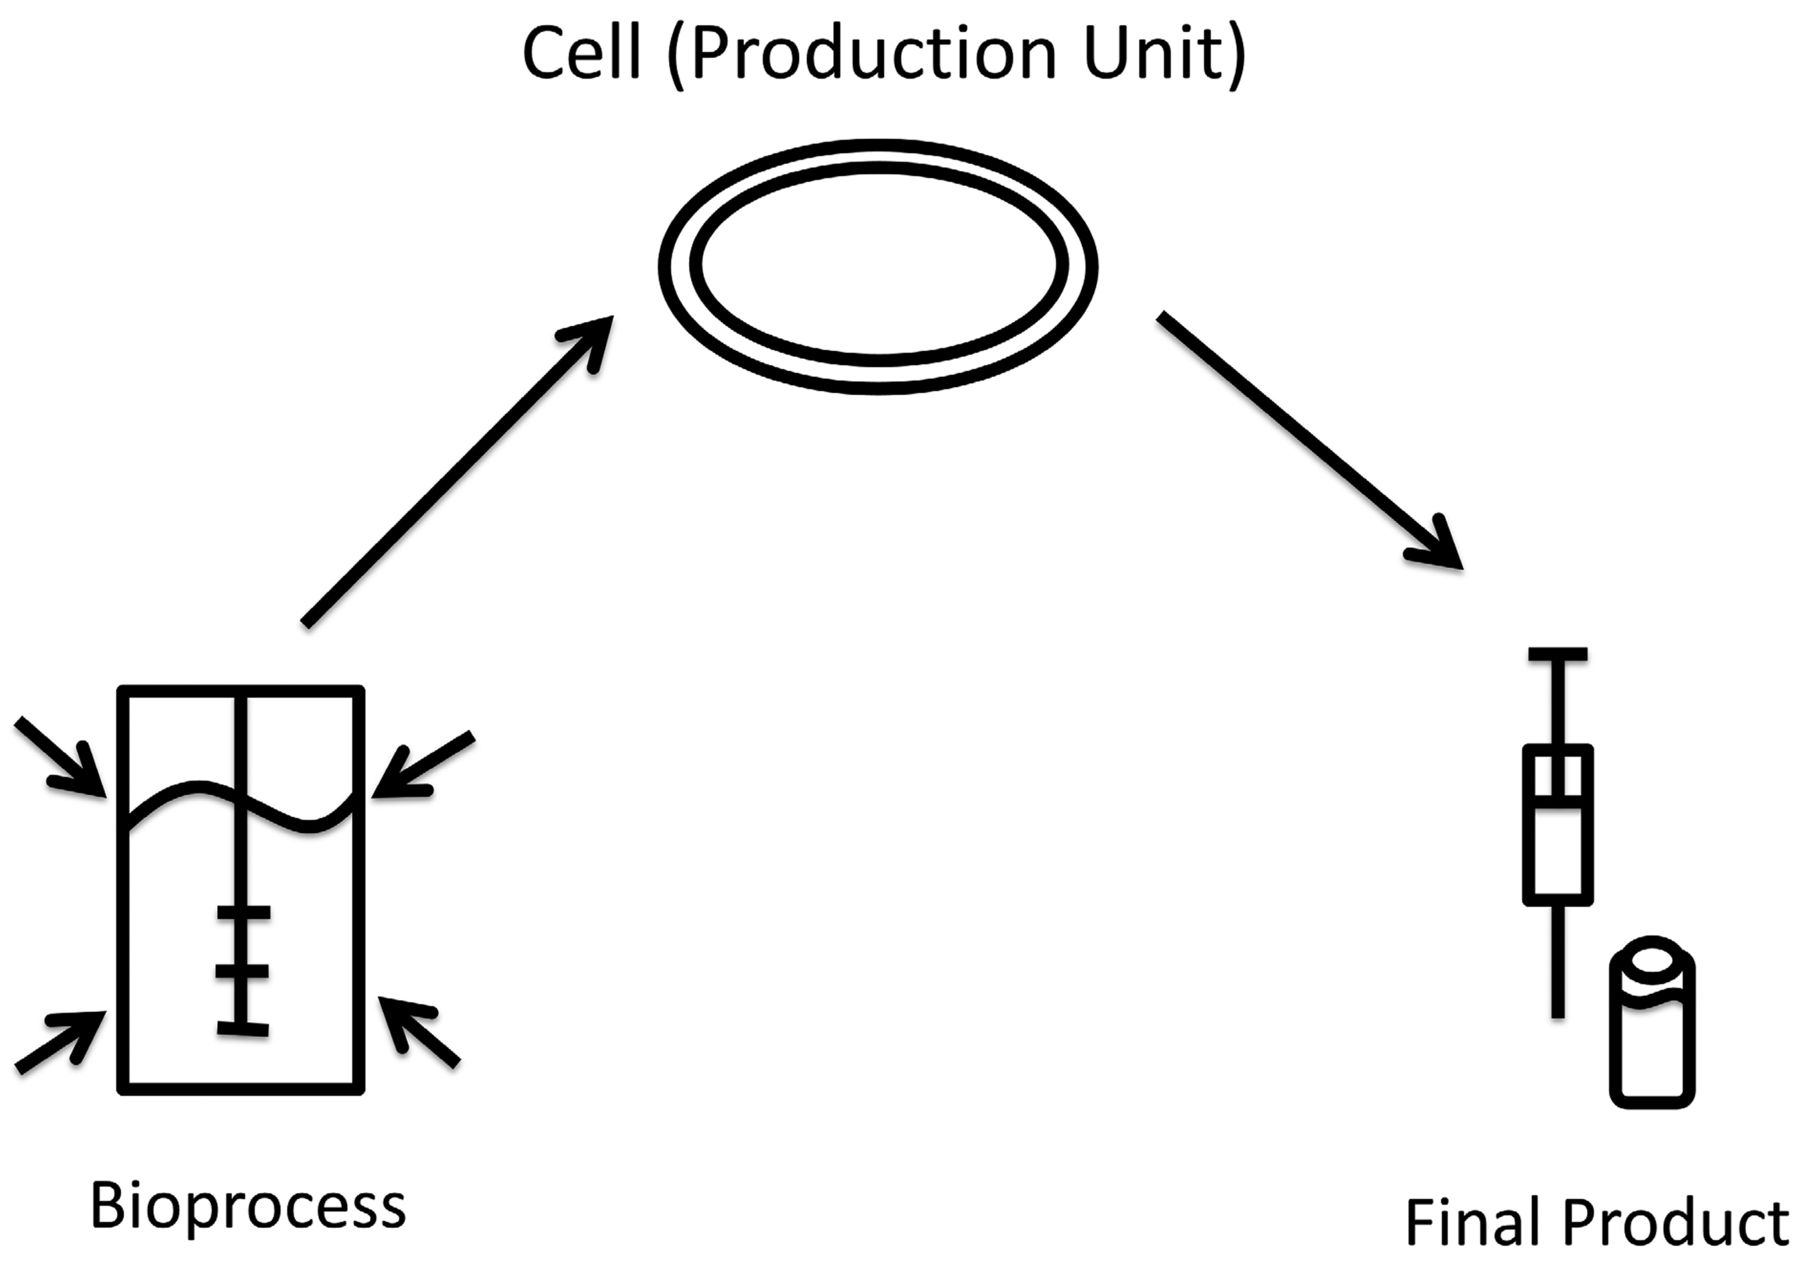
Taking on the perspective of the individual cell factory, a change of a process parameter first initiates a change in the cell's physiological state, which results in a change in product quality or quality. Once the macroscopic system bioprocess is deflected by a change in process parameters, the cell population (production units) responds to the environmental change. This adaptation to new conditions constitutes a change of the physiological status of the cells that might affect final product quality and quantity. This basic thought is illustrated in Figure 1.

Changes in cell physiology precedes changes in final drug product quality. Changes in process parameters (bioreactor) induce changes in cell physiology (cell) which can result in changes in drug product quality (syringe).
To achieve further insight into the underlying processes that result in changes of product quality, strategies are needed to describe and investigate the impact of process parameters on the cell population. However, the development of mechanistic and first-principle models as highest level of process understanding is considered difficult along design of experiments (DOE)-based process development (18).
This contribution aims at providing a data and information processing methodology that can be applied along design space development aiming at the extraction of causal relationships between physiological state descriptors and quality attributes without the need for further experiments or elaborate analytical methods.
1.3. Description of the Physiological Cell State by Means of Specific Rates and Yield Coefficients
Identifying the process parameter's impact on the cell state presupposes a proper description of the cell state. Modern molecular biology, biochemistry, and gene technology provide a number of techniques for the description of what can be referred to as cell state. From a scientific point of view, detailed cell state description can be given by systems biology (19). Although science is in fast progress, elaborate studies in these fields for the investigation of CPP/CQA interactions within routine process development are out of reach in the foreseen future. Another alternative for the description of the cell state are marker molecules, for example, ppGpp as a marker molecule for the stringent response in bacteria (20). However, marker molecules for the accurate description of the cell state are rare, platform-dependent, and their unambiguity is doubtful. The calculation of specific rates and yield coefficients from offline and online data poses a valuable alternative for the description of the physiological state of the cell (21⇓–23). Defining the cell wall as the system boundary, substrate, metabolite, and gas component rates can be calculated, and this can carry information on changes in metabolic activity. These material fluxes crossing the cell are easily accessible by means of standard analytical equipment (off-gas analyzer, mass flow controllers, and balances for the quantification of liquid flows) and constants determined prior to the fermentation process (feed substrate concentration, base molarity, and the elemental composition of the biomass). Following a rate-based description of the cell state, physiological information in the form of specific rates and yields can be extracted. These descriptors carry information on physiological changes: Changes in biomass yield coefficients, respiratory rates, specific growth, as well as specific substrate uptake rates are reported to stand in correlation with the direction of cell resources towards heterologous gene expression (24). Furthermore, specific rates and yield coefficients were used for the description of cell adaptation to available substrates (25, 26) and for the quantification of transient effects on a recombinant expression system (23), and these coeficients were identified as physiological parameters for efficient feeding profile optimization (27). A detailed description of methods for quantitative process evaluation is given elsewhere (22, 28).
Due to their scale independence and fundamental connection to the cell's primary metabolism, specific rates and yield coefficients are qualified to be considered as physiological state descriptors (information), in contrast to the feed-gas, biomass, and off-gas data from which they are derived.
1.4. Data and Information Processing along Design Space Development: Investigating the Mechanistic Properties of CPP/CQA Interactions
The proposed methodology (complementary to design space development) is composed of two parts: (a) the processing of feed-gas, biomass, and off-gas data into state descriptors (data processing); and (b) the subsequent multivariate linear regression of the obtained state descriptors with the CPPs investigated within design space development (information processing).
Data processing involves the calculation of specific rates and yield coefficients (physiological state descriptors) from readily available online (off-gas analysis, balances) and offline data (extracellular protein concentration, biomass dry weight) for each run of the multivariate study. The data necessary for data processing (feed quantification, off-gas analysis, quantification of gas fluxes) is routinely recorded in bioprocess development. Hence, the extraction of information (specific rates and yield coefficients) from data is solely a calculation exercise and does not demand the conduction of further experiments or the establishment of elaborate analytical procedures.
As a result of a multivariate study, the statistical regression between CQAs and CPPs yields the design space. Data processing results in specific rates and yield coefficients (physiological state descriptors) for each fermentation run of the multivariate study. In analogy to the CQA/CPP regression performed for the establishment of the design space, CPPs can also be regressed with specific rates and yields, where the CPPs serve as factors and specific rates and yields as responses (information processing). The concept of this approach is illustrated in Figure 2.

Design space development involves the regression of predefined CPPs with measured CQAs. Next no CQAs, physiological state descriptors (e.g., specific rates and yield coefficients) can be obtained from each DOE run, processing data into information. Investigation of the multivariate interactions between physiological state descriptors and CPPs possibly contributes to process understanding, allowing the physiological interpretation of the design space and process productivity (process understanding).
In course of this contribution this newly developed exploratory strategy for the rate-based exploitation of multivariate data along design space development is exemplified on a recombinant Escherichia coli K12 process for the production of a recombinant product.
2. Materials and Methods
2.1. Strain
A recombinant Escherichia coli K12 strain was used.
2.2. Media
A defined medium according to Wilms et al. was used (29).
2.3. Bioreactor Setup
The multiple fed-batch runs were performed on a Techfors-S pilot bioreactor (Infors, Bottmingen, Switzerland). Quantification of base and substrate feeding was achieved gravimetrically. Base and feed solutions were placed on balances (Sartorius, Göttingen, Germany) and the weight loss was recorded. A peristaltic analogue pump (Lambda, Baar, Switzerland) assembled with silicon tubing was used for feed addition. Base addition was achieved via the Techfors-S integrated digital peristaltic pump. The ports on the top plate of the reactor were used for a dissolved oxygen sensor (Hamilton, Reno, Nevada, USA), pH probe (Hamilton, Reno, Nevada, USA), pressure sensor (Keller, Winterthur, Switzerland), and a septum and an overpressure valve (Infors, Bottmingen Switzerland). CO2 and O2 quantification in the off-gas stream was conducted via a gas analyzing unit (Müller Systems AG, Egg, Switzerland) based on nondispersive infrared (NDIR) (CO2) and paramagnetic (O2) principles. All the signals were recorded by the process management system Lucullus (Secure Cell, Schlieren, Switzerland).
2.4. Fermentation Parameters
The fermentation process followed the industrial two-step fermentation strategy. Fist, a pre-culture was grown in a 1000 mL baffled Erlenmeyer flask containing 70 mL of pre-culture medium for 8 h at 35 °C. After inoculation of the batch medium (20 g/L C-source), the C-source in the batch medium was consumed within 12 h. At the time point when the CO2 off-gas signal started to decrease, an exponential fed-batch for the accumulation of biomass was started. After the fed-batch, the culture was induced. In dependence on the performed experiment, the post-induction feed was carried out linear, exponential, or negative exponential. For the latter the positive exponential feed was mirrored to the down side. Dissolved oxygen levels (DO2) were kept over 20% (100% were set before inoculation at 35 °C, 0.3 bar gauge). The pH was kept constant by adding 12.5% NH4OH, which also served as nitrogen source.
Equation 1: Calculation of the positive exponential induction phase feed rate. The induction phase feed exponent was included in the DOE.


Equation 2: Calculation of the negative exponential feed rate: the positive exponential feed was mirrored to the down side.

2.5. Analytical Methods
2.5.1. Biomass Dry Weight Concentration:
After centrifugation (RZB 5171, 10 min, 4 °C) of 2 mL of the cell suspension in pre-weighted glass tubes, the supernatant was decanted and frozen at −20 °C for further analysis. The pellets were washed twice using distilled water and dried at 95 °C for 72 h. The biomass dry weight concentration was determined in duplicate.
2.5.2. Product Activity:
Cell rupture was carried out via high-pressure homogenization (700 bar, 11 passages). Intracellular product activity was determined by an enzymatic activity assay.
2.5.3. Protein and Metabolite Concentrations:
Acetate and glycerol concentrations in the supernatant were determined photometrically using commercial assay kits (Enzytec fluid acetate test kit, number 5226; Enzytec fluid glycerol test kit, number 5360), which were implemented in the CuBiAn© XC analytical robot. Because no significant amounts were detected, the supernatant was cross-checked for metabolites using high-performance liquid chromatography analysis (Supelcogel C-610, Sigma Aldrich, St. Louis, Missouri, USA). Extracellular protein concentration was measured using the Bicinchoninic Acid Kit for Protein Determination (BCA1-1KT, Sigma Aldrich, St. Louis, Missouri, USA,) with bovine serum albumin as standard.
2.6. Design of Experiments (DOE)
2.6.1. Definition of the CQA and CPPs:
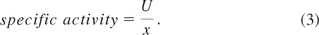
The identification of CPPs for biopharmaceutical processes via risk assessment is addressed elsewhere (7, 13) and not in focus of this contribution. The specific activity, the fraction of obtained volumetric activity (U/mL) by the volumetric biomass dry weight concentration (g/L), was chosen as the potential CQA:
Equation 3: The specific activity [volumetric activity (U)/biomass concentration (x)] was defined as the CQA.


For the cause of this study, two presumptive CPPs for the induction phase were the focus of investigation: the induction phase feeding strategy and the induction phase temperature. In recombinant protein production, the induction temperature possibly affects recombinant protein expression levels, inclusion body formation, the activity of proteases, as well as the metabolic load posed on the system (30). The applied feeding strategy is reported to affect inclusion body formation (30) as well as the extent of induction-phase carbon depletion (30, 31). Applying a positive exponential feeding strategy counteracts the effects of progressive carbon depletion, whereas inclusion body formation is possibly enhanced. Hence, next to a positive exponential feeding strategy, a linear as well as a negative exponential feeding strategy was applied. Effects detrimental for intracellular protein production such as proteolysis (30), protein leakiness through the outer cell wall (32), carbon depletion, as well as plasmid loss are also reported to be feed strategy–dependent (31).
2.6.2. Experimental Design:
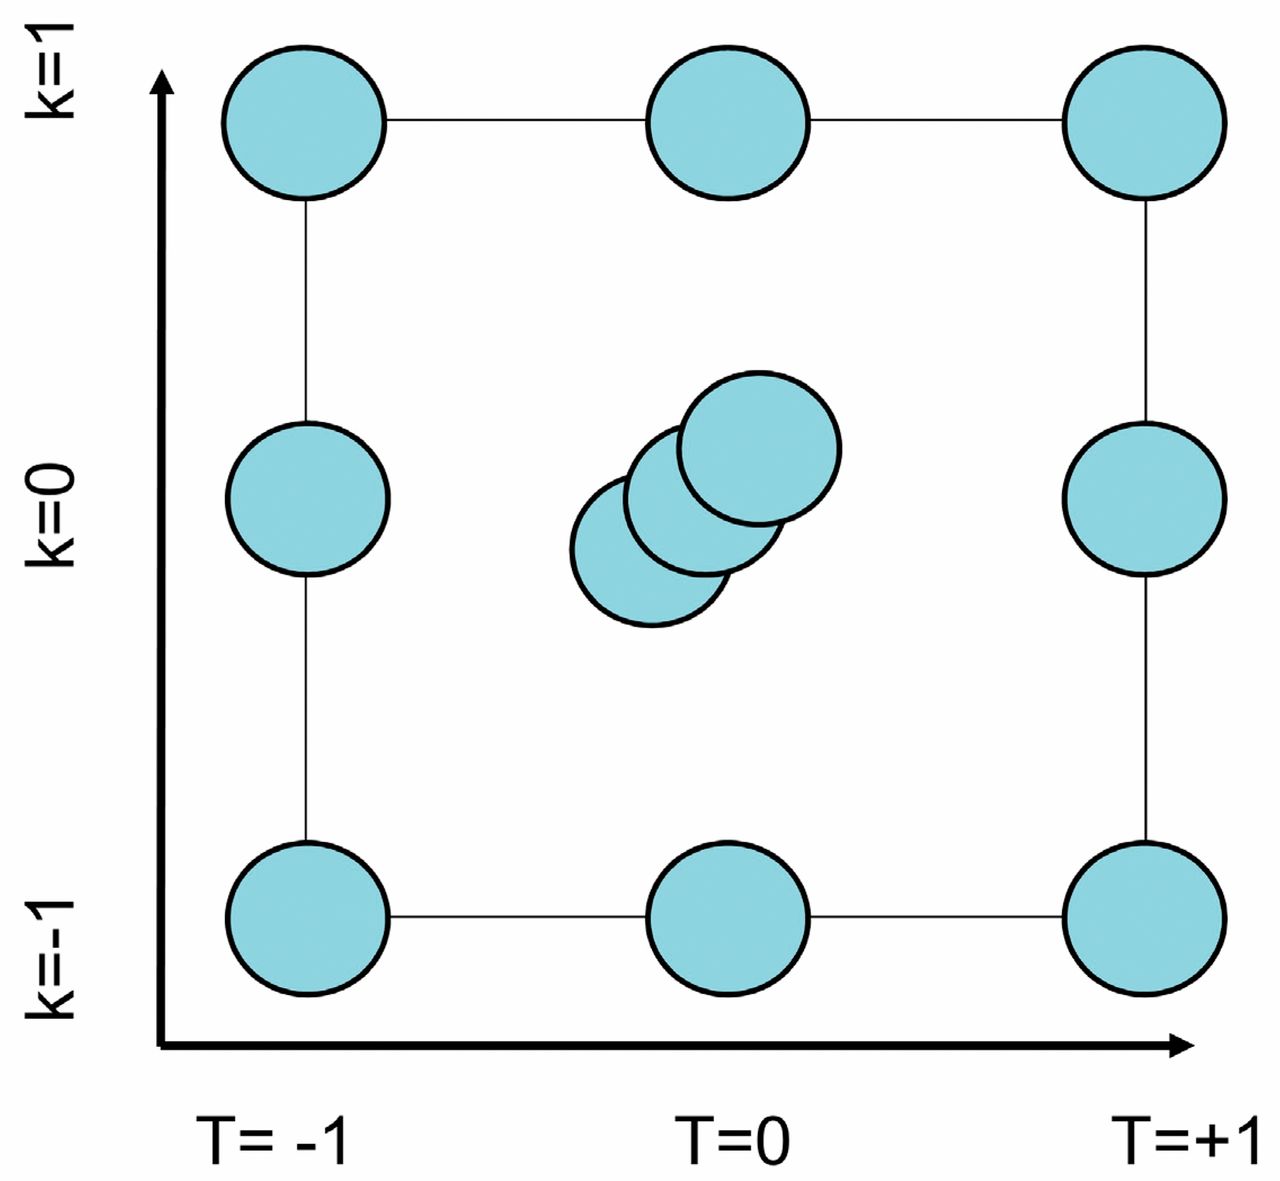
The establishment the design space involves the investigation of CPP interactions and therefore demands the use of multivariate statistical experimental design. For the investigation of two factors aiming at response surface modeling, nine independent experiments are needed. The experimental design (see Figure 3) served as the experimental basis for the formulation of the design as well as for the subsequent data exploitation methodology. Each point illustrates one fermentation run with fixed parameters. The center point was performed in triplicate for the estimation of the experimental error, resulting in a total number of 11 fermentation runs. Model development and statistical model evaluation was done using the software Modde (Umetrics, Umeå, Sweden).

The orthogonal experimental design involved the variation of induction phase temperature as well as the variation of the induction phase feeding strategy, expressed as the feeding exponent k. Each circle represents one individual fermentation run. The center point was performed in triplicate, illustrated as three superimposed circles.
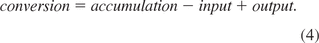
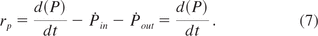
2.6.3. Data Processing:
Rate-based quantitative data processing is described in detail elsewhere (21, 22, 28). In short, conversion rates (r) for biomass (X), substrate (S), carbon dioxide (CO2), and oxygen (O2), as well as extracellular metabolites/products can be obtained from the general material balance:
Equation 4: General material balance
Assuming no substrate accumulation and substrate-limited conditions, the conversion rates can be calculated as follows for fed batch processes:
Equation 5: Substrate conversion
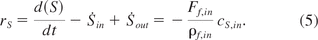
For fed-batch processes, the outflow term S˙out is zero and the accumulation term d(S)dt can be neglected, as substrate limiting conditions are assumed. Hence, the conversion rate rS is only dependent on the inflow term S˙in and can be calculated on the basis of the feed rate.
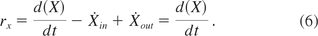
Similarly, biomass conversion can be calculated on the basis of biomass dry cell weight measurements:
Equation 6: Biomass conversion
Conversion of extracellular protein can be calculated as follows:
Equation 7: Extracellular protein conversion
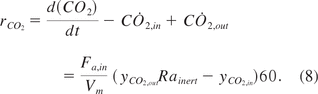
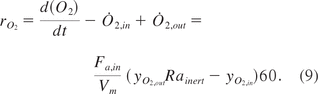
Assuming the availability of a gas analyzer and gas-flux quantification, conversion rates for gas phase components can be calculated as follows:
Equation 8: Conversion rate for carbon dioxide
Equation 9: Conversion rate for oxygen
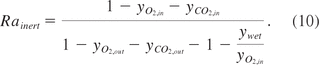
In order to account for water vapor dilution and CO2 evolution as well as O2 consumption, the gas-influx needs to be corrected by the inert gas ratio:
Equation 10: Inert gas ratio
On the basis of the rate calculation, specific rates and yields can be obtained as follows:
Equation 11: Calculation of yields
Equation 12: Calculation of specific rates

2.6.4. Information Processing:
Following the DOE for the development of the design space, multivariate data analysis according to the presented strategy (regression of specific rates and yields with CPPs) was performed for the investigation of CPP/CQA interactions. Next to the CPPs under investigation, the impact of time after induction served as a factor to identify time effects. Specific rates and yields (carbon dioxide/substrate yield coefficient YCO2/s, biomass/substrate yield coefficient Yx/s, specific protein release rate qp) served as responses.
3. Results
3.1. Design Space Development
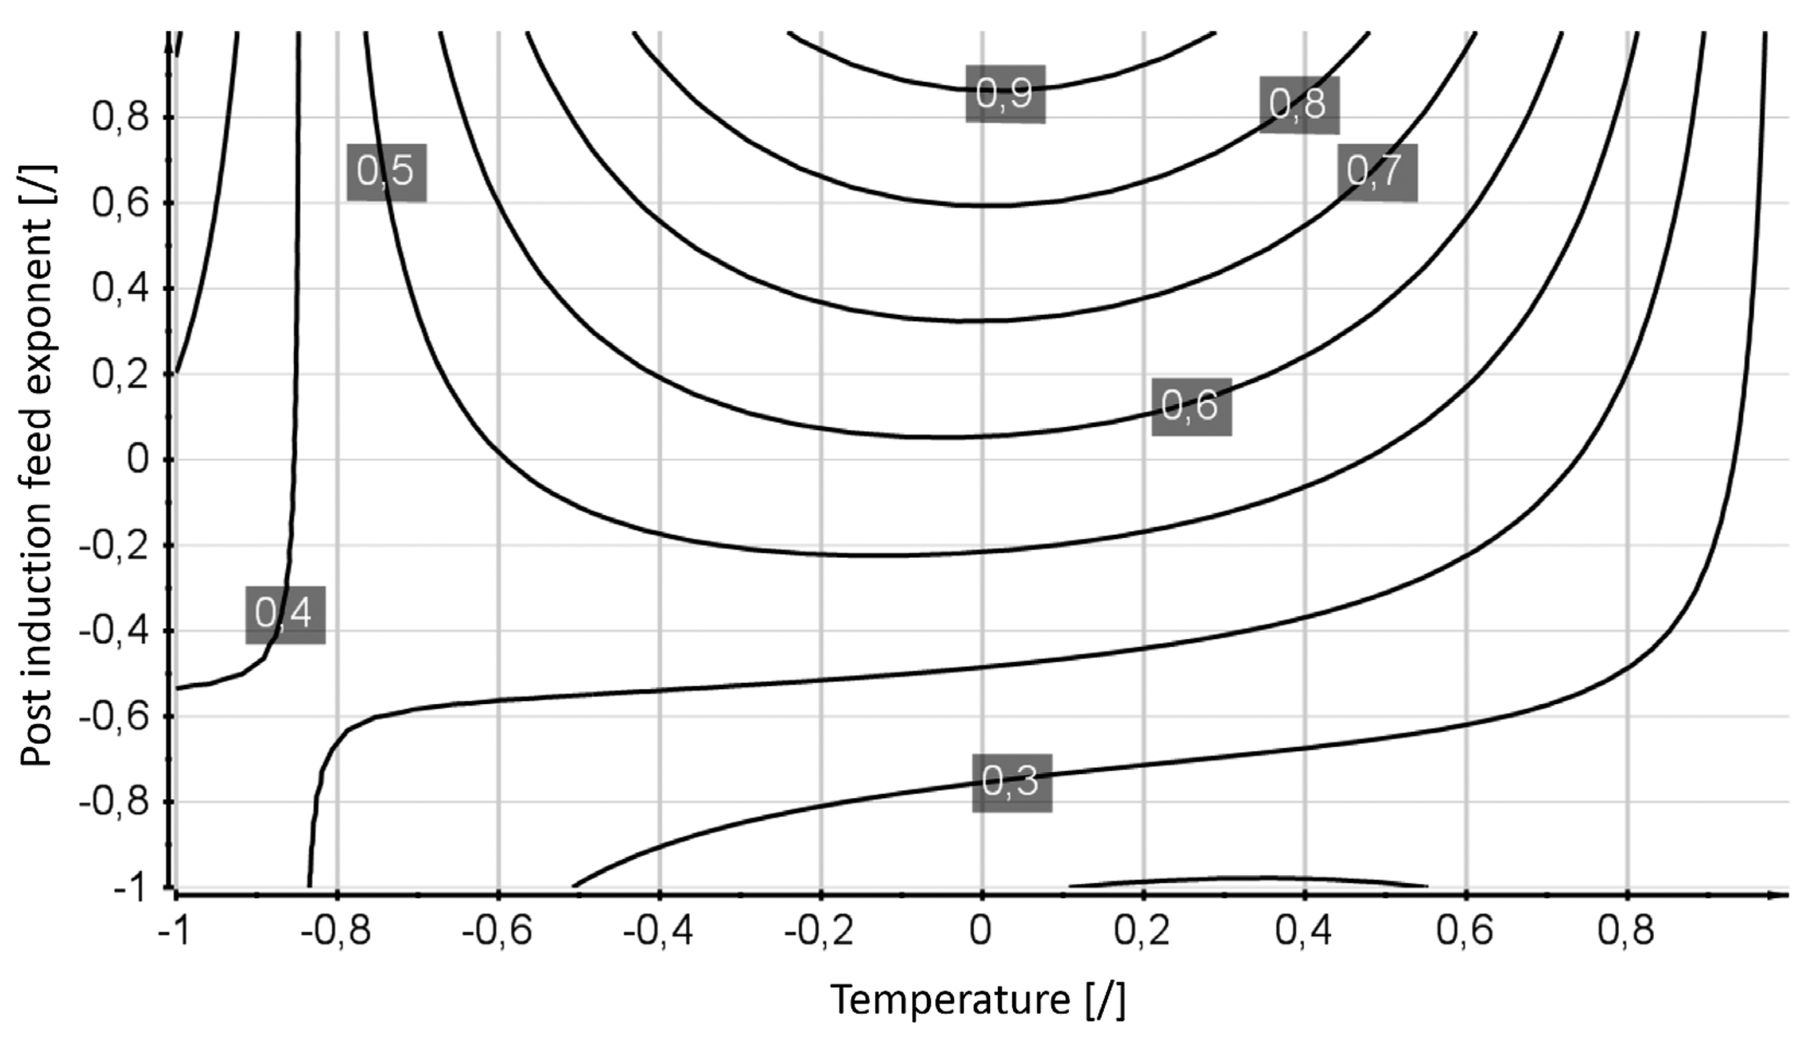
The calculated specific activity (CQA) of the DOE fermentation runs were multilinearly regressed with the CPP induction temperature and induction phase feeding strategy expressed as the feed rate exponent k. Evaluation of the regression model revealed the post-induction feed exponent k as well as temperature as significant model terms. The obtained model is displayed in Figure 4. Induction temperature was considered with a linear and a quadratic term in the model, although only the quadratic term was found to be significant. The linear term cannot be dismissed due to the hierarchic structure of the model. The induction phase feed strategy, expressed as the feed exponent k, was found to have a strong influence on the CQA and was included as linear term. The most prominent interaction term was found to be the interaction of the quadratic temperature and the induction phase feeding exponent. The basic model statistics are as follows: The future prediction precision (Q2) was computed as 0.62, the regression coefficient R2 as 0.68, the batch replicate reproducibility as 0.77, and the model validity (test if model error can be explained by the batch replicate error) as 0.48. No significant model problems were identified. The multivariate study resulted in the detection of a process optimum at a normalized temperature level of 0, applying a positive exponential (normalized k level of +1) feed strategy. The low predictive capability of the obtained model (Q2 of 0.62) can be attributed to a low batch-to-batch reproducibility (reproducibility of 0.77).

Contour plot of the design space model obtained. Normalized induction temperature [/] is plotted on the x-axis; the normalized induction phase feeding exponent k [/] is plotted on the y-axis. Isolines indicate the obtained recombinant product activities given in kU/mL.
3.2. Multivariate Data Analysis along Design Space Development: Regression of Specific Rates and Yields with CPPs
For each fermentation run, condensed information in the form of specific rates and yields was calculated, that can be considered a response of the biological system to the CPPs' induction phase temperature and induction phase feed strategy. This section deals with the identification and quantification of the CPPs' impact on specific rates and yield coefficients. The timely resolution of the applied data processing method allowed the inclusion of the factor time after induction.
3.2.1. Analysis of CPP Interactions with the Extracellular Protein Rate qp:
Extracellular protein was detected, which can be attributed to cell lysis (29, 33). The specific protein release rate for all fermentations was calculated (eq 7, eq 12). Multivariate data analysis identified the post-induction feeding exponent k as the sole significant influential factor. Modeling the specific protein release rate as a function of k yielded a prediction precision (Q2) of 0.32, a regression coefficient (R2) of 0.52, a model validity of 0.78, and a reproducibility of 0.67.
3.2.2. Analysis of CPP Interactions with the Carbon Dioxide Yield Y(CO2/s):
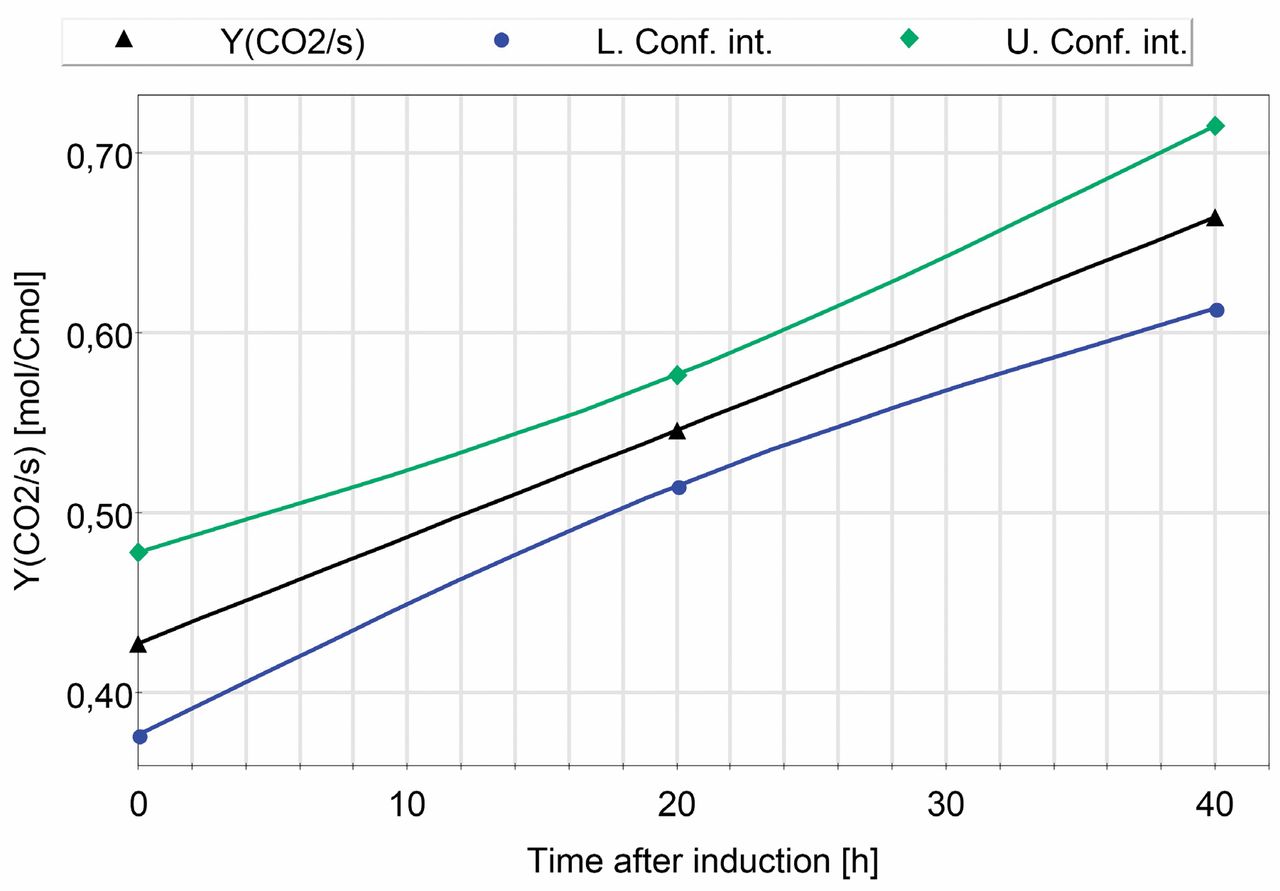
The carbon dioxide yield Y(CO2/s) was set as response of a multivariate analysis with induction phase temperature and induction phase feed profile as well as induction time as factors. One hour averages at the induction time points t = 20 and t = 40 h after induction were calculated from the processed data of all fermentation runs. The carbon dioxide yield at t = 0 represents the carbon dioxide yield of the non-induced fed-batch. Multilinear regression model evaluation identified induction time as the sole influential factor. The obtained model is displayed in Figure 5. No interaction with the CPP induction phase temperature and induction phase feeding exponent was detected. A future prediction precision (Q2) of 0.64, a regression coefficient (R2) of 0.72, a model validity of 0.904, and a reproducibility of 0.64 was obtained.

Prediction plot: The carbon dioxide yield YCO2/s [mol/Cmol] as a function of induction time (triangles). The upper (diamonds) and the lower (circles) confidence interval for the model with a confidence level of 0.95 are included in the plot.
3.2.3. Analysis of the CPP Interactions with the Biomass Yield Y(x/s):
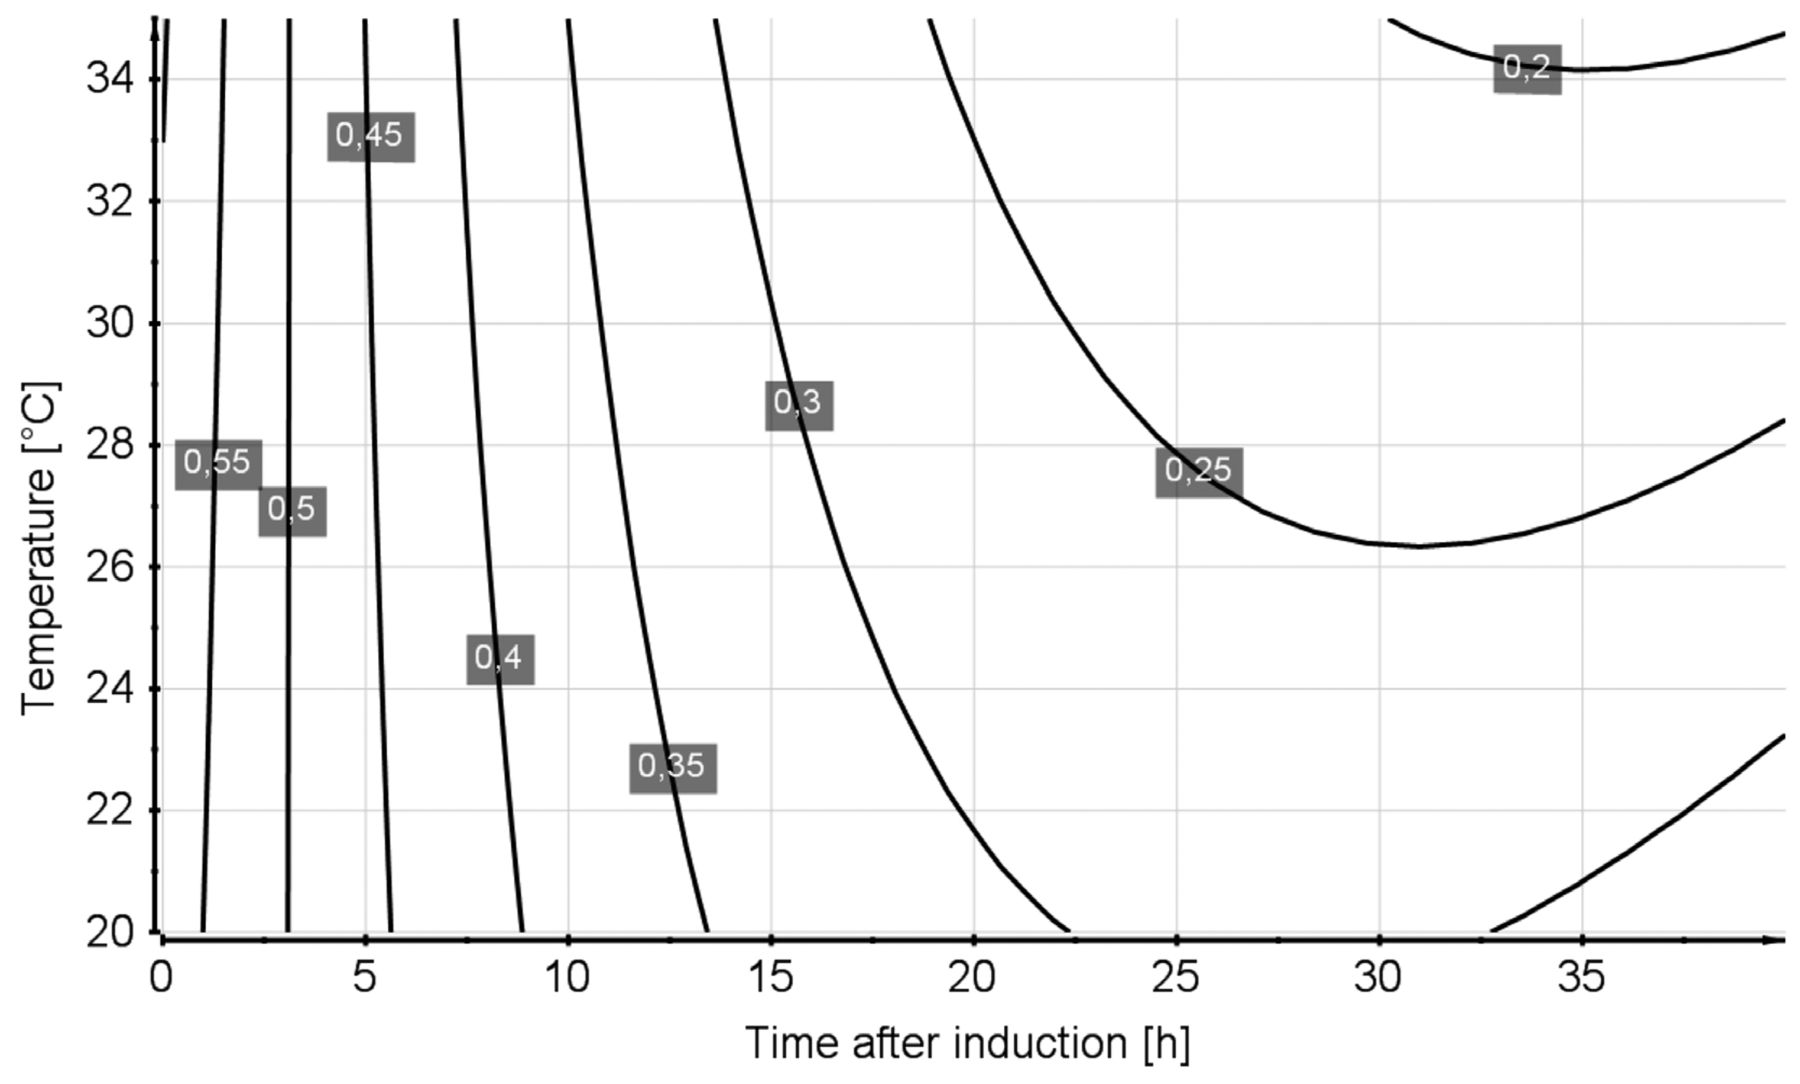
In analogy to the carbon dioxide yield, the biomass yield Yx/s was investigated as a function of induction time, temperature, and post-induction feed exponent. The biomass yield at t = 0 represents the biomass yield in the non-induced fed-batch. Model evaluation revealed induction time and induction temperature as well as the interaction term (time∗temperature) as significant factors. For the regression model, induction time and induction temperature were included as linear terms. Furthermore, induction time as a quadratic term, as well as the interaction term of induction time and induction temperature, was included in the model. Figure 6 displays the obtained model as contour plot. The induction phase feed exponent k was found to be nonsignificant. The obtained model showed a regression coefficient (R2) of 0.92, a future prediction precision (Q2) of 0.82, a model validity of 0.94, and reproducibility of 0.84. Reducing the induction phase temperatures had a positive effect on the obtained induction phase biomass yield Y(x/s). Furthermore, Y(x/s) was found to decrease as a cause of induction time.

Contour plot for the Yx/s model obtained. Time after induction time is given on the x-axis, induction temperature on the y-axis. Isolines are labelled with the Yx/s given in Cmol/Cmol.
4. Discussion
4.1. Development of A Design Space
Design space development followed the contemporary perception of quality by design for upstream processes: A DOE was executed and a predefined CQA was measured, followed by multilinear regression of factors (CPPs) with the respective response (CQA). The outcome of this approach was a mathematical model that displays the CQA as a function of the CPPs. The process performed best at an induction of temperature of normalized 0 and a positive exponential feed exponent of normalized +1. Following the contemporary perception of design space development, process knowledge is solely demonstrated by the presentation of the design space, intrinsically the multivariate regression of CQAs and CPPs. The amount of data necessary for the formulation of the design space is remarkably low and stands in high contrast to the richness of data routinely recorded during process development, including off-gas analysis, feed and base quantification, as well as offline measurements.
4.2. Data Exploitation Methodology for Design Space Understanding
As a cause of the presented data exploitation methodology, the recorded data was processed into specific rates and yield coefficients. In the next step, knowledge about the CPPs' impact on the biological system was gathered by means of multilinear regression of specific rates and yields with the CPPs investigated as a cause of the DOE (information processing). This methodology lays the basis for the following discussion aiming at a mechanistic understanding of the design space.
4.2.1. Impact of the Feed Strategy on the Biological System:
The presence of high amounts of extracellular protein indicates cell lysis, as E. coli K12 possesses no secretion pathways (34). From the design space we obtained the information that the induction phase feeding exponent k had a positive effect on the specific intracellular activities obtained within the induction phase. Information processing identified the feeding exponent k as the sole significant influential factor for specific protein release rate. It can be concluded that higher product levels are achieved at higher feeding regimes due to less loss of intracellular product to the extracellular space.
Cell lysis is reported for induced systems (29). Cell stress as the result of progressive carbon depletion as well as the metabolic load posed on the system as a cause of induction can probably be considered to be responsible for unspecific protein release. The reported negative effects of progressive carbon depletion in the induction phase include the activation of the carbon stress system, cell segregation (35), as well as a reduction in RNA polymerase and ribosome content (36).
The low reproducibility (0.67) of cell lysis–related protein release and its mechanistic connection to the CQA intracellular specific activity makes it likely that the high batch-to-batch variation in the system is connected to the low reproducibility of cell lysis (loss of intracellular product to the medium).
4.2.2. Can the Carbon Dioxide Yield Be Exploited for A Control Strategy?:
Because high amounts of protein were found to be released to the medium but no other metabolites were detected in significant amounts, the question arose whether other cell components such as free amino acids and sugars are reused by the remaining viable cell population. Hypothetically, this should result in an increased CO2/s yield referred to the substrate added, as the released cell components constitute a second substrate. In terms of process analytical technology (PAT), the CO2/s yield represents a robust, online-accessible because CO2 off-gas analysis and feed quantification is routinely achieved in industrial fermentation processes. However, the effect of temperature and post-induction k, as well as their interdependencies with time, were found to be nonsignificant. Only the induction time as linear term was needed to fit the model. No correlation between CPPs and the CO2/s yield was detected; hence no control strategy can be constructed upon this readily accessible yield. Furthermore, the changes in yield coefficients discards soft-sensing modeling approaches based on fixed yield coefficients.
The finding that the CO2/s yield is neither dependent upon temperature nor the post exponential feeding exponent k, from which the latter was found to influence cell lysis, allows the conclusion that no or just few of the components released from the cell are reused from the viable cell population, possibly due to the simple absence of free amino acids and metabolites in significant amounts. The rise in the CO2/s yield indicates an increase in the cell's respiratory activity. No significant change in the respiratory quotient RQ (YCO2/s/YO2/s, data not shown) underpins this finding. The observed change in the metabolic flux distributions was found to be a pure time effect, probably due to an increase in the metabolic load posed on the system as a consequence of recombinant protein production.
4.2.3. Time Dependency of the Energy Metabolism of the Induced System:
The obtained knowledge suggests that the energy demand of the induced culture is strongly dependent upon time after induction. The already discussed time dependency of the CO2/s yield underpins this finding, which is also reflected by the decrease in biomass yield. It seems that the system is increasingly subjected to the effects of metabolic load; hence the direction of resources towards the promoter related activities (37). This goes along with an increase in stress protein concentrations as well as a decrease in metabolic enzyme concentrations (38). The biochemistry of the cell is possibly also submitted to the consequences of a stringent response triggered by the induction and subsequent carbon depletion, which is also reported to go along with increased concentrations of intracellular proteases (39).
4.2.4. Induction Phase Temperature as A Possible Adjustment Screw for the Expression System:
Highest active recombinant protein activities were observed at medium temperatures. Information processing revealed a linear correlation between biomass yield coefficient and temperature; higher biomass yield coefficients are found at low temperatures. Hence, a higher fraction of substrate is directed towards biomass formation at lower temperatures.
Protein synthesis capacity of native as well as recombinant proteins in E. coli is determined by the number of functioning ribosomes and the ribosome translation rate and protein degradation (40). In a carbon limited system the finding that more resources are directed towards biomass at reduced temperatures indicates that a higher fraction of the protein synthesis capacity is used for the synthesis of native proteins which are necessary for cell growth. The transcription rate of recombinant DNA seems to be reduced to a higher extent than the transcription rate of native proteins, possibly due to a down regulation of the promoter at reduced temperatures. Hence, the flux of cell resources to promoter-related activities can possibly be regulated by means of induction phase temperature in the investigated system.
4.2.5. Promoter Down Regulation Positively Affects Active Protein Formation:
The evaluation of the specific protein release rate/cell lysis contributed to the understanding of the high specific activities achieved at high feeding regimes. Furthermore, the discussion of temperature dependency of the biomass yield indicated a possible down regulation of the recombinant protein transcription rate at reduced temperatures. However, the observation that high activities are achieved at medium temperatures remains unresolved.
The target product demands translocation to the periplasmatic space via a transportation system. Translocation systems are sensitive to overload: Possible shortages in transport proteins involved as well as shortages of folding modulators can lead to the cytoplasmatic accumulation of inactive protein in form of inclusion bodies (30).
The investigation of the biomass yield revealed that the induction temperature is possibly connected to the level of recombinant protein expression. For a maximum of product, a moderate down regulation of the recombinant expression system seems favorable. At medium temperatures the cell's capacity for protein folding and translocation seems to be exploited at best, explaining the temperature optimum at medium temperatures.
5. Conclusions
5.1. Exploitation Methodology for Quality by Design (QbD) Purposes
The presented work demonstrated that a high degree of biologic insight in the process can be extracted by means of statistical regression of specific rates and yields with the CPPs. This additional information obtained during process development can be used for the interpretation of the design space, creating a higher level of understanding that can be included in the regulatory filing.
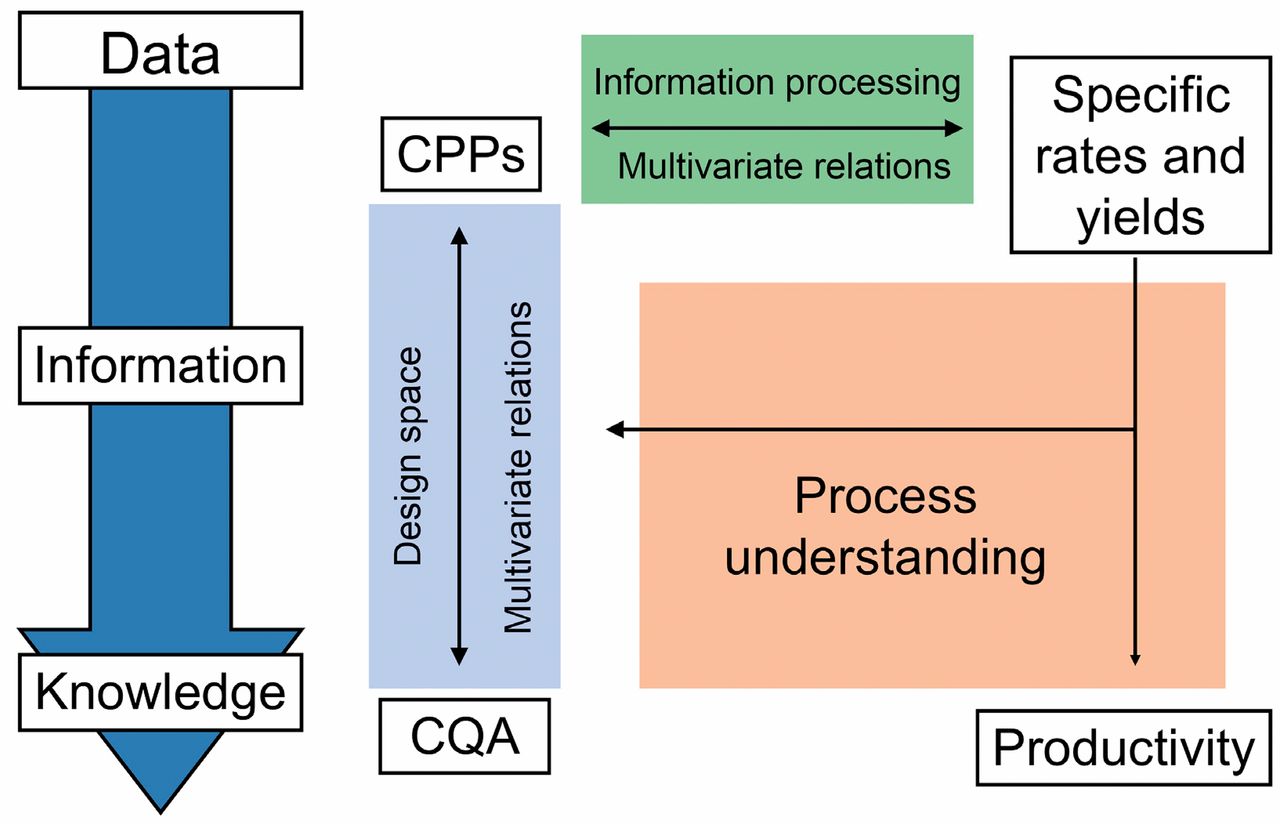
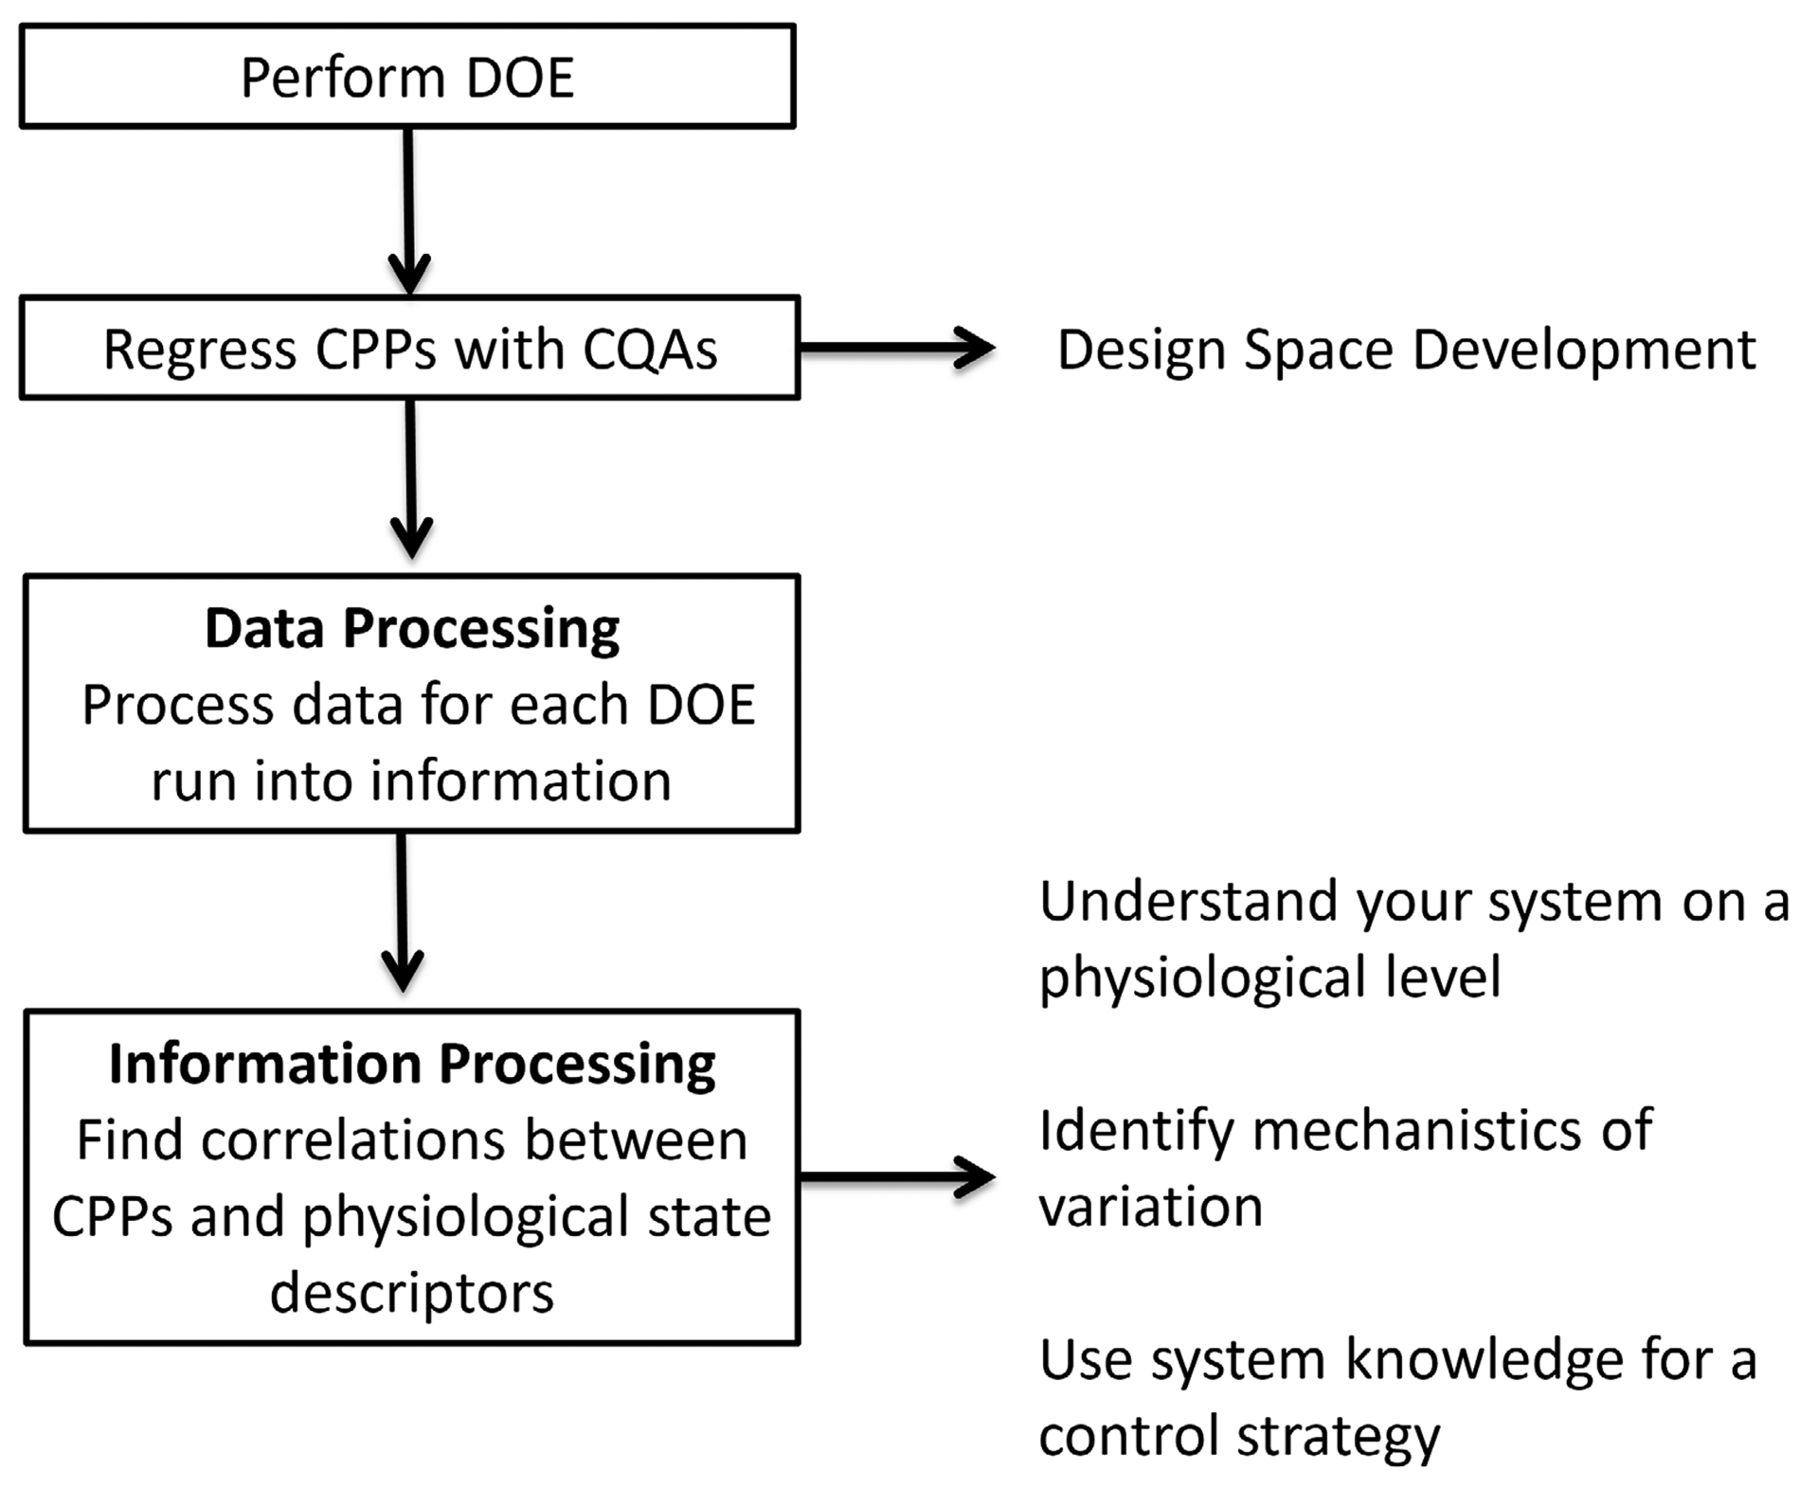
The presented QbD methodology for process understanding involving DOE execution, DOE data processing, and DOE information processing (summarized schematically in Figure 7) is to be regarded complementary to design space development, offering a comprehensive roadmap for data exploitation and knowledge presentation that allows the understanding and interpretation of the design space.

Schematic presentation of the presented data and information processing methodology for the development of process understanding.
Given validated analytical methods for the estimation of extracellular protein and the biomass, the specific rates and yields used in this study are fully accessible online. This provides interesting opportunities as regards a future control strategy, as specific rates and yields offer real-time insight in the biology of the process. As regards the discussed system, the obtained data urge for a PAT system for the monitoring of the protein release rate, for example, by online spectroscopic methods (41) or online enzymatic robot analyzers (42).
Achieving this level of mechanistic insight can be the basis for mechanistic modeling and advanced (physiological) control strategies. Furthermore, it can be communicated to the regulatory authorities within QbD submissions (3) for the reasoning of flexible processes by the demonstration of mechanistic process understanding. The question of what level of insight is needed to be communicated within QbD submissions is still unresolved. However, process flexibility granted from the side of the regulatory authorities and (mechanistic) process understanding communicated by the applicants is very likely to be close-knit.
5.2. Conclusions at a Glance
5.2.1. Methodology:
By means of data processing, physiological state descriptors (specific rates and yield coefficients) can be easily generated from readily available offline and online fermentation data.
Using the generated physiological state descriptors as responses for a multivariate study, causalities between the generated physiological state descriptors and the process parameters can be identified (information processing).
The identification of causalities between process parameters and physiological state descriptors can enhance the knowledge extractable from a multivariate study (e.g., design space development).
Applying this strategy to design space development along QbD principles, insight into the biologic impact of process parameters can be obtained that can be used for the demonstration of process knowledge within QbD submisisons.
5.2.2. Investigated System:
The induction phase feed strategy affects cell lysis, which was concluded to negatively affect the specific activity obtained in the induction phase.
The carbon dioxide yield was not found to interact with the CPPs' induction temperature and induction phase feed strategy; hence no control strategy can be created on the basis of this readily accessible yield.
The decline in the biomass yield as well as the increase of the carbon dioxide yield as a cause of induction time indicates a progressive increase in the culture's maintenance energy demand due to metabolic load.
The flux of cell resources to promoter-related activities can possibly be regulated by means of induction phase temperature. The investigated expression system performed best at mid-level temperatures, indicating that the protein synthetic capacities of the host/vector combination are best exploited at this level of down regulation. Symbols:
Symbols:
Indices:
Conflict of Interest Declaration
The authors declare that they have no competing interests.
- © PDA, Inc. 2012


