
Abstract
Pharmaceutical packaging/delivery systems and medical devices are characterized via a controlled extraction study as part of the development process for new pharmaceutical products. The purpose of this study is to determine compounds that may be extracted from the packaging using various solvents and exposure conditions. Results generated from a controlled extraction study serve to evaluate the suitability of the materials in the package configuration as well as provide an assessment of compounds that may potentially leach into the drug product. Analysis of extract samples generated during a controlled extraction study is performed utilizing multiple analytical methodologies to help establish a complete extractable profile regardless of the polarity, volatility, or other unique physical properties of each compound that may be present. The work presented in this article describes a method for the analysis of non-volatile as well as thermally labile, or otherwise not suited for analysis by gas chromatography, semi-volatile compounds from extraction samples. An ultra-high performance liquid chromatographic system with both atmospheric chemical ionization mass spectrometric and ultra violet detectors is used as the platform for the method. Adequate separation and retention is achieved for a mix of model compounds representing a wide range of common extractables within a 22 min analysis time. Ionization of this diverse range of compounds is also achieved with acceptable responses in the total ion chromatography data. Finally, analysis of extraction samples directly, even those comprised of non-compatible organic solvents, is demonstrated with no significant impact on the chromatography. Three case studies are presented to further illustrate method performance and its use for controlled extraction samples.
LAY ABSTRACT: Pharmaceutical packaging/delivery systems and medical devices are characterized via a controlled extraction study as part of the development process for new pharmaceutical products. The purpose of this study is to determine compounds that may be extracted from the packaging using various solvents and exposure conditions. Results of this work serve to evaluate the suitability of the material for use in the package as well as provide an assessment of compounds that may potentially contaminate the drug product. Analysis of extract samples generated during a controlled extraction study is performed utilizing multiple analytical methodologies to help establish a complete extractable profile regardless of the unique physical properties of each compound that may be present. The work presented in this article describes a method for the analysis of non-volatile as well as semi-volatile compounds from extraction samples. Separation and detection of a diverse range of extractables were demonstrated in a 22 min analysis time. Three case studies are presented to further illustrate method performance and its use for controlled extraction samples.
Introduction
Packaging/delivery systems or devices used for pharmaceutical products, including metered dose inhalers, intravenous (IV) bags, vials, and so on, are required to be characterized by various regulatory agencies (1, 2) as part of the drug development process. The ultimate goal of this characterization is to ensure that they do not have an unintended negative impact on the safety and efficacy of the drug product they are designed to store and/or administer. A controlled extraction study (CES) is one of the first laboratory-based studies utilized to meet these requirements. The purpose of a CES is to establish a profile of compounds that may be extracted from materials used to construct the devices utilizing various solvents and extraction methods. Information obtained from this work can be used to evaluate the composition of the material as well as provide an initial assessment of compounds with the potential to leach into the product under conditions of use (3, 4).
Due to the possible wide range of physical properties present for extractables from a given container, and the extensive range of materials used in the industry, each extraction sample has the potential to consist of a chemically complex and diverse mixture of chemical entities. This requires multiple solvents to be utilized within a CES to provide an adequate medium for extraction of all compounds from the material. Additionally, in order to ensure detection of this potential broad spectrum of compounds, each CES employs multiple analytical methodologies. Chromatographic instrumentation, most frequently liquid chromatography (LC) or gas chromatography (GC), typically serve as the primary platforms for the analysis of organic compounds in these samples. As a result of the investigational nature of this work, the use of a mass spectrometer in tandem with the chromatographic system is employed satisfy the qualitative need of the analysis. LC in tandem with UV and mass spectrometric detection (LC/UV/MS) is typically included in controlled extraction studies to allow for the evaluation of non-volatile compounds as well as thermally liable semi-volatile compounds or compounds otherwise not suited for analysis by GC.
Although LC/MS works well when developed for extractable-type compounds on a targeted basis, challenges exist when developing a method specifically for the general screening of extract samples. As previously discussed, any given extraction sample can be composed of a wide range of solvents and contain a diverse and possibly complex mixture of substances. Extractables in these samples may be present at levels in the low part-per-million range, but oftentimes need to be characterized due to the threshold of concern based on a products dosage. Organic solvents utilized in extractions may not be compatible with direct analysis by reverse-phase high-performance liquid chromatography (HPLC). Injection of a sample consisting of only an organic solvent can produce a significant impact on peak shape, especially for early eluting analytes, due to the impact on retention imposed by the organic matrix (5, 6). However, use of an organic diluent throughout the process is important, as many extractables of interest to LC/MS are hydrophobic and thus may not be soluble in a partially aqueous, more chromatographically friendly diluent. From a MS standpoint, LC/MS poses challenges not encountered in the other methodologies included in a CES. GC/MS-based methods use electron ionization, which is a “hard” ionization technique that universally generates ionized molecules or fragments of the parent molecule for analysis. LC/MS utilizes chemical ionization, a “soft” ionization technique, which has the advantage of producing more intact molecular ions useful for molecular weight determination, but has the disadvantage that not all compounds ionize well for a given ion source, ionization mode, and mobile phase system. Optimization of the mobile phase system for one set of analytes (for example, acidic species) may suppress or eliminate the ionization of another class of analytes (i.e., basic compounds). Acquisition of data in both positive and negative ionization modes is performed to help overcome this, but a reduction of sample throughput results due to the need to analyze each sample twice (once in each mode).
Some thoughtful and informative studies have been presented in the literature to establish the use of LC/UV/MS for the analysis of extractables in a CES. A detailed guideline (6) for the evaluation of packaging/delivery systems used for orally inhaled and nasal drug products (OINDPs) has been published by the Product Quality Research Institute (PQRI). This work proposes thresholds, experimental design, and other important details necessary for execution of a proper CES. As a part of this, the use of LC/UV/MS as a general technique for the analysis of non-volatile extractables is described. Other similarly detailed and comprehensive works describing CES design, including the role of LC/UV/MS within them, are available (4, 7). In addition to these, work has been performed focusing on LC/UV/MS specifically for extractables analysis. A work published by Norwood et al. (8) presents a review of current LC/MS and LC/UV/MS methods for this purpose. The majority of these methods were developed for the analysis of specific extractables from a single or narrow range of materials. A method for the evaluation of extractables from polymers has been presented by Fichtner et al. (9) in which method conditions are reported and optimized for a select group of model compounds. Recently, a detailed case study for five materials of construction used in parenteral and ophthalmic drug products has been presented by Jenke et al. (10). Although this work focuses on the extractable assessment of the materials in question, it details experimental conditions for an LC/UV/MS method as well as the data obtained from samples analyzed with it. Despite the contributions these works provide, there is limited information available in the current literature in regard to LC/MS methodology designed and demonstrated for the general screening of extraction samples from a wide range of materials/matrices using modern analytical platforms, or specific approaches to solve analytical problems that can be encountered.
Accordingly, the goal of the work presented in this paper was to develop an LC/UV/MS method for the specific purpose of screening extraction samples generated during controlled extraction studies. A demonstration of the method's performance and its ability to overcome difficulties associated with CES samples is detailed. Method performance is further demonstrated in three case studies that involve the analysis and data evaluation of actual extraction samples from a polypropylene bottle, a polyvinyl chloride (PVC) IV bag, and a metered dose inhaler (MDI) valve. These packages were chosen because they represent common configurations, a range of products (oral, inhalable, and IV for the polypropylene bottle, MDI valve, and IV bag, respectively), and use multiple materials in their construction.
Experimental
Reagents
HPLC-grade methanol was obtained from EMD Millipore (Billerica, MA). GC/MS-grade dichloromethane was obtained from Burdick and Jackson (Morristown, NJ). HPLC-grade isopropanol and hexane were also obtained from Burdick and Jackson. Water was obtained from the PPD in house Milli-Q system and was verified to have a resistivity of 18.2 MΩ/cm. Reference standard material was acquired from Sigma-Aldrich (St. Louis, MO), TCI America (Portland, OR), or directly from the supplier (i.e., BASF, Florham Park, NJ) if not available commercially.
Solution Preparations
Stock mixes of various extractable compounds were prepared at 1000 μg/mL utilizing methanol or dichloromethane as diluent depending on the compounds being dissolved. Working concentrations were prepared via serial dilutions in the desired diluent.
Standard solutions of oxidized Ultranox 626 and oxidized Irgafos 168 were prepared by adding approximately 2 mL of 30% H2O2 to a standard solution of Unltranox 626 or Irgafos 168. These solutions were kept at ambient conditions overnight to allow generation of the oxidized forms.
Extraction Samples for Case Studies
Polypropylene Bottle:
A 125 mL polypropylene bottle and closure was obtained from Thermo Fisher Scientific (Rochester, NY). The bottle was composed of a polypropylene co-polymer and certified as USP Class VI- and 21 CFR 177.1520 (a)(3)(i) & (c)3.2(a)(use conditions A–H)-compliant for use in pharmaceutical applications.
Two extraction techniques were used for the bottle material. Reflux was performed on a single bottle cut into pieces using 45 mL of dichloromethane, isopropanol, and water in 250 mL boiling flasks. The reflux extraction was maintained for 24 h after which the extraction solvent was cooled and quantitatively transferred to a 50 mL volumetric flask and brought to volume with the appropriate solvent. Intact bottles were also extracted by filling with 120 mL (equal to the published fill volume) of 30/70 ethanol water, 30/70 ethanol/pH 4.0 ammonium formate buffer, and 30/70 ethanol/pH 9.0 ammonium acetate buffer. The bottles were extracted by storing at 60 °C for 2 weeks.
Metered Dose Inhaler (MDI):
An MDI valve was obtained from Bespak (Norfolk, UK). The valve was a 20 mm BK 357 with a nominal metering volume of 25 μL and consisted of an acetal inner and outer core, polyester chamber and body, ethylene propylene diene monomer rubber seat and gasket, and stainless steel spring.
The valve was extracted with dichloromethane via sonication and with isopropanol, dichloromethane, and hexane at reflux. For each extraction condition, four valves were cut into pieces and placed into a 250 mL boiling flask along with 45 mL of solvent. Extraction via sonication was maintained for 2 h after which the solvent was quantitatively transferred to a 50 mL volumetric flask and brought to volume with dichloromethane. Extraction via reflux was maintained for 24 h using a water-cooled reflux apparatus. Following this period the extraction solvent was also quantitatively transferred to a 50 mL volumetric flask and brought to volume with the appropriate solvent.
IV Bag:
An IV bag was obtained from VWR but was manufactured by Baxter Healthcare (Deerfield, IL). The fill volume of the bag was 50 mL and contained 0.9% saline. It is composed from Baxter's VIAFLEX material. No overwrap, secondary packaging, tubing, or the like was included with the bag.
Extraction was performed via reflux as well as intact incubation. Prior to reflux a syringe was used to remove the contents of the bag. The bag was then cut into small pieces and all of the material (bag, ports, connectors) were placed into a 250 mL boiling flask. Two preparations were made and 95 mL of dichloromethane was added to one while 95 mL of 30/70 (ethanol/water, v/v) was added to the second. Both samples were refluxed for 24 h. After cooling the extraction solvents were quantitatively transferred to 100 mL volumetric flasks and brought to volume with the appropriate solvent.
Incubation was performed using the contents included with the IV bag (0.9% saline), and as such no pre-treatment was necessary. A second sample was prepared by removing the saline from the bag and replacing it with 50 mL of 30/70 ethanol water. Both bags were placed in a 70 °C oven for 48 h. Following incubation the solution was removed with a glass syringe and transferred to 50 mL volumetric flasks.
Controls
Controls were prepared for each extraction procedure using solvent that was subjected to the extraction conditions but was not in contact with any material.
Sample Handling Prior to Analysis
All standard solutions, test mixes, and extraction samples were analyzed directly with the exception of the IV bag dichloromethane extract. Due to the aggressive nature of the extraction technique and solvent, the bag material was swelled and may have partially dissolved. To prevent this potentially significant level of dissolved material from affecting the analysis, the sample was diluted at a ratio of 1:5 in methanol. This dilution was observed to precipitate a large amount of material, which was subsequently separated from the sample via centrifugation. The clear supernatant liquid was analyzed directly.
Methods
LC/MS Method Conditions:
The ultra-highperformance liquid chromatography (UHPLC) system used was a Waters (Milford, MA) Aquity consisting of a binary pump, degasser, refrigerated autosampler, thermostat controlled column compartment, and photo diode array detector. A Waters single-quadrupole mass spectrometer was used for the MS portion of the setup. Separation was achieved using a Waters Aquity ethylene-bridged hybrid (BEH) C18 3.0 mm × 100 mm, 1.7 μm UHPLC column. Chromatographic and mass spectrometric conditions used for the method are listed in Table I.
UHPLC/UV/MS Operating Conditions
System Suitability:
Butylated hydroxytoluene (BHT) was used as a surrogate standard for the UV and atmospheric chemical ionization—negative mode (APCI−) data. Dioctyl phthalate was used as a surrogate standard for the APCI+ data. These compounds were chosen as they both have adequate chromaphores allowing for detection in the UV data. Additionally, BHT ionizes well in negative mode while dioctyl phthalate ionizes well in positive mode, providing acceptable surrogate responses in that data. Otherwise, these compounds are no better or worse for use as a surrogate response then others that ionize or absorb at a similar level and thus can be substituted if need be.
A working solution of these standards was prepared at 10 μg/mL in methanol. Instrument precision was evaluated using the BHT peak area in the UV 220 nm data. Six injections were made prior to sample analysis, and one injection was made after every six test solution injections. A percent relative standard deviation (%RSD) value of less than or equal to 10 was required to be achieved for the overall BHT peak areas. Precision was not evaluated for the mass spectral responses of BHT or dioctyl phthalate, as system precision is established by the evaluation of the UV 220 nm responses. The overall mean peak area responses of BHT or dioctyl phthalate in their respective modes were used for quantitation, if necessary. It is noted that the %RSD of the mass spectral responses were generally 10–15% for all working standard injections in a sequence.
A solution of BHT and dioctyl phthalate was prepared at 1 μg/mL for the purpose of evaluating the sensitivity of the total ion chromatographic response. It was required that the BHT and dioctyl phthalate signal-to-noise ratios be greater than or equal to 3 in the APCI− and APCI+ modes, respectively.
A solution of BHT was prepared at 0.1 μg/mL for the purpose of evaluating the sensitivity of the UV 220 nm response. It was required that the signal-to-noise ratio of the BHT response in the UV 220 nm data be greater than or equal to 3.
Development of the Method:
A Waters Acquity Ultra Performance Liquid Chromatography (UPLC) system was selected for the chromatographic portion of the method. This system is a type of ultra-high-performance liquid chromatography (UHPLC). It was selected for the advantages it provides over standard HPLC including improved response and resolution, and reduction in run time (11). This is achieved through the use of small particle sizes (≤1.8 μm) in the analytical column as opposed to traditional HPLC, which generally uses particle sizes ≥3.0 μm. Use of small particles has the effect of increasing surface area of the stationary phase, which in turn increases peak plate counts significantly.
A Water's Acquity BEH C18 stationary phase was selected for the method. This column was chosen based on its reported stability to harsh pH and temperature exposures as well as its UHPLC capabilities. As a reverse-phase retention mechanism was desired, a C18 stationary phase was selected. A particle size of 1.7 μm is typical for UHPLC separations and was selected for this work to provide the desired separation characteristics associated with UHPLC. Column dimensions of 2.1 mm × 50 mm, 2.1 mm × 100 mm, and 3.0 mm × 100 mm. All were composed of the same stationary phase (BEH C18 1.7 μm particle size). The 3.0 mm × 100 mm column was found to have the best balance between separation power, peak efficiencies, and back pressure.
Methanol was chosen as the organic portion of the mobile phase system. Although this solvent is not as strong of an eluent in reverse-phase LC as acetonitrile or tetrahydrofuran, a characteristic that may be less than ideal due to the hydrophobic nature of many commonly encountered extractables, and has less ideal back pressure and UV absorption characteristics, it was found to produce less background noise during positive mode ionization. Subsequently, an improvement in the positive mode total ion data was found compared to other solvents. This is likely due to its proton affinity being less than the aforementioned solvents (12) resulting in less ionized “solvent clusters” and a greater number of ionized analyte molecules. In addition to the authors' experience with methanol in atmospheric chemical ionization (APCI), there is also a more detailed evaluation of this effect presented in the literature (13) with similar findings.
A mobile phase gradient of 20% methanol increasing to 95% methanol was employed for the first 15 min of the chromatographic run. The purpose of this gradient was to allow retention of more polar compounds at the start of the analysis while gradually shifting to a higher organic percentage for elution of less polar compounds. The composition was then held at 95% for 3 min to continue elution of strongly retaining compounds while still maintaining a small amount of water in the mobile phase to aid in ionization. Ultimately, 100% methanol was used for the last 4.5 min to elute any remaining compounds that otherwise could not be eluted in the presence of water. The final 2 min reverts back to the initial mobile phase composition to equilibrate the column for the next test solution injection.
Injection parameters were optimized to allow for the direct analysis of extract samples comprised of 100% organic solvent while ensuring little to no impact on peak shape was produced. Various injection volumes and modes were evaluated, and it was found that an injection volume of 5 μL in a 10 μL loop using a partial loop needle overfill mode gave the best compromise between analyte load on column and peak shape. The UHPLC system used for this work did not have a flow-through needle and thus required a needle wash to prevent carryover. An evaluation of strong wash compositions suggested by the manufacturer, which were 70/30/10 methanol/isopropanol/water and 25/25/25/25 methanol/water/acetonitrile/isopropanol, in addition to 100% methanol, were performed. It was found that a weak wash equivalent to the initial gradient conditions and a strong wash consisting of 100% methanol eliminated carryover of more hydrophobic compounds. Results for the strong wash containing water showed some slight carryover for solutions at relatively high (>50 ppm) concentrations. The volumes of each that were found to work were 600 μL and 1800 μL for the strong and weak wash, respectively.
Mass spectrometric analysis was accomplished using a Waters single-quadrupole mass spectrometer. This particular MS system was chosen for its ability to quickly (<100 ms) switch between positive and negative ionization modes, which allows for the acquisition of both positive and negative ionization data in a single injection.
APCI and electrospray ionization (ESI) were considered as potential ion sources for the method. Both APCI and ESI can ionize a wide range of analytes and are relatively easy to use with modern instrumentation. The major difference between these two techniques is in the process by which ionization occurs. ESI is a solution-based technique and usually requires ionization of analytes prior to entering the source (8). Ionization in APCI occurs through gas phase intermolecular charge exchange between neutral analyte molecules and charged reagent molecules (i.e., H3O+, OH−) produced by electrons discharged from a corona needle (8, 15) and thus doesn't necessarily require ionization prior to entering the ion source.
Although ESI has been shown to be successful for the analysis of extractables (16), APCI was chosen as the ion source for this method. Based on its operational principles, it is better suited for the analysis of unknown compounds with a wide array of possible chemical functionalities and wouldn't require mobile phase optimization. APCI can also handle typical HPLC flow rates (>1 mL/min); however, given that UPLC instrumentation could be optimized to operate well at ESI-friendly rates (≤0.2 mL/min), this was a secondary concern. In addition to these points, APCI has already been demonstrated in various published works (8) as a technique for the analysis of extractables in controlled extraction studies.
Settings of parameters on the mass spectrometer (i.e., corona current, cone voltage) are usually performed at the time of use and as such absolute values are not reported here. However, it was generally found that a lower cone voltage in APCI+ mode was ideal, while APCI− responses were greater with a higher cone voltage. Other parameters were found to be less critical to obtain desired ion formation, but it was noted that greater adduct formation was obtained with lower corona currents independent of the cone setting. Verification/optimization of MS settings was typically performed by infusing a mixture of target analytes and modifying the conditions appropriately to obtain the desired ionization.
Results and Discussion
Method Evaluation
Evaluation of method performance was achieved using a mixture of compounds that represent various additives, or are additive-related, in polymeric and elastomeric materials and thus may be seen as extractables from these materials. In addition to the fact these compounds were selected to represent potential extractables that may be encountered in a CES, they were also chosen to cover a range of polarities, functionalities, and acid/base properties. A list of the compounds present in the mix as well as their relevant physical properties can be found in Table II.
Information on Compounds Used for Method Evaluation
Demonstration of Direct Analysis of Organic Solvents
Methyl-2-benzoylbenzoate, dioctyl phthalate, BHT, Irganox 1010, and Irganox 1076 were chosen from the compounds listed in Table II for the evaluation of solvent effect. These compounds were chosen to represent a range of hydrophobicity (log P) properties. They were prepared in 50/50 (v/v) water/methanol, methanol, isopropanol, dichloromethane, and hexane at 10 μg/mL. Analysis of the mixes was performed by injecting the solutions directly to evaluate the impact on response and peak shape.
Table III displays the percent difference of response for each compound in methanol, isopropanol, dichloromethane, and hexane relative to the corresponding extractable in a 50/50 methanol/water diluent. Methyl-2-benzoylbenzoate, the most hydrophilic of the compounds evaluated (log Po/w = 2.70), showed no significant change in response for any of the solvents. This is suspected to be a result of its moderate properties making it readily soluble in both the partially aqueous and fully organic solvents at the concentration tested. Dioctyl phthalate, BHT, Irganox 1010, and Irganox 1076 showed more significant differences relative to the 50/50 methanol/water response; however, the results among the four organic solvents were relatively consistent. Discrepancies in the responses of the extractables in 100% organic versus 50% water solvents illustrate the incomplete solvation/precipitation of the analytes in the 50/50 methanol/water diluent and the potential for subsequent impact on the response if this approach were to be used.
Percent Difference in Peak Area Response for Extractables in Organic Solvents Relative to Solution Prepared in 50/50 Methanol/Water Diluent
No significant effect on the separation or chromatographic integrity of the peaks is noted for any of the solvents. A broad solvent-related response is observed in the hexane-related injection near the retention time of BHT, which has a minor impact on its integration. Table IV lists the USP tailing and USP theoretical plate values for each analyte in each solvent.
Chromatographic Information for Extractables in Various Diluents
Demonstration of Separation
Evaluation of separation, sensitivity, and ionizability was performed for all compounds listed in Table II. A single solution of the model compounds was prepared using methanol as the diluent, and this was subsequently analyzed by the method directly.
Results for the analysis can be observed in Figures 1 through 3, which present the UV 220 nm, APCI−, and APCI+ chromatograms, respectively. A majority of the compounds evaluated eluted sequentially over the course of the run in order of their log Po/w values and are found to have favorable peak shapes. More hydrophilic, lower molecular weight compounds in the test mix are retained long enough to separate them from the void time and displayed acceptable peak shapes. The earliest eluting analyte in the mix has a retention time of approximately 3.8 min while the T0 of the separation occurs at about 0.7 min. This results in a retention factor (k) of 4.4 for this compound. Typically, it is recommended that compounds in a separation have a k value greater than 2 (5). Additionally, this illustrates that the method has a capacity to retain more hydrophilic compounds if they were to be encountered. Very hydrophobic analytes, such as the large antioxidants and di-glycerides, eluted in less than 20 min; therefore, it was not necessary to extend the final organic hold time or use a stronger solvent to elute these types of compounds from the column. Overall, peak tailing values for most compounds are in the range of 0.8–1.2 and theoretical plate counts were found to be at UHPLC-type levels of >250,000.
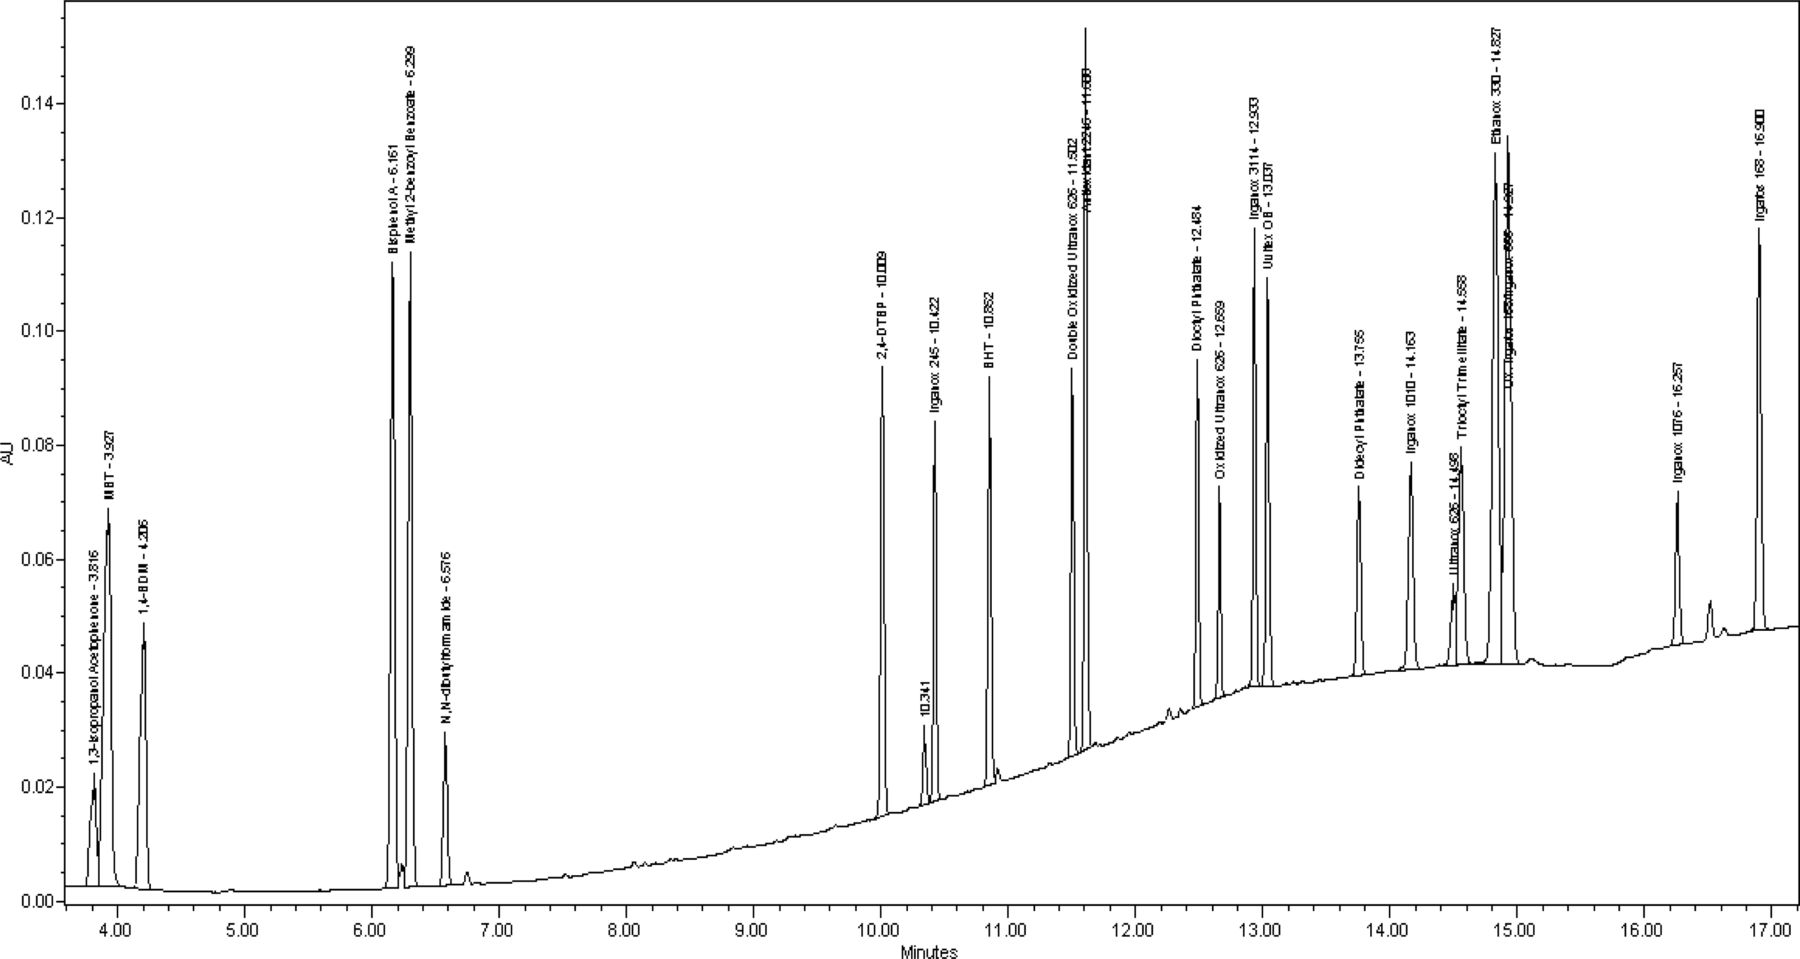
UV 220 nm chromatogram of extractable mixture prepared at 10 μg/mL.

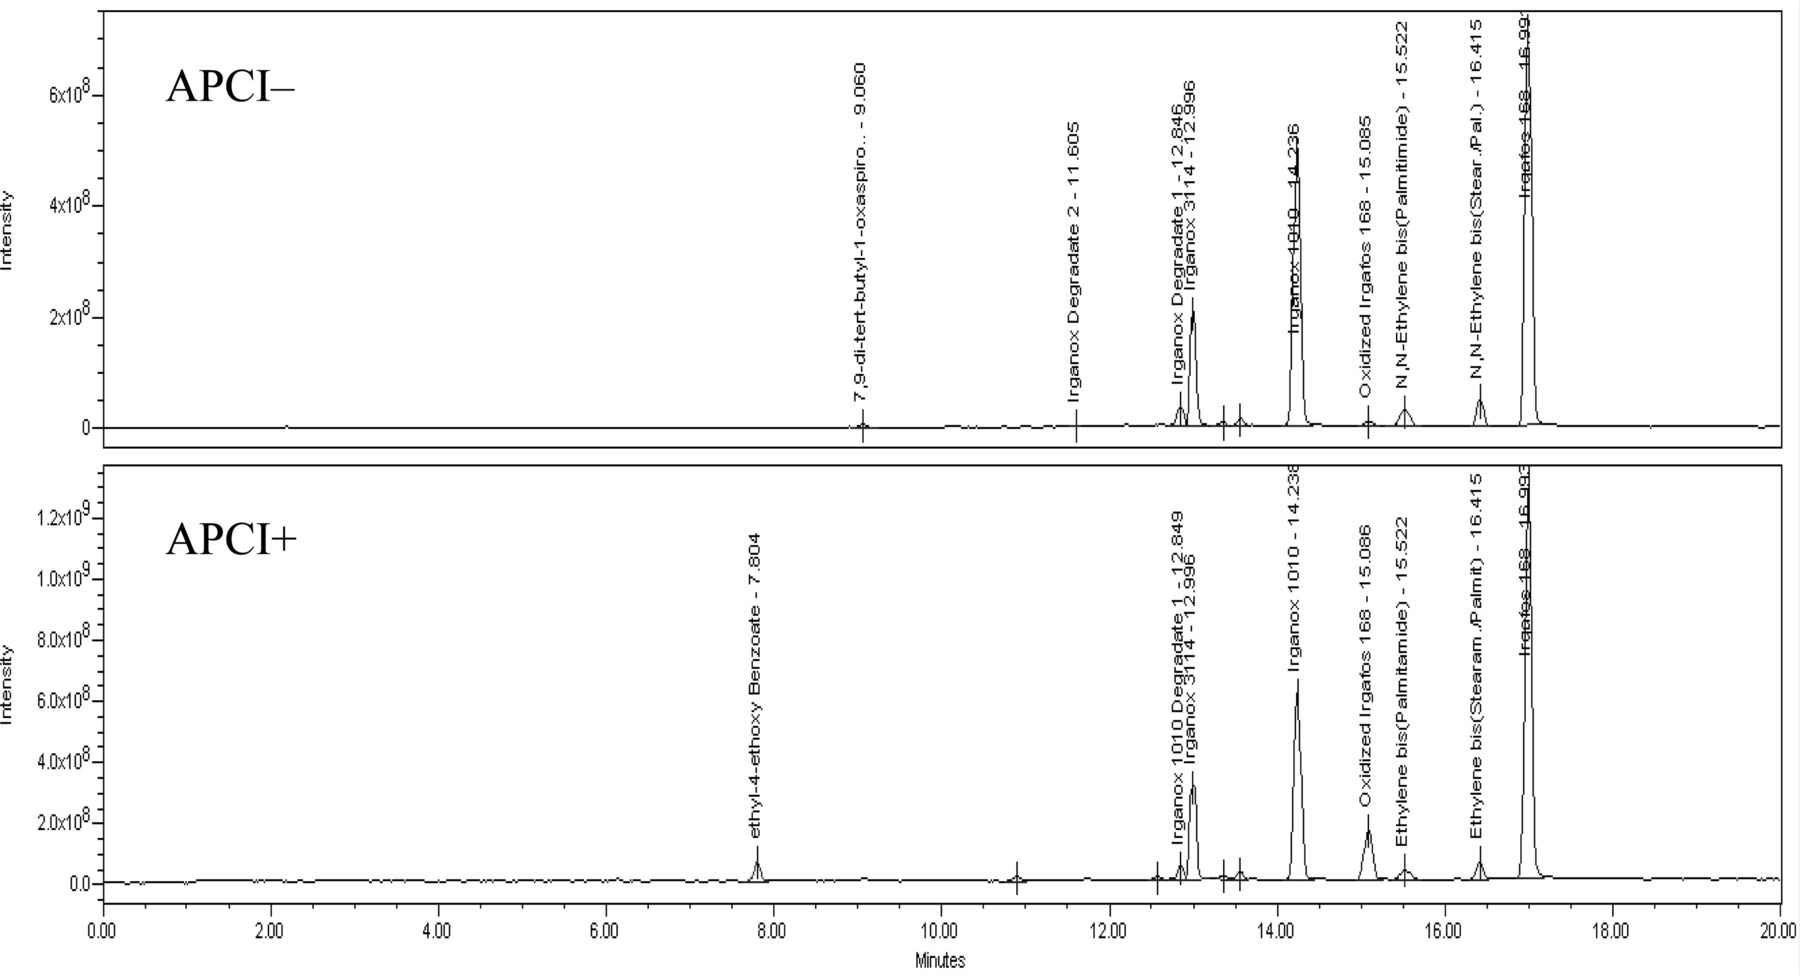
APCI− total ion chromatogram of test mixture prepared at 10 μg/mL.

APCI+ total ion chromatogram of extractable mixture prepared at 10 μg/mL.
Demonstration of Ionization, Sensitivity, and Relative Response Factors
A solution of the model compounds was prepared at 0.1, 1, and 10 μg/mL in methanol and analyzed to demonstrate ionizaebility and sensitivity. The concentration with the lowest response was used to determine the approximate detection limit (DL), which is defined here as having a signal-to-noise ratio of approximately 3. If a response was observed in both positive and negative mode, the larger of the two was used in the calculation. DLs for the UV data were not evaluated. The concentration corresponding to this was determined with the following equation:

Table II presents the DL results obtained from the analysis of the extractable mixture. Out of all the compounds analyzed, only five are found to have not produced an MS response at the concentrations tested. Four of these compounds are various long chain carboxylic acid esters while the fifth was also a type of ester. These compounds may not produce a negative mode response, as there are no acidic hydrogen atoms present and the proton affinity of the ester group may not be high enough to allow the molecule to be easily ionized in positive mode. GC/MS is noted to be a suitable analytical technique for carboxylic acid esters, and as this methodology is usually included as part of a CES, the fact that they were not detected by the method is not a concern due to the cross method support.
The remaining compounds in the extractable mix all produce a response in at least one of the modes and at least one of the concentration levels tested. DLs of around 3 μg/mL or fewer are obtained for most of the extractable compounds. In some cases, DLs are calculated to be as low as 100 ng/mL for highly ionizable compounds. It should be noted that these are estimated values and they may not correlate to an actual solution at that concentration if the extrapolation of the data does not result in a direct correlation. However, the information does provide an idea of ionizability and response relative to the other compounds tested.
Response factors for each model compound, relative to the surrogate standard relative response factor, (RRF), were calculated for each data mode. BHT is used as a surrogate standard in both the UV 220 nm and APCI− data, while dioctyl phthalate is used for the APCI+ data. Not all compounds produced a response in each mode, and thus RRF values are only reported for the mode in which one was observed. Additionally, the average RRF, standard deviation, and %RSD of the RRF values in each mode were calculated. These results can be found in Table II.
RRFs for the UV 220 nm mode ranged from 0.3 to 2.5 relative to the BHT response. Overall this trend was in line with the structure of each compound, and those with more chromophores per mass-produced responses greater than BHT for the same concentration, and vice versa. The average RRF was 1.1 with a %RSD of 60 and standard deviation of 0.7. These value are comparable to those put fourth for the evaluation of extractable/leachables compounds by GC/MS or GC/flame ionization detection in the literature (6, 17, 18). No information on UV or LC/MS responses for extractable/leachable compounds were found in the literature for comparison. Knowledge of the RRF from the UV data, as well as the other modes, is typically incorporated into analytical evaluation thresholds (6) to account for this variability and ensure it does not affect the reporting of extractables.
RRFs for the APCI positive and negative mode responses showed a notable trend between the two data modes. In APCI+ response factors were more varied and ranged from 0.04 to 3.6 relative to the dioctyl phthalate surrogate response. RRF's in the APCI− results were more consistent and actually had the best %RSD of the three data modes. This is suspected to be a result of the ionization mechanisms, which are quite different between positive ion and negative ion detection. Positive ion detection is significantly affected by proton affinities as reflected by the large responses of compounds containing nitrogen, which in general protonates easily in MS. In negative mode the primary mode of ionization is de-protonation of the parent compound or a fragment generated in the ion source. These results suggest this process is less variable based on changes in pKa, or other chemistries affecting de-protonation of the molecule.
Case Studies
Analysis of Controlled Extraction Samples from a Polypropylene Bottle
Introduction:
Packaging consisting simply of a bottle and cap are often utilized for the storage of liquid oral drug products over their intended shelf life. Per U.S. Food and Drug Administration (FDA) guidance to industry (1), the route of administration for these drugs is considered to have a low degree of concern in regards to the risk posed by potential leachable impurities. However, the recommendation also notes a high likelihood of interaction between the product and package. Reasons for this include the potential long contact periods (i.e., long shelf life), the direct contact between the liquid product and large surface area of the container, and the potential for excipients in the product to increase the solubility of packaging related impurities. For these reasons an assessment of the extractable profile for this type of packaging may be performed as part of the drug development process or qualification of new materials to ensure there is no negative impact on the product introduced by its container.
Demonstration of the analysis of controlled extraction samples from this type of packaging was achieved by subjecting a 125 mL polypropylene bottle to various extraction techniques and solvents consistent with an approach that may be used to characterize this material as part of a CES. Extraction with dichloromethane, isopropanol, and water via reflux were performed on cut-up bottle material to represent an exhaustive-type extraction intended for the characterization of the total amount of extractables present in the material. Typically, an exhaustive extraction would involve successive extractions on a single sample of the material to demonstrate asymptotic levels were reached, but for the purposes of this demonstration a single extraction was performed.
Extraction by incubating intact bottles at 60 °C for 2 weeks with neutral, pH 3, and pH 9 30/70 ethanol/water solutions was performed and may be considered as an aggressive extraction beyond the bounds of typical product exposure due to the presence of organic solvent, higher temperature, and wide range of solution pH (4). It could also represent a product formulation that contains excipient(s), such as propylene glycol, polyethylene glycol, or alcohol, which may aid in solubilization of less hydrophilic compounds.
Results:
A review of the mass spectral responses obtained in the total ion chromatograms for both positive and negative mode APCI was performed in order to identify any extractables that may be present in the extraction samples. This data was compared to the controls analyzed in the same experiment to rule out any process or solvent-related impurities. It is important to note that no commercial mass spectral libraries are available for LC/MS due to the variances in ionization imparted by differences in instrumentation, method conditions, mobile phase, and so forth. Instead, identifications are made based on knowledge of the material obtained beforehand, further research into the material, or referencing literature listing known extractables for a given material(s) (4, 19, 21) as well as analytical chemists' experience in the field of extractables analysis. All identifications are considered tentative unless additional information, such as retention time and mass spectral matching to an authentic specimen of the material, are obtained.
The mass spectral and UV 220 nm data were cross-referenced in order to harmonize peaks in both the UV and mass spectral data. Responses in the UV 220 nm mode are used primarily for quantitation because they are more reproducible and sensitive than the mass spectral responses. In addition to this, the UV response for species with adequate chromophores are often greater when compared to the mass spectral total ion chromatograms, (TIC) data, allowing for compounds with a very marginal but identifiable mass spectral signal to be quantitated more precisely in the UV data. Compounds without a chromophore, or if otherwise needed (such in the case of co-eluting compounds), may use the single-ion response for individual extractables to produce quantifiable results with greater sensitivity and specificity.
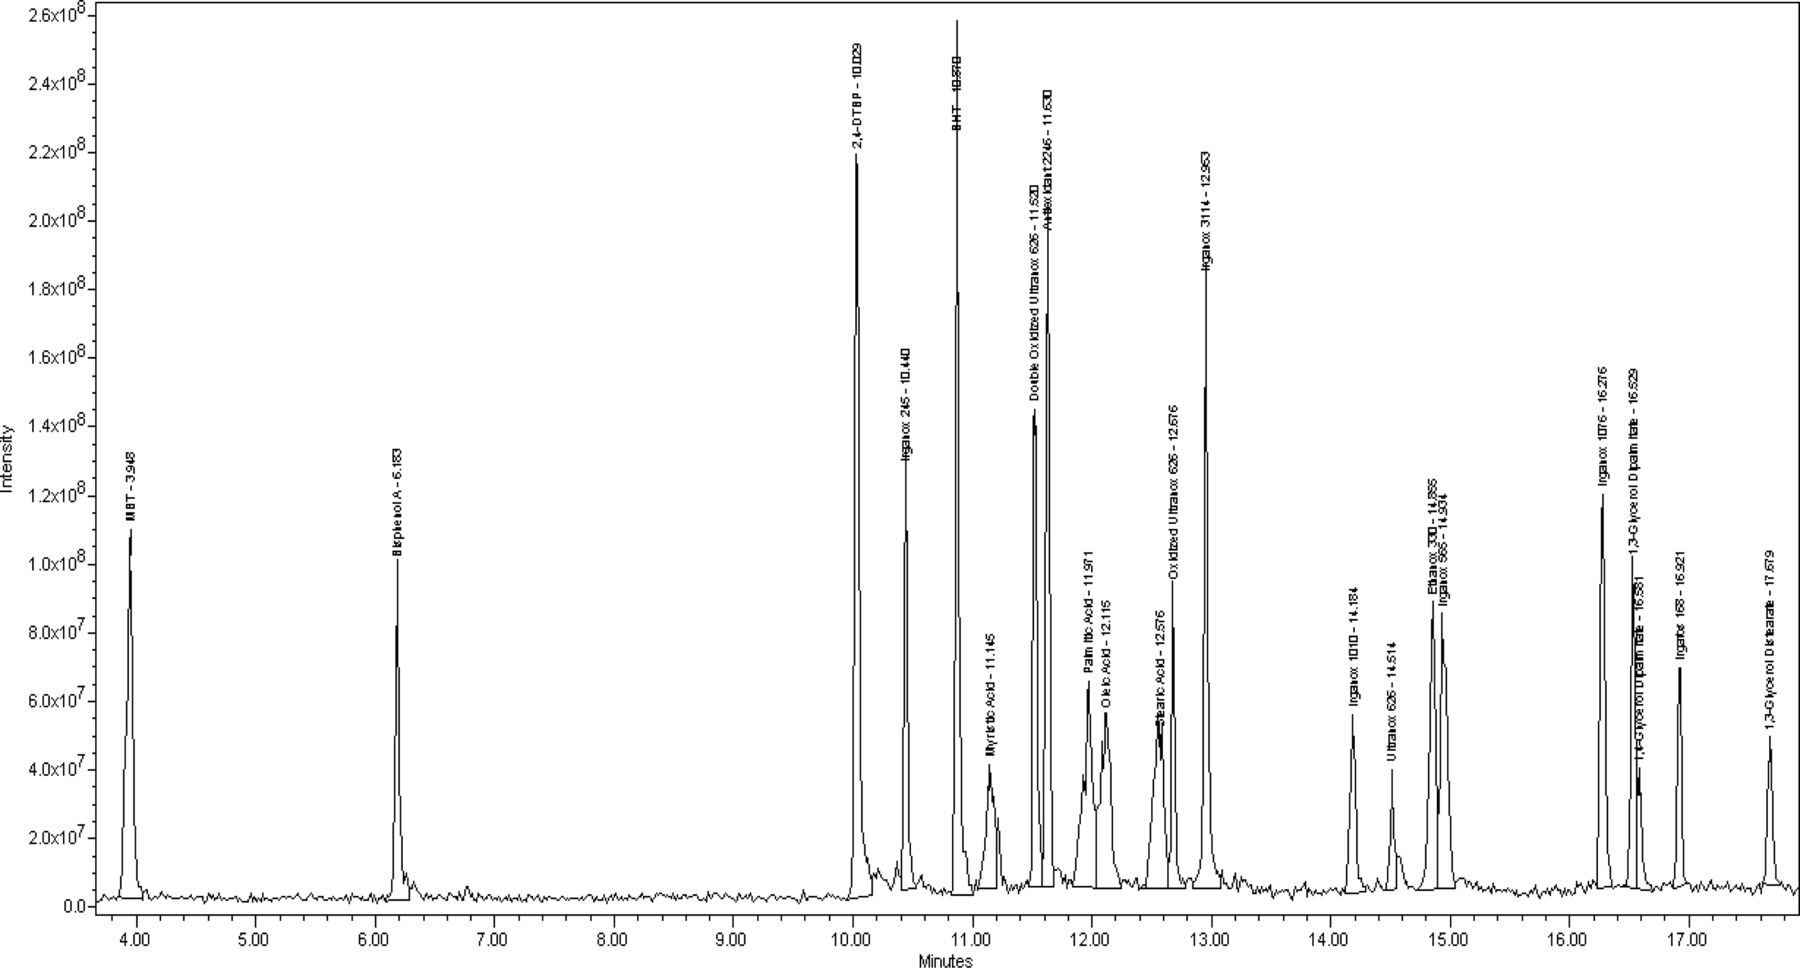
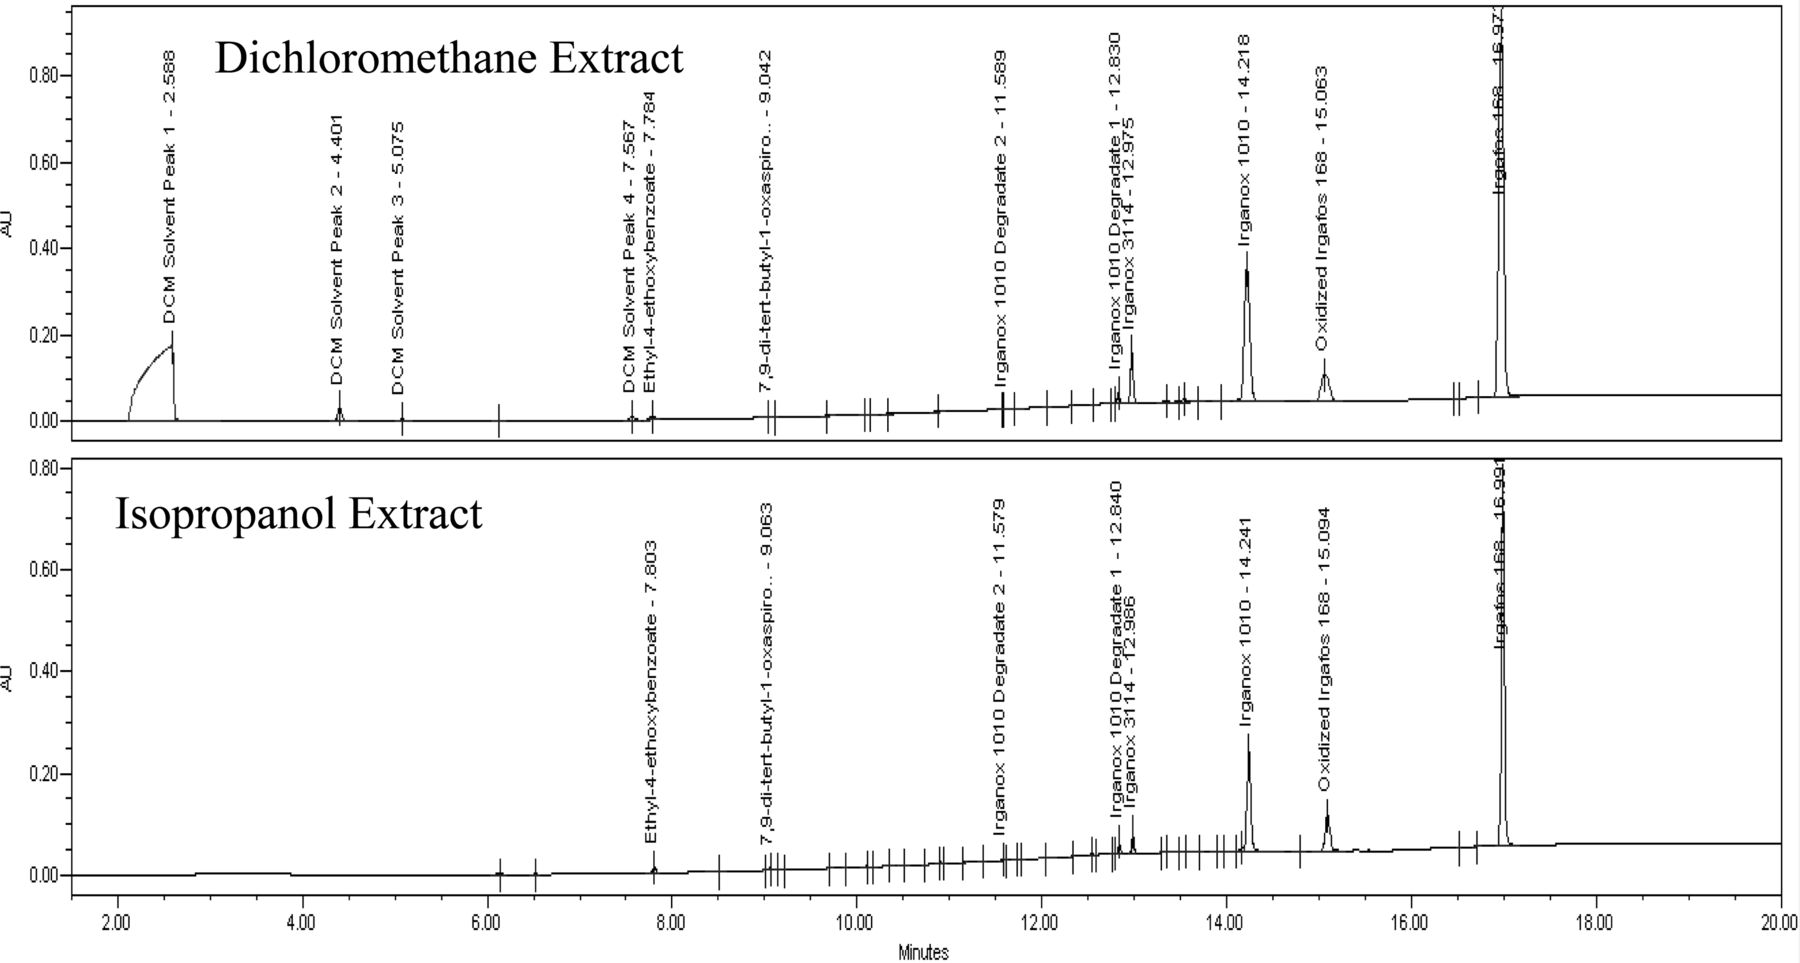
Figure 4 displays the negative and positive mode TICs for the dichloromethane reflux extract, and Figure 5 displays the UV 220 nm chromatograms for the isopropanol and dichloromethane reflux extraction samples. For clarity, only identified peaks are annotated; smaller, unidentified peaks are integrated and their maxima are marked, but they are labeled for the sake of presentation.
APCI TIC of polypropylene bottle dichloromethane reflux extract.

Comparison of UV 220 nm data for the polypropylene bottle dichloromethane and isopropanol reflux extract.
The isopropanol and dichloromethane reflux extracts represented the most aggressive solvents and technique for the extraction of the bottle, evident by the presence of several extractables in appreciable amounts. Irganox 1010, a phenolic antioxidant, and Irgafos 168, an antioxidant/processing stabilizer, are the two largest extractables observed and likely represent the antioxidant system used in the material. Several other extractable compounds identified are noted to be degradation products of Irganox 1010. These include the responses observed at 12.8 min and 11.6 min, which are suspected to represent the loss of 1 and 2 side groups of the molecule by hydrolysis. No commercial standards are available for their confirmation, but based on the molecular weight postulated from the suspected molecular ions of these compounds, and the presence of Irganox 1010, the assignment is logical. Additionally, the structure of the degradant with a mass of 916 has also been supported by a more detailed nuclear magnetic resonance (NMR) evaluation in the literature (22). A third Irganox 1010 degradant, 7,9-di-tert-butyl-1-oxaspiro(4,5)deca-6,9-diene-2,8-dione,is identified. This compound does not originate directly from Irganox 1010, and instead is formed via further reaction of the side groups after their release from the parent molecule (23, 24). The mass spectrum of this compound is less intuitive due to the base ion resulting from carbon dioxide loss, which is known to occur in cyclic esters (25), followed by an ion representing loss of carbon monoxide. This pattern illustrates the favorability of loss for small, neutral molecules of low proton affinity (proton affinity of CO2 = 5.7, CO = 6.2) (12) consistent with Field's rule and can be an important piece of evidence regarding functionalities in a molecule. For example, compounds with aliphatic hydroxyl group(s) (such as diglycerides) often show strong water loss, or those with methyl ethers (such as methyl-2-benzoyl benzoate) show methanol loss.
Ethyl-4-ethoxybenzoate and Irganox 3114, another type of antioxidant, are present in the UV and LC/MS data. The mass spectrum of Irganox 3114 is probably the least intuitive of all that are collected and presented in this paper. On initial review it appears be a co-elution of two compounds with a single strong ion at m/z 218 in the positive mode data and a major ion at m/z 564 in negative mode. These, in fact, represent a dissociation likely happening in the ion source with the ion at 564 corresponding to a deprotonated form of the parent molecule after loss of one of the three side groups (side group molecular weight = 220). The ion at 219 in positive mode corresponds to the protonated quinone form of the side group after separation from the parent molecule. No molecular ion of any significance was found in either mode. Despite the confusing data provided by the mass spectrum, the compound was able to be identified based on previous experience with this additive and data collected from an authentic reference specimen.
The remaining extractables in the data are identified as N,N-ethylene bis(palmitamide) and N,N-ethylene bis(palmitamide/stearamide). Both an APCI+ and APCI− response are observed for these and each produced an M+H/M-H molecular ion. Two adducts are observed in negative mode and likely correspond to M+O2− and M+NO2− ions which are known to be observed in atmospheric ionization for certain functionalities (26). No appreciable UV response is observed for these compounds, so quantitation is performed with the mass spectral data. Although these appear to be two similar yet distinct compounds, it is the authors' experience that they actually originate from a single extractable, N,N-ethylene bis(Stearamide), which is a type of lubricant/dispersing agent. It is uncertain why the additional related forms of this compound are always observed, however even a pure reference standard solution is noted to produce these when analyzed.
Of the remaining extraction solutions, which included the water reflux and various ethanol/water incubation samples, only the water reflux extract contain any identified extractables, and none of these samples have any extractable-related responses of significance. Interestingly, the extractables identified in the water reflux extract sample were the compounds identified as N,N-ethylene bis(stearamide)–related. These are very hydrophobic compounds with no water solubility and are suspected to be present in the sample in a suspended state.
Reportable qualitative and quantitative data obtained for major extractables in the dichloromethane bottle extract can be found in Table V.
Extractable Results for the Dichloromethane and Isopropanol Reflux Extracts of the Polypropylene Bottle
Analysis of Controlled Extraction Samples from an MDI Valve
Introduction:
MDIs are a type of delivery system for orally inhaled drug products and are one of the most scrutinized subjects for the evaluation of extractables and leachables due to the risk associated with the route of administration as well as the effect the propellants used in them have on extracting compounds from the materials (i.e., high risk of package/product interactions). The complexity of their construction, which usually involves multiple polymeric and elastomeric materials, can also increase the number and diversity of leachables in the final product. Due to the concern around these products, approaches for evaluation of extractables and leachables have been proposed in the literature, most notably that put forth by the Product Quality Research Institute Working Extractables and Leachables working group (6).
The case study described here involves the analysis of a valve with a typical configuration to those that may be used for a MDI. Isopropanol, dichloromethane, and hexane were utilized as extraction solvents and are considered to cover a range of polar, moderate, and non-polar properties, respectively, relative to the drug matrix contacting the valve. All three solvents were used in a reflux extraction while dichloromethane, which is often considered to be the closest representation of the propellant (6), was used in an additional extraction of the valve via sonication to provide a more conservative extraction technique to the study. It would typically be advisable to extract the different valve components separately to obtain extractable profiles of each for evaluation of material suitability. For the purpose of this work the entire valve was extracted to provide a more complex extractable profile for the demonstration of this method.
Results:
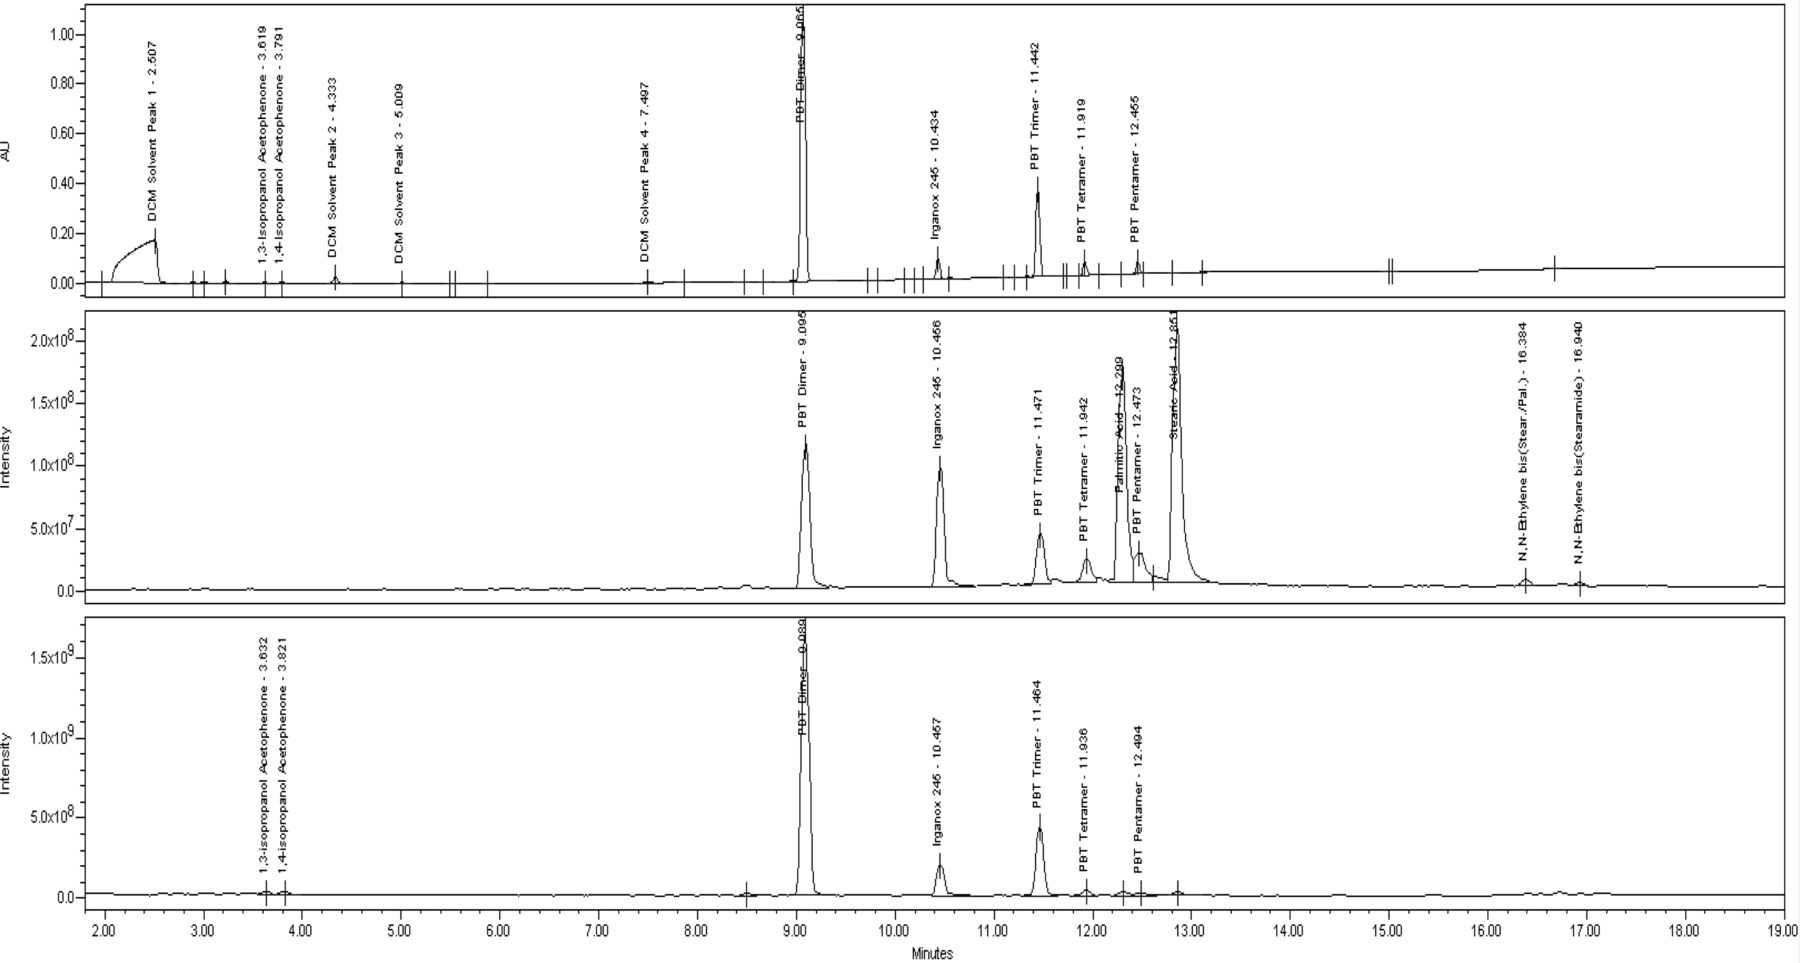
The largest number and amount of extractables are found in the dichloromethane reflux extraction. Chromatograms of the UV 220 nm, APCI−, and APCI+ data for this extract can be found in Figure 6. Oligomers of polybutylene terephthalate, ranging from the dimer to the pentamer in decreasing amounts, are identified using their molecular ions. In negative mode, the oxygen anion adduct is the largest ion for each oligomer and illustrates the need to carefully evaluate the upper end of the spectrum when assigning molecular weight values. Also, given that these compounds are related to the polymer, and not a commercial additive, their identification depends on knowledge of the material and they may not be included in the reference literature mentioned previously. These oligomers are suspected to originate from the polyester body and metering chamber components. The antioxidant Irganox 245 is identified in the mass spectral data for both modes, but negative mode has the clearest spectrum showing a single M-H ion. 1,3 and 1,4 isopropanol acetophenone are identified by their molecular ion, knowledge of the material, and cross referencing with the GC/MS data. These compounds are not themselves a direct additive to the material, and instead are degradation products of peroxide-curing agents, likely used in the elastomeric components of the valve. The final major extractables observed are palmitic and stearic acid. These are identified based on their molecular ion in the APCI− data and, due to the lack of chromophore, have no UV response.

UV 220 nm, APCI− TIC, and APCI+ TIC of MDI valve dichloromethane reflux extract. Top: UV 220 nm chromatogram. Middle: APCI− total ion chromatogram. Bottom: APCI+ total ion chromatogram.
Results for the DCM sonication sample showed a similar profile to the reflux extract but with lower amounts likely due to the shorter contact time and more mild extraction technique. Isopropanol produced a comparable profile; however, the amounts are less than observed with dichloromethane. Results for hexane show lower amounts as well as an absence of some of the lower molecular weight compounds.
A summary of the qualitative and semi-quantitative results obtained for the valve dichloromethane reflux extract can be found in Table VI.
Extractables Results for the Dichloromethane and Isopropanol Reflux Extracts of the MDI Valve
Analysis of Controlled Extraction Samples from an IV Bag
Introduction:
Parenteral drug products are defined as those which are administered by means other than oral consumption. Oftentimes these types of products are delivered directly into the patient's blood stream via an IV route through the use of a syringe, pump, or bag. Each of these configurations has its own concerns for product/container interactions based on the materials used, duration of contact, as well as the volume stored and/or administered. Bags used for IV administration (IV bags) are generally grouped in the class of large-volume parenteral products and may deliver anywhere from several milliliters up to several liters of the product depending on the application. Per the FDA guidance on container/closure systems (1), these products can have a high likelihood of product/container interaction for similar reasons to oral products discussed previously, including large volume aiding in solubilization of container-related impurities, high surface areas in contact and the formulation, or liquid nature of the product's role in the migration mechanism. Unlike liquid oral drug products, the route of administration for parenteral drugs is noted as being of high concern. This places these products in the same class as OINDPs and makes evaluation of extractable and leachable impurities a necessary part of the drug development process.
This case study utilized a plasticized IV bag for the demonstration of the method for analysis of extractables from a type of commonly encountered parenteral product. Extraction was performed using both reflux and incubation techniques with multiple solvents to represent conditions of varying aggressiveness as far as liberating compounds from the material. Reflux was performed on single bags cut into pieces and fully immersed into both dichloromethane and ethanol/water. Dichloromethane was expected to effectively liberate the total pool of additives based on the material and technique, and while ethanol/water wouldn't necessarily completely permeate the polymer it could be considered beyond worst case relative to product use.
Results
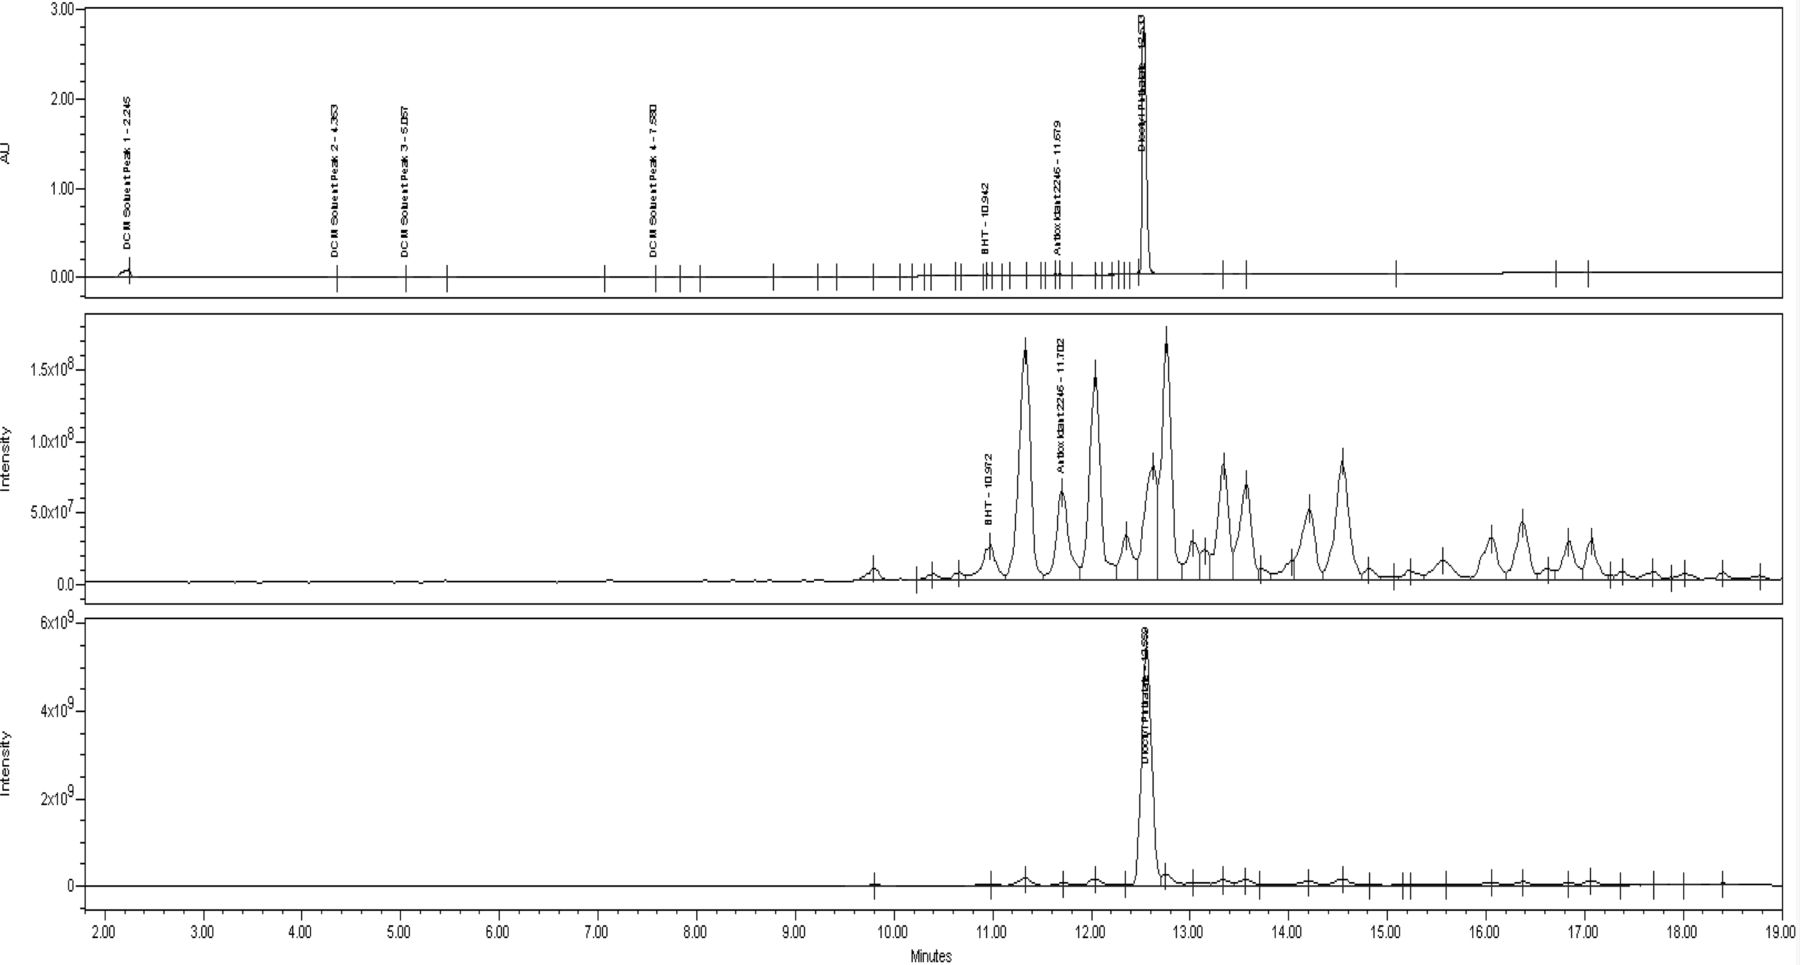
Chromatograms for the UV and mass spectral data for the dichloromethane reflux extract, which once again was the most complex sample, can be found in Figure 7. Dioctyl phthalate, a common plasticizer used to soften PVC material, is by far the largest component extracted in this sample. It is identified based on its molecular ion as well as the characteristic “phthalate rearrangement” fragment at m/z 149 (27). This result is consistent with the fact that PVC can have a significant amount (>20%) of plasticizers present in the formulation. Further review of the UV data reveals that a minimal number and amount of other extractables were observed. Three of these are identified as the antioxidants BHT and Antioxidant 2246 based on their molecular ions in APCI− mode and the vulcanizing agent diphenylguanadiene based on the molecular ion in APCI+ mode. The remaining extractable responses are likely at too low of a level to produce an adequate mass spectral response.

UV 220 nm, APCI− TIC, and APCI+ TIC of IV bag dichloromethane reflux extract. Top: UV 220 nm chromatogram. Middle: APCI− total ion chromatogram. Bottom: APCI+ total ion chromatogram.
In contrast to the UV 220 nm data, a multitude of appreciable responses are identified in both the positive and negative mode data from about 11 to 17 min. The discrepancy between the data is a strong indication that the extractables producing these responses do not have adequate chromophores, which is an important piece of evidence to note when attempting identification. Thus, molecules with a large degree of conjugation, aromatic rings, or other functionalities that act as strong light absorbers at this wavelength can be eliminated.
Review of the mass spectra for the unknown peaks was performed to obtain additional information and attempt identification. In the positive mode data several ions are observed in the region of approximately 950 to 1100 m/z that are separated by a mass of 18 indicating that multiple neutral water molecules are being readily lost from the molecule. At the same time, no clear M+H ion was identified. In negative mode a similar pattern is observed with the ions being separated by 32 rather than 18. This data also contained a strong ion or ions at m/z 297 and m/z 325.
Based on the evidence from the UV and mass spectral data, and knowledge of potential additives for the material, it is suspected that these extractables represent epoxidized glycerol fatty acid esters, such as epoxidized soybean oil, which are known to be used in PVC materials and have been observed as extractables in other studies for similar configurations (10). This substance has very few chromophores and would not be expected to have an appreciable UV absorbance even at 220 nm. Water losses observed in positive ion mode could be attributed to hydration and loss of the epoxide oxygen atoms in the ion source. The ion pattern observed in the negative mode data isn't as easily explained but may represent oxygen anion adducts of various forms of the molecule and would make sense given the even masses observed when considering the nitrogen rule. Ions observed at m/z 297 and m/z 325 are suspected to represent the individual fatty acids released from the parent tri-glyceride via hydrolysis in the ion source. As with all identifications, this assignment is considered to be tentative until more concrete evidence, such as comparison to the spectral and retention time data from a known reference standard is obtained.
Results for the 30/70 ethanol/water incubation and reflux extractions show the presence of dioctyl phthalate at much lower levels and only one of the tentatively identified epoxidized glycerol fatty acid esters. Data for the 0.9% saline incubation produced a trace amount of dioctyl phthalate in the UV 220 nm data, while a small response was once again observed for the suspected epoxidized glycerol ester. Observation of this compound may be somewhat unusual in these extracts, especially with the absence of a response for the other glycerol esters observed; however, the mass spectral data is consistent across the samples and it was not observed in the corresponding control.
A summary of the qualitative and semi-quantitative results obtained for the IV bag dichloromethane reflux, 30/70 ethanol/water reflux, and 30/70 ethanol/water incubation extracts of the IV bag can be found in Table VII.
Extractables Results for the Dichloromethane Reflux, 30/70 Ethanol/Water Reflux, and 30/70 Ethanol/Water Incubation Extracts of the IV Bag
Conclusions
A UHPLC/UV/MS method was developed for the general screening of extract samples produced during a CES. Performance of the method was demonstrated using a mixture of model compounds and illustrate its separation, ionization, and sample compatibility attributes. Results from three case studies present further support of the method's capabilities for the analysis of actual extraction samples from common packaging configurations/materials that may be encountered in a CES. It is concluded that the method is suitable to fulfill the needs of qualitative and semi-quantitative analysis of non-volatile and/or non-GC-compatible semi-volatile-type extractables from a wide range of materials and matrices encountered within a CES.
Conflict of Interest Declaration
The author declares that they have no financial or non-financial competing interests related to the work described in this paper.
- © PDA, Inc. 2014


