
Abstract
Ethanol/water mixtures are frequently used as simulating solvents in extractables studies. However, the basis for determining and justifying the right ethanol proportion in a simulating solvent for a particular drug product or solution has not been previously established.
A solvent strength model has been developed in this study, based on the correlation between the levels of a model compound, di-(2-ethylhexyl) phthalate (DEHP), extracted from a reference source material, plasticized poly-(vinyl chloride) (PVC) resin, and the proportion of ethanol in ethanol/water extractions solvents. This model was established by experimentally investigating DEHP leaching and takes the form:
 If the level of DEHP extracted from the standard source PVC resin by a drug product is measured, then the level can be input into the above equation and the proper ethanol content of the appropriate simulating solvent can be determined.
The model has been applied to certain drug products and additives used in drug products, and the proper ethanol/simulating solvents for these products have been established. Additionally, the leaching behavior revealed in this study has been established to be consistent with previously published research and a mechanism for the observed behavior has been proposed.
LAY ABSTRACT: Although ethanol/water mixtures are frequently used as simulating solvents in extractables studies, it is difficult to establish and justify what the right proportion of ethanol is for a particular drug product. A solvent strength model has been developed based on the leaching behavior of a model compound, di-(2-ethylhexyl) phthalate (DEHP), from a reference source material, plasticized poly-(vinyl chloride) (PVC). By measuring the level of DEHP leached into a drug product from the reference source material, one can use the model to calculate the correct ethanol proportion in the simulating solvent.
Using this approach, ethanol/water proportions have been obtained for certain drug products. Additionally, the leaching profiles for DEHP obtained in this study were noted to be consistent with such profiles for other extractables from the PVC reference source material and with other investigations of ethanol/water as model stimulants.
Introduction
During their manufacturing, storage, and administration, pharmaceutical drug products, their precursor intermediates, and/or other pharmaceutically-relevant solutions may be contacted by materials, components, and systems. Such contact may result in an interaction between these solutions and the materials, components, or systems. One such interaction is the movement of substances from the materials, components, or systems and into the drug product, which is of concern due to the potential product impact of such substances. Proper assessment of the risk and management of the hazard posed by such substances (leachables) involves identifying these substances and establishing the levels to which they will accumulate in the finished drug product, as these two pieces of information establish the magnitude of the patient exposure (dose) and the hazard posed by an individual substance.
Such a leachables assessment is typically preceded, supported, or augmented by an extractables assessment. In the extractables assessment, materials or components used in manufacturing, packaging, and delivery systems (or possibly the systems themselves) are extracted with an appropriate medium, and the medium is tested for extracted substances. It is clear that an important design parameter in the extractables assessment is the composition of the extracting medium. Strategic requirements for the extraction media are clearly and consistently established in the regulatory and best demonstrated practice literature. That is,
“The ideal situation is for the extracting solvent to have the same propensity to extract substances as the dosage form, thus obtaining the same quantitative extraction profile” (1).
“The solvent used for extraction should have the same propensity to extract substances as the active substance/dosage form” (2).
“The solvents used during a controlled extraction study should have similar extracting properties to the drug product vehicle” (3).
“The overriding requirement for the simulating medium is that it has the same propensity to accumulate leached substances as the therapeutic product” (4).
It is self-evident that the most logical means to meet this strategic requirement is to use the drug product itself as the extracting medium. However, it is often the case that the use of the drug product as an extraction medium complicates the processes of extractables discovery, identification, and quantification to such an extent that accomplishing these objectives is beyond the capabilities of fiscally responsible, state-of-the-art analytical methods and practices. For example, the drug product might be composed of ingredients, impurities, degradation products, and the like that effectively mask extracted substances. Such a circumstance is exacerbated by a concentration mismatch between the drug product ingredients, which are present in the drug product in macro-scale quantities, and extractables, which are typically present in trace quantities. Additionally, it may be that the drug product is not compatible with the sample preparation and analytical processes required for extractables assessment at trace levels. From a more practical perspective, the drug product may have issues such as high expense, scarcity, difficulty in handling and/or disposal, and the like. Finally, some material systems, such as plastic containers, may be used with many different drug products. In such situations it is more desirable to perform a single simulated extraction study that covers all potential drug products than it is to perform multiple extraction studies with each individual drug product.
Thus extraction studies are frequently performed with simulating extraction solvents. Clearly in such circumstances it is necessary to establish and justify the composition of the solvent. So doing essentially requires that the extracting power of two chemically dissimilar entities, the drug product and the simulating solvent, be established and ultimately equated. To accomplish this objective, one must account for all the physiochemical characteristics of a drug product and/or simulating solvent that influence its extracting power. As either the extracting power of the drug product or the complexity of the interaction increases, it becomes more scientifically challenging to identify and justify a simulating solvent because the fundamental scientific information necessary to do so either does not exist or is not directly applicable.
The purpose of this study was to examine the extracting properties of drug products and simulating solvents with the intent of developing a methodology to establish and justify simulating solvents for chemically diverse pharmaceutical solution products.
Experimental
Reference Source Material
The reference source materials were two lots of (di-(2-ethylhexyl) phthalate)–plasticized poly-(vinyl chloride) (DEHP-PVC) resins. The resins were compositionally similar, especially in terms of their DEHP levels [44.0 parts per hundred (phr) and 45.0 phr, respectively]. The use of two resins was necessary due to insufficient quantities of the first resin to complete the study. As the two materials contain proportionally large amounts of DEHP, their slight compositional differences are irrelevant in terms of their ability to act as a source of extractable DEHP.
Generation of the Model Extracts
Set #1
The test extracts for Set #1 were generated as follows. Portions of the resin lot #1 (5, 10, or 15 g) were transferred to appropriately sized glass bottles (extraction vessels). A 150 mL portion of the appropriate extracting solvent was added to each individual extraction vessel. Extraction solvents included a pH 3 salt solution, a pH 9 buffer, and ethanol/water mixtures in the following proportions: 20/80, 40/60, 60/40, and 80/20 (v/v). Replicate extraction units for each material weight–extraction solvent couple were generated. Duplicate extraction units for each material weight–extraction solvent couple were stored at approximately 55 °C for periods of 1, 2, 3, or 4 weeks, at which time they were removed from the heat source, equilibrated to ambient temperature, and stored while awaiting analysis. This temperature and these durations were chosen because it was anticipated that they would be adequate to achieve equilibrium between the source material and the extraction solvents.
Set #2
The test extracts for Set #2 were generated as follows. Six gram portions of the resin lot #2 were transferred to appropriately sized glass bottles (extraction vessels). A 90 mL portion of the appropriate extraction solvent was added to each individual extraction vessel. It is noted that the material weight to extraction solvent bottle for both Set #1 and Set #2 are the same (Set #1 = 10 g per 150 mL, Set #2 = 6 g per 90 mL, both equal to 0.67 g/mL). Extraction solvents included ethanol/water mixtures in the following proportions: 30/70, 40/60, 45/55, 50/50, 55/45, 60/40, 70/30, and 75/25 ethanol/water (v/v). Triplicate extraction units for each ethanol/water level were stored at approximately 55 °C for a period of approximately 2 weeks, after which time they were removed from the heat source, equilibrated to ambient temperature, and stored while awaiting analysis.
Generation of the Drug Product Extracts
In addition to the extracts generated in the ethanol/water and pH extreme solvents, extracts were generated in drug products including a lipid-containing matrix, an albumin-based matrix, and a surfactant-based matrix. Considering the lipid-based solvent, the starting lipid matrix was a laboratory-prepared batch of Baxter's ClinOleic 20% Intravenous Lipid Emulsion containing 20% lipid. This matrix was used “as is” (20% level) and was diluted with water to produce 10% and 5% lipid matrices. The starting albumin matrices were Baxter's Albumin (Human) USP 25% Solution and Albumin (Human) 5% Solution. These matrices were used “as is” and additionally the 25% albumin was diluted with water to produce a 10% albumin solution. Lastly, solvents containing Polysorbate 80 at levels of 5%, 1%, and 0.2% were prepared by dissolution of this reagent (analytical grade, Sigma Aldrich Chemie Gmbh, Steinheim, CH) in water.
Extraction units for these matrices were prepared by adding 10 g portions of resin lot #2 to glass extraction bottles containing 150 mL of the appropriate extraction matrix. Triplicate extraction units were generated for each extraction matrix. Extraction blanks containing only the matrices were also generated. The extraction units and extraction blanks were extracted at 55 °C for approximately 10 days, at which time they were removed from the heat source, equilibrated to ambient temperature, and stored while awaiting analysis.
After their proper storage at 55 °C, all the extraction units were removed from the heat source and equilibrated to ambient temperature. The extraction units were subsequently stored at ambient temperature for between 3 and 6 months prior to analysis to ensure that equilibrium was established prior to analysis.
Sample Testing
Screening for Extractables, Model Extracts
The extracts for the Set #1 model solvents were screened to establish their organic extractables profile. Test methods used in this screening included UV absorbance (spectrum between wavelengths of 200 to 360 nm, specific absorbances recorded at wavelengths of 210, 220, 240, and 280 nm) and gas chromatography and liquid chromatography (for organic extractables). The levels of the individual organic extractables (including DEHP) were quantified via the use of either calibration curves generated with external reference standards or internal standard response factors.
Quantitative Analysis for DEHP
The extracts for Set #2 model solvents and all drug product extracts were tested for their levels of DEHP by various liquid chromatography with tandem mass spectrometry (LC/MS/MS) detection methods that were developed for this purpose. Operational characteristics of these methods are contained in Tables I and II.
Operating Parameters for the LC/MS/MS Method for Measuring DEHP in the Lipid Test Extracts
Operating Parameters for the LC/MS/MS Method for Measuring DEHP in the Albumin and Polysorbate 80 Test Extracts
Method Performance (Detection and Recovery)
The UV method and the LC/MS and GC/MS screening method met their respective system suitability requirements as per the relevant operating documents. Additionally, the various methods utilized to quantify DEHP in the Set #2 model solvent extracts and the drug products were assessed for accuracy (recovery) by testing portions of relevant samples that had been spiked to contain a known quantity of this analyte. For example, the recovery of DEHP spiked into lipid-containing samples at a level of approximately 10 mg/L ranged from 70% to 87%. The recovery of DEHP spiked into the 5% and 25% albumin matrices at levels of approximately 5 and 25 mg/L ranged from 87% to 119%, and the precision of the testing of three individual spike replicates was less than 7% relative standard deviation (RSD). The recovery of DEHP spiked into the 40/60 and 60/40 ethanol/water model solvents at levels of approximately 5 and 25 mg/L ranged from 99% to 120%, and the precision of the testing of three individual spike replicates was less than 5% RSD. The recovery of DEHP spiked into the 0.2% and 5% Polysorbate 80 matrices at levels of approximately 5 and 25 mg/L ranged from 97% to 111%, and the precision of the testing of three individual spike replicates was less than 7% RSD. This performance was deemed to be adequate for this study.
Results
Characterization of the Set #1 Extracts
Although the primary purpose of this study was to track changing levels of specifically targeted extractables as a function of extraction solvent composition, chromatographic profiling of the Set #1 extracts provided some information about the extractables profile of the standard reference material.
Originally, the Set #1 experiment was set up to examine the effect of material weight to extraction solution volume ratio and extraction time on the magnitude of DEHP leaching, and thus the experiment included extraction replicates with varying amounts of resin (5, 10, and 15 g) and various extraction durations (1 to 4 weeks). Ultimately these variables did not materially affect the measured levels of the extractables in the extracts, and thus they were not considered to be relevant and the experimental data for the Set #1 was collapsed into datasets as a function of solvent composition only.
Accumulation data for those extractables that were targeted for trend analysis are summarized in Table III. Although several other extractables were tentatively identified via both the GC and LC screening methods, relatively few of these additional extractables were reproducibly detected in a majority of the extracts at levels that would classify them as “major” extractables appropriate for use as a model compound.
Mean Levels of Extracted Targeted Organic Extractables
Characterization of the Set #2 Extracts
In order to achieve greater resolution in terms of trends in DEHP concentration versus ethanol/water content, Set #2 extracts were generated and tested. The Set #2 extracts focused on the ethanol/water ratios of between 30/70 to 75/35, as the data from Table III suggested that this region of solvent proportion was one in which DEHP levels increased substantially.
The resulting DEHP concentration and ethanol/water proportion results are contained in Table IV. In reviewing this data it was observed that the various extracts could be sorted into several groups of comparable ethanol/water proportions. The data was sorted in this manner, and mean values for the DEHP concentrations and ethanol/water proportions were calculated for each group to facilitate the building of the solvent model.
DEHP Concentration and Ethanol/Water Proportions for the Set #2 Solvent Extracts
Levels of Extracted DEHP in Drug Product Extracts
The levels of DEHP measured in the drug product extracts are summarized in Table V.
Mean ± 1 Standard Deviation for the DEHP Concentration in the Drug Product Extracts (mg/L, n = 3)
Discussion—the Simulating Solvent Strength Model
General
As noted previously, extractables studies can be performed using an extraction solvent whose extracting power mimics that of a single drug product or a group of drug products. Such a strategy is adopted in the circumstance in which it is more efficient or effective to test a simulating solvent than it is to test one or more drug products. In such a situation, a key aspect in designing such an extractables study is to establish and justify the composition of the simulating solvent.
Two critical compositional aspects of a simulating solvent (and the drug products that are simulated) are their pH and their polarity. Simulating a drug product's pH is relatively straightforward and typically involves the use of buffers that are chemically less complex than the drug product. Simulating a drug product's polarity is a bit more difficult, as the chemical factors affecting polarity are varied and complex.
Binary mixtures of a short-chained alcohol (such as ethanol and isopropanol) and water are commonly used as an extraction simulant for aqueous drug products. In such cases, one adjusts the proportion of the alcohol and water in the simulating solvent so that the polarity (extracting power) of the stimulant matches the polarity (extracting power) of the drug product. Thus the key issue is establishing and justifying the proportion of the alcohol in the extraction solvent.
The primary contribution of this study is to establish a means of determining and justifying the proportion of ethanol and water in simulating solvents relevant to drug products that are (a) packaged in plastic container systems, (b) administered via plastic devices, or (c) manufactured using systems that consist of plastic components. These products include lipid-containing formulations, protein-containing formulations, products derived from plasma and blood, and drug products containing solubilizing agents.
To accomplish this objective, this study has identified DEHP–plasticized PVC as the standard source material. This is an appropriate source material because it contains a target model compound (DEHP) which is (a) present in the test material in large quantities (meaning that its total pool will not be exhausted under typical and relevant extraction conditions), (b) homogeneously distributed throughout the test material (avoiding complications due to diffusion affects), (c) analytically expedient, and (d) relatively stable under the commonly employed conditions of extraction. The solvent simulating strength model is generated by extracting the standard source material with solvents of different extracting power (i.e., different alcohol/water proportions), allowing the extractions to be complete (establish thermodynamic equilibrium), and then testing the extracts for their levels of the target model compound. The relationship between the concentration of the extracted target model compound and the extracting power of the ethanol/water mixtures (for example, proportion of ethanol and/or polarity) establishes the simulating solvent strength model (SSSM).
In order to apply the SSSM to a given drug product, the standard source material must be extracted by the drug product and the level of extracted target model compound in the drug product at equilibrium must be measured. Inputting the extracted equilibrium concentration of the target model compound into the SSSM produces, as output, the proper simulating solvent composition (for example, proportion of ethanol or polarity).
Solvent Polarity Calculation
The polarity of a binary mixture is the combination of the polarities (P) of the mixture's constituents, obtained by considering the mole fraction (Φ) of each constituent (for example, A and B):
 For ethanol and water, relevant values of PE and PW are 13.65 and 25.52 cal1/2 cm−3/2 (5). These values of PE and PW were used to calculate the polarity of the ethanol/water mixtures used in this study, and the results are contained in Table VI. Although the term polarity is used throughout this manuscript, it is understood that the quantity used is in fact the solvent cohesion energy density.
Polarities (cal1/2 cm-3/2) of Ethanol/Water Mixtures
Effect of Ethanol/Water Proportion and Polarity on the Levels of Extracted Substances
As noted previously, DEHP has been established as the target model compound. Figure 1 illustrates the trend in the accumulation levels of DEHP in ethanol/water extracts, expressed both in terms of percent ethanol in the solvent and the solvent's calculated polarity. As noted in this figure, a smooth curve can be fit to the data, although the shape of the curve and its resulting regression model is complex. One readily notes that the relationship between percent ethanol (and polarity) and extracted DEHP concentration is different, low ethanol content (≈40% or less) and high ethanol content (≈60% or more), with the effect of ethanol content being much more profound at the higher ethanol proportions. This suggests that the extracting power of ethanol/water mixtures is not solely reflected in their intrinsic polarity. The region between 40% and 60% ethanol appears to be that place on the percent ethanol continuum where a significant change in the mixture's solvating properties occurs.

Levels of DEHP extracted from the PVC standard source material by various simulating solvents containing ethanol/water.
Although DEHP was chosen as the target model compound, there is no overriding reason that it should behave differently from other extractables with respect to the relationship between accumulation levels and ethanol proportions. To examine this statement, Figures 2 through 6 exhibit the trend in the accumulation of other targeted extractables (and general solution properties) versus solvent polarity (see Table III for the data illustrated in these figures).

Levels of various extractables extracted from the PVC source reference material by various simulating solvents containing ethanol/water. A = UV absorbance at 210 nm as a surrogate for total extractables. B = 2-ethyl-1-hexanol (2-EHO).

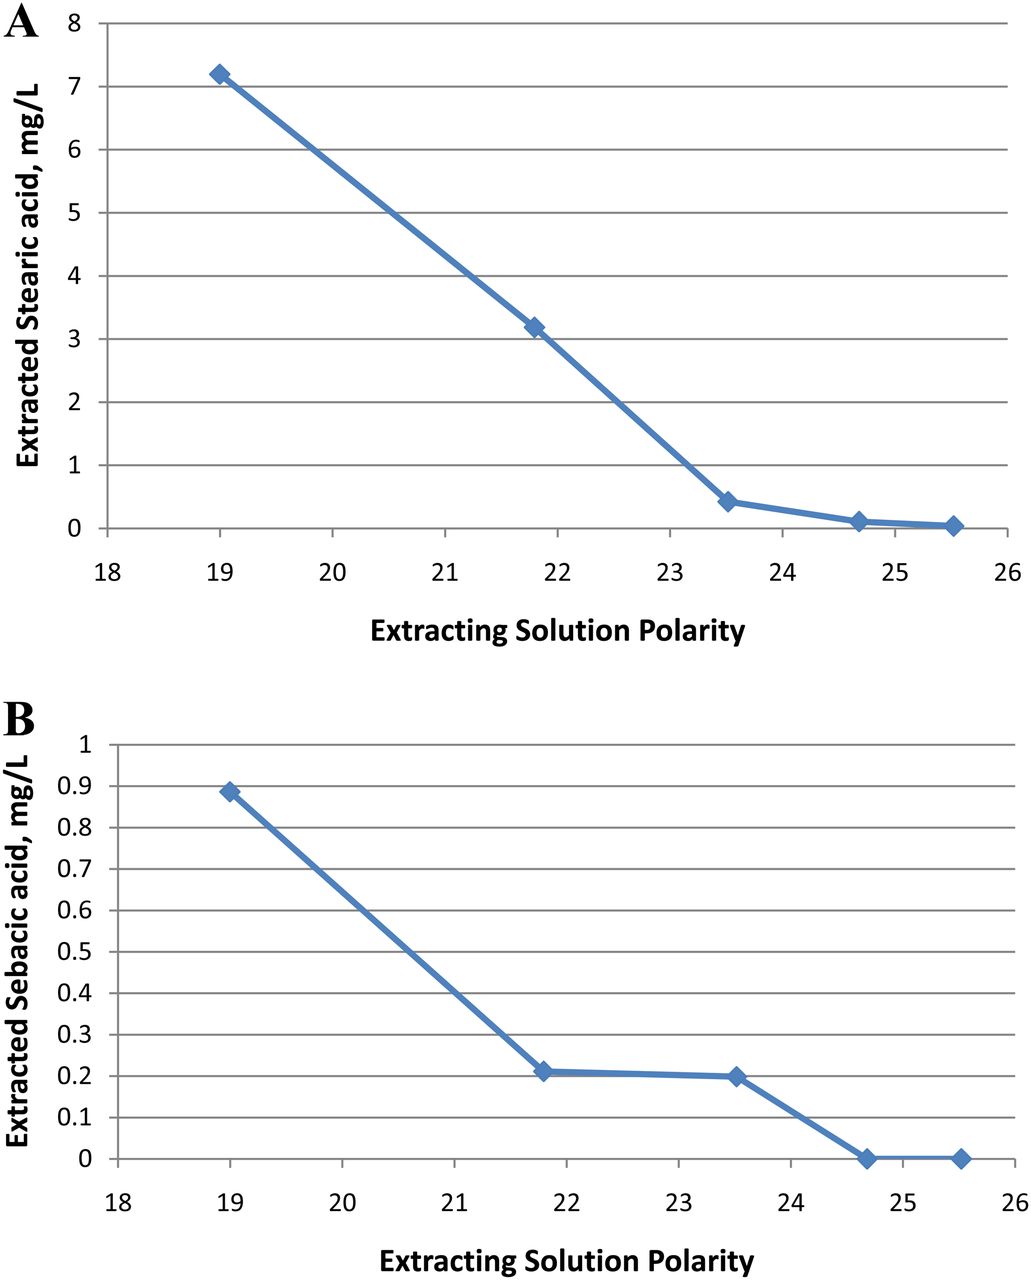
Levels of various extractables extracted from the PVC standard reference material by various simulating solvents containing ethanol/water. A = stearic acid; B = sebacic acid.

Levels of various extractables extracted from the PVC standard reference material by various simulating solvents containing ethanol/water. A = azelaic acid; B = ELO-related substances. The ELO-related substances are those extractables that produced peaks in the LC/MS + ion total ion current (TIC) chromatograms that were associated with substances whose inferred structural characteristics linked them to the ELO (epoxidized linseed oil) which is present in the PVC material as a secondary plasticizer in levels of approximately 10% by weight. As the ELO-related substances could not be individually quantified (no relevant standard available), their peak area is used as a surrogate for their concentration.

Levels of various extractables extracted from the PVC standard reference material by various simulating solvents containing ethanol/water. A = MEHP; B = 9,10-epoxy stearic acid.

Levels of various extractables extracted from the PVC standard reference material by various simulating solvents containing ethanol/water. A = myristic acid; B = palmitic acid.
Examination of Figures 1 through 6 establishes that the extractables whose behaviors were quantitatively investigated fall into three categories, depending on the shape of their extraction profiles, especially at the lowest polarity (highest proportion of ethanol). Category 1 includes those substances, such as DEHP and total extractables (reflected in UV absorbance measured at 210 nm), whose profiles reflect a large acceleration in leaching as the ethanol proportion increases past roughly 50%. A second category of substances, including stearic acid, epoxidized linseed oil (ELO)-related substances, sebacic acid, and azelaic acid, also exhibit an increase in extracted levels as extraction solvent polarity decreases but at a rate that does not appear to be as steep as it is for DEHP. Lastly, the third category of extractables, including palmitc acid, myristic acid, 9,10-hydroxystearic acid, and mono-2-ethylhexyl phthalate (MEHP), have extraction profiles that level off at the highest proportions of ethanol.
A possible explanation for this phenomenon is the available pool of the extractable in the PVC standard test material. As the source material is 30% or more by weight DEHP, the available pool of this substances far exceeds the amount of this substance that was extracted from the material, even at the highest ethanol proportion. Similarly, one anticipates that the available pool of all potential extractables would also be sufficiently large that the pool of these extractables would be largely unchanged by extraction. Thus the extraction profiles for DEHP and total extractables is strongly affected by the ethanol content of the extracting solvent, up to the largest content examined in this study.
The second category of targeted extractables, including stearic acid, 1-ethyl hexanol, and ELO-related substances, exhibits a less pronounced acceleration of extraction at the higher ethanol proportions than does DEHP. This behavior is consistent with the observation that the available pool of these substances is less than that of DEHP. However, the pools of these substances are not inconsiderable, as ELO and metal strearate salts are intentional additives in the DEHP material. Thus the behavior of these substances is driven by the situation that their available pools are being depleted by the extraction solvents with the highest proportion of ethanol.
While sebacic acid and azealic acid have similar extraction profiles to the other category 2 extrctables, it is not likely that their extraction profiles are driven by the same limited pool as the other category 2 extractables. This is the case because these substances, unlike the other category 2 extractables, are not intentionally added to the PVC standard source material. Rather, these substances are likely degradation products of other extractables, and thus their extraction profile mirrors that of their parent compound.
The third category of targeted extractables is those extractables whose extraction profiles actually exhibit a plateau at the highest ethanol proportions. These extractables, which include MEHP, palmitic acid, myristic acid, and 9,10-epoxy stearic acid, are not intentional additives but rather are known impurities in intentional additives. For example, MEHP is linked to DEHP, myristic and palmitc acids are linked to metal stearates, and the epoxy stearic acid is linked to the ELO. As these extractables are impurities in intentional PVC additives, it is likely that their available pools in the PVC are relatively low. Thus the extraction profiles develop a plateau at the highest ethanol proportions because the available pool of these substances is exhausted at a certain ethanol proportions. The extracted levels of these substances cannot increase with increasing solvent extracting power (ethanol content) because there is no more of the substance remaining in the material to extract.
The Simulating Solvent Strength Model
The simulating solvent strength model is applied with the DEHP concentration of the simulating solvent as the input (x) variable and the percent ethanol (or polarity) as the output (y) variable. Thus the model is the inverse of the extraction profiles presented previously. Such an inverse function for the target model compound (DEHP) is shown in Figure 7. Although the best fit curve is smooth, it is difficult to obtain an equation that fits the curve via regression analysis. Thus an equation was empirically fitted to the curve by a manual process of error minimization. Specifically, an algorithm can be created that computes the correlation coefficient (r2) for a line that compares two datasets. If one dataset is the actual percent ethanol of the simulating solvent used in this study, and the other dataset is calculated percent ethanol based on a proposed simulating solvent strength model, then the appropriate solvent strength model is that model which produces the highest correlation coefficient, as the best model will produce a set of percent ethanol estimates that are the same as the actual percent ethanol values.

Relationship between the percent ethanol in the extracting solvent and extracted DEHP levels. This Figure is the mathematical inverse of Figure 1.
The simulating solvent strength model that is obtained by this empirical process is based on the tenth power of the DEHP concentration:

Figure 8 illustrates both this model and the resulting linear regression that it produced in the calculated versus known percent ethanol plot. The fact that the model has a zero intercept is significant, as the level of DEHP measured in water extracts is so low as to essentially be zero.

The simulating solvent strength model, expressed in terms of percent ethanol in the simulating extraction solvent (upper graph). The percent ethanol in a simulating solvent for a drug product is related to the tenth root of the DEHP concentration measured in that drug product. The lower graph is the regression algorithm that was used to empirically establish the model. If the model equation were a perfect fit to the experimental data, then the regression line in the lower figure would have a slope of 1, an intercept of 0, and a correlation coefficient of 1.0. The actual values obtained for the regression line are very close to the perfect fit expectations.
Figure 9 illustrates the model based on polarity of the extracting solvent. In this case we expect the y-intercept to reflect the polarity of water. In fact the intercept obtained, 25.22, closely matches the polarity of water that was used in this study (25.52). For the polarity model, a fifth root expression is empirically obtained as follows:

The simulating solvent strength model, expressed in terms of polarity in the simulating extraction solvent (upper graph). The percent ethanol in a simulating solvent for a drug product is related to the fifth root of the DEHP concentration measured in that drug product. The lower graph is the regression algorithm that was used to empirically establish the model. If the model equation were a perfect fit to the experimental data, then the regression line in the lower figure would have a slope of 1, an intercept of 0, and a correlation coefficient of 1.0. The actual values obtained for the regression line are very close to the perfect fit expectations.
Application of the Simulating Solvent Strength Model to Drug Products
As noted previously, the DEHP level in drug products was measured. These measured DEHP levels can be input into eqs 2 and 3 to establish what the polarity of the drug product is and what its appropriate ethanol/water simulating solvent would be. Additionally, the levels of DEHP leaching into blood and blood fractions have been extensively reported (for example, references 6⇓⇓⇓⇓⇓–12). Considering this information, it was estimated that the level of DEHP in blood and blood fractions is approximately 100 mg/L. This estimate can also be input into eqs 2 and 3 to produce the polarity and ethanol/water estimates for blood. These determinations for ethanol/water stimulant and polarity are summarized in Table VII.
Forecasted Ethanol/Water Simulants and Polarities of Drug Products
Other studies reported in the literature are relevant to the concept of establishing the proper ethanol/water proportion to mimic a specific drug product or drug product formulation component. For example, Pearson and Trissel studied the leaching of DEHP from PVC bags into selected drugs and formulation components (13). Considering formulation components, these authors added certain formulation components in certain proportions to 5% dextrose stored in a PVC bag and then studied the leaching of DEHP at ambient temperature for up to 24 h. These findings, summarized in Table VIII, are consistent with the results in this study, and furthermore they establish that glycols (such as polyethylene glycol and propylene glycol) are weak solubilizing agents and can be simulated by ethanol/water mixtures containing 25% ethanol or less.
Leaching of DEHP From PVC Bags by various Formulation Components. (from Reference 13)
Cremophor EL (polyoxyethylated castor oil) is a commonly used solubilizing agent for chemotherapeutic drug products. Cremophor's ability to extract DEHP from PVC bags has been investigated in the context of establishing the compatibility of reconstituted chemotherapeutics in diluents stored in PVC bags. For example, Faouzi et al. studied the leaching of DEHP from PVC bags by diluted drug formulations containing approximately 1–2% Chemophor (after dilution) (14, 15). The levels of DEHP leached after 24 h of room temperature extraction were 60–200 mg/L. Application of the simulating solvent strength model to these concentrations would establish 50/50 ethanol/water as an appropriate simulant for drug formulations containing 1–2% Cremophor EL.
Additional Thoughts on Using of Ethanol/water as a Simulating Solvent
The use of alcohol/water mixtures as stimulants for foods and pharmaceuticals in packaging extraction studies is well established. Considering pharmaceutical applications specifically, both ethanol/water and isopropanol/water mixtures have been proposed as simulating solvent systems (16⇓⇓⇓–20). The contribution of this study is not primarily to justify the use of the ethanol/water mixture as an appropriate simulating solvent but rather to establish the means by which the proper proportion of ethanol and water can be established and justified for a specific aqueous parenteral drug product.
The results of this study, as reflected in the shape of the extraction profile shown in Figure 1, are consistent with previously published studies. For example, Corely and associated studied the leaching of DEHP from PVC bags into five diluents solutions whose composition was adjusted to include varying amounts of ethanol (21). Similarly, Messadi and Vergnaud studied the extraction of DEHP from PVC disks into ethanol/water mixtures (22). Their results, illustrated in Figure 10, produce DEHP extraction profiles that are similar in shape to that obtained in this study (see Figure 1). Additionally, Batlle et al. have reported on the extraction of pesticides from an agricultural plastic by ethanol/water mixtures and observed a similar relationship between extracted amount and extraction solvent composition, as shown in Figure 11 (23). Further, these extraction profiles are consistent with solubility data published for various compounds, including drug substances and extractables, in ethanol/water mixtures (24⇓⇓⇓–28). For example, solubility plots for several drug substances have the same shape as Figures 1 and 10 (see Figure 12; data obtained from reference 24).

Levels of DEHP extracted from the PVC articles various by simulating solvents containing ethanol/water. A = PVC Bags, data from Corely et al., reference 21. The plotted data represents the mean DEHP level reported in five aqueous diluents that were fortified with ethanol. B = PVC disks, data from Messadi and Vergnaud, reference 22. The shape of these plots is similar to that shown in Figure 1, supporting the results of this study.

Extraction of the pesticide bromopropylate from an agricultural plastic material via ethanol/water mixtures (from Batlle et al., reference 23). As was the case in this study, extraction of the pesticide is enhanced as the proportion of ethanol in the extracting solvent increases.

Solubility of three drugs as a function of ethanol proportion in ethanol/water mixtures (from Ali et al., reference 24). The shape of the solubility plots are similar to the DEHP extraction profiles (Figures 1 and 10), as extraction of DEHP to an equilibrium concentration is, in essence, a solubility plot for DEHP. This is the case as the total pool of DEHP in the source PVC is large compared to the equilibrium DEHP concentrations in the extraction solutions.
Although Figures 10 through 12 corroborate the findings of this study, they do not provide an explanation for the observed behavior, particularly with respect to the increase in the slope of the extraction profile at higher ethanol proportions. Indeed, one could interpret Figure 1 as indicating that there is a change in the extraction mechanism as a function of ethanol proportion, with one mechanism being relevant at ethanol proportions less than approximately 45%, another mechanism being relevant at ethanol proportions greater than approximately 55%, and the region between 45% and 55% representing a transition between mechanisms.
Pursuing an explanation further, ethanol/water mixtures have been reported to exhibit abnormalities in properties such as negative partial molar volumes, differential heats of solution the chemical shift of the hydrogens in water, and others. Multiple authors have noted that the ethanol/water mixtures tend to have zones of composition that are associated with varying properties, although the exact delineation of the zones differ somewhat from study to study (29⇓⇓⇓⇓⇓–35). Within these zones the abnormalities have been linked to structural characteristics of the mixtures that are dependent on the ethanol proportion. For example, Parke and Birch report that the packing mechanisms of ethanol in water differs as the proportion of ethanol changes (29). At low proportions, ethanol/water interactions are influenced by the formation of cage-like structures which form around the hydrophobic ends of ethanol. At higher proportions, the formation of chains or rings of ethanol dictates the mixture's packing characteristics. Such changes in the structure of the ethanol/water mixtures would affect the extracting power of the mixtures consistent with the trends noted in this study.
Conclusion
A simulating solvent strength model, based on the extraction of a model compound (DEHP) from a reference source material (plasticized PVC resin), has been developed and justified to link the extraction power of ethanol/water mixtures to the extracting power of aqueous parenteral drug products. The trends in DEHP extraction, which form the basis of the model, have been demonstrated to be consistent with results obtained in previously reported studies and furthermore are consistent with the reported properties of ethanol/water mixtures. The model has been used to produce recommendations for simulating solvents for various pharmaceutical drug products or solutions, including lipids, albumin, plasma and blood, and drug products containing commonly used solubilizing agents such as Polysorbate 80, Chemophore EL, and polyethylene glycols.
It is important to note that the developed model is a thermodynamic model in that it is valid when equilibrium is established between the plastic material and the contact solution. Equilibrium is clearly achieved in the case of the specific model compound and the reference source material used in this study as the properties of the source material (high surface area, favorable diffusion coefficient, and homogeneous distribution of the model compound) favor the rapid saturation of the contact solution with the model compound (and equilibrium is achieved). As migration of the model compound through the reference material is largely unnecessary, equilibrium is quickly achieved. Such a situation may not be replicated in certain pharmaceutical applications. For example, consider the case of a multi-layered film that is used as the container body of a packaging system for a liquid dosage form. If the extractable of interest is present in a non-solution contact layer of the film, its accumulation in solution may be limited by its rate of diffusion through the film. This is important as the nature of the simulating solvent (ethanol) and the dosage form that it is simulating may affect the diffusion rate. For example, when one contrasts an ethanol/water mixture with a lipid-containing drug product, one notes that they are fundamentally different in terms of their ability to penetrate the film. Specifically, the diffusion rate in the ethanol/water solvent system will be faster than it is for the lipid-containing product because ethanol is a penetrating solvent while the lipid is not.
In such a circumstance (penetrating simulant, non-penetrating drug product), the ethanol/water simulant will overestimate an extractable's accumulation level in the drug product until the contact duration is long enough for equilibrium to be achieved, at which point the accumulation levels in the model stimulant and in the drug product will be the same.
- © PDA, Inc. 2015
References


Jump to section
Related Articles
Cited By...
- Comparison of the Extraction Properties of Binary Polysorbate 80/Water and Isopropanol/Water Solutions for Organic Substances Originating from a Parenteral Infusion Pump
- Comparison of a Lyophilized Drug Product to Other Solid and Liquid Media for the Extraction of Elastomeric Oligomers from a Butyl Rubber Stopper
- Development and Justification of a Risk Evaluation Matrix To Guide Chemical Testing Necessary To Select and Qualify Plastic Components Used in Production Systems for Pharmaceutical Products