
Abstract
Degradation of the surfactant polysorbate (PS) by enzyme impurities has been previously suggested as a mechanism for the formation of visible and subvisible particles that affect product quality. Although chemical degradation pathways of PS, such as oxidation and acid/base hydrolysis, have been previously characterized, enzymatic degradation of PS remains poorly understood. In this report, enzyme-mediated hydrolysis of the major components of PS was monitored using an evaporative light scattering detection–high-performance liquid chromatography method. PS20 and PS80 tested contained 99% of laurate and 98% oleate esters, respectively, were heterogeneous with respect to head group, and contained a distribution of ester types. Carboxylester hydrolases tested included those from Pseudomonas cepacia, Thermomyces lanuginosus, Candida antarctica, rabbit liver, and pig pancreas. PS hydrolysis was monitored by observing the change in the peak area of major PS components over time and quantified using a parameter called t50, which was defined as the time required for each peak to reach 50% of its initial value. Time course experiments suggested that PS hydrolysis was dependent on the order of esters (mono-, di-, or triester), the identity of the hydrophilic head group (sorbitan or isosorbide), and the identity of the fatty acid ester tail (C12 vs C18:1). In addition, the pattern of PS hydrolysis was unique to the type of enzyme used. Importantly, we observed that no PS component was completely resistant to the carboxylester hydrolases tested here. Our results illustrate a potential fingerprint approach that could be useful in verifying enzyme-mediated PS degradation in drug substance and provide an improved understanding of the complexity of PS degradation in the presence of enzymes.
LAY ABSTRACT: Degradation of the non-ionic surfactant polysorbate (PS) has been reported to lead to the formation of visible and subvisible particles that affect product quality. Chemical degradation pathways of PS, such as oxidation and acid/base hydrolysis, have been previously studied, but enzymatic degradation of PS remains poorly understood. In this study, enzyme-mediated hydrolysis of the major components in a heterogeneous mixture of PS20 or PS80 was monitored using an evaporative light scattering detection–high-performance liquid chromatography method. Carboxylester hydrolases from a broad range of organisms were tested, including enzymes from Pseudomonas cepacia, Thermomyces lanuginosus, Candida antarctica, rabbit liver, and pig pancreas. Time course experiments suggested that PS hydrolysis was dependent on the order of esters (mono-, di-, or triester), the identity of the hydrophilic head group (sorbitan or isosorbide), the identity of the fatty acid ester tail (C12 vs C18:1), and the identity of the enzyme. Importantly, no PS component was completely resistant to all the carboxylester hydrolases tested here. Our results illustrate a potential fingerprint approach that could be useful in verifying or identifying enzyme-mediated PS degradation in drug substance and provide an improved understanding of the complexity of PS degradation in the presence of enzymes.
Introduction
Polysorbates (PSs) are a class of non-ionic surfactant utilized in industrial, pharmaceutical, and biotechnological applications. In biotherapeutic protein formulations they prevent aggregation, minimize surface adsorption at the air-liquid interface (1), and have been shown to be effective against other stresses, such as freeze thawing (2) and agitation (3). They are widely used because of their low critical micelle concentration (CMC) (1), high hydrophile–lipophile balance, biocompatibility, and low toxicity (4). PSs are amphipathic molecules composed of a hydrophilic head group, polyoxyethelene (POE) sorbitan or isosorbide, linked to hydrophobic fatty acid esters (Figure 1). Although there are a number of commercially available PSs, the most frequently used in biotherapeutic protein formulations are PS20 (Tween® 20) or PS80 (Tween® 80) (1). Recent research has shown that commercially produced PS20 and PS80 are not simple molecules like previously thought. Instead, they are complex heterogeneous mixtures of mono-, di-, and triesters that contain a distribution of fatty acid chain lengths with varying degrees of unsaturation (5). Pure standards of individual components in PS are currently unavailable. This is likely due to the complex chemical synthetic pathway of PS—which includes dehydration of sorbitol, which yields sorbitans and isosorbides, esterification with fatty acids (with 1–4 esters at multiple sites) and ethoxylation—that produces a large mixture of products (5). In addition, PSs often contain impurities from manufacturing or storage, such as free fatty acids, polyethylene glycol (PEG), POE, POE sorbitol anhydrides, aldehydes, ketones, peroxides, and others (6, 7). Recently, efforts have been made to quantify impurities and components of heterogeneous commercial PS preparations (8, 9) and identified the presence of sorbitol polyethoxylate, a non-surfactant component (9, 10). In addition, since 2004 the European Pharmacopoeia, and later the United States Pharmacopoeia, have defined composition of fatty acid (C6 to C18:2) in PS material, even though PS20 and PS80 are defined in the Pharmacopoeia simply as laurate or oleate esters, respectively.

Structural diversity of major components of polysorbates (PS). In this study, PS20 is primarily composed laurate (C12) esters, while PS80 is primarily composed of oleate (C18:1) esters. The “R” groups show possible attachment site(s) of the hydrocarbon chain of the fatty acid tail to the head group of POE sorbitan or POE isosorbide. The monoesters contain one fatty acid tail, while the remaining “R” groups would be hydroxyl (-OH) moieties. The diesters contain two fatty acid tails, while the remaining “R” groups would be hydroxyl moieties, and so on. Note that the maximum number of esters the isosorbide can harbor is two, while sorbitan could potentially harbor four.
A drawback of PSs is that they have been widely shown to be prone to degradation by oxidation (8, 11) and/or hydrolysis (12), contributing to the formation of impurities. Both enzymatic and chemical degradation have been suggested to decrease the ability of PS to act as a stabilizer in protein formulations, and PS degradation been documented to lead to the formation of particulates that affect drug quality and stability (13, 14). Hydrolysis of PSs can occur by acid/base (12) and/or enzymatic mechanisms (13, 15). Acid/base mechanisms of PS degradation have been previously characterized (1, 12, 16), but enzyme-mediated hydrolysis in the context of the heterogeneity of PS is not yet fully understood. The enzyme family carboxylester hydrolases (EC 3.1.1), which includes lipases and esterases, cleave ester bonds like those present in PS components. PSs have been shown to be substrates of both lipases and esterases from various organisms, including the bacteria Pseudomonas cepacia (17), the fungi Thermomyces lanuginosus (18, 19) and Candida antartica (13, 20). The structure and hydrophobicity of the enzyme active pocket determines the specificity for the substrate based on the length of fatty acid chains on the substrate (21). In general, carboxylester hydrolases have been shown to have greater hydrolytic activity against substrates with fatty acid chain lengths C8 to C18 (22, 23). However, enzymes more active against shorter chains have been reported, usually esterases (21, 24). In contrast, some enzymes show wide range of activity with no notable correlation with fatty acid chain length (25). Unfortunately, these studies largely ignored the fact that PSs contain a complex distribution of components, which are most likely hydrolyzed at different rates because of their difference in structure and hydrophobicity.
The PS degradation mechanisms that drive particulate formation in biotherapeutic protein formulations remain poorly understood. Fatty acids present in PS neat material have been suggested as the primary mechanism (14, 26). However, an alternative mechanism has been proposed where hydrolysis of PS by enzyme impurities, such as hydrolases present in purified drug substance, leads to the production of additional free fatty acids that induce particulate formation when the solubility limit is reached (13). As most biopharmaceuticals are sterile dosage forms, one would not expect microbes to be present to secret enzymes. Instead, it is likely that enzyme impurities are introduced through raw materials. Evidence suggests that the most likely raw material source of contamination is the drug substance itself. This statement is supported by a few observations. First, selectivity against PSs in certain antibody formulations has been noted, and comparison between enzyme-mediated and acid/base-mediated PS hydrolysis led to the conclusion that a hydrolase-mediated degradation mechanism was more appropriate to describe the observed PS hydrolysis when compared to a chemical degradation mechanism (13). Second, hydrolases have been identified as a protein-product associated impurity, or residual host cell protein, in monoclonal antibody (mAB) production (27, 28). Throughout bioprocessing, the PS-degrading impurities, due to their very low level, can be carried throughout purification undetected by the most sensitive methodology. In some formulations, enzyme-mediated PS degradation may be negligible if the concentration of the drug substance (and hence, concentration of residual host cell proteins) is low and the concentration of PS is high. In these cases the chemical degradation pathway of PS is dominant. However, in other formulations, when the concentration of drug substance is high and the concentration of PS is low, enzyme-mediated PS degradation may be accelerated to detectable levels if the residual host cell enzymes reach a significant concentration relative to the PS concentration to induce detectable hydrolysis (13). The risk associated with the presence of these enzyme impurities is minimal because their concentration is likely too low to generate a host immune response. The primary risks involved in PS hydrolysis are the generation of fatty acid particles (13, 14) and a reduction in the ability of PS to stabilize drug molecule, which may result in protein aggregation that could induce immune response.
Because enzyme-mediated hydrolysis of PSs is not well understood, we evaluated the susceptibility of major components in heterogeneous PS mixtures to undergo hydrolysis in the presence of hydrolases. Two unique PSs were analyzed: PS20 and PS80, which were heterogeneous mixtures of approximately 99% of laurate (C12) fatty acid esters and 98% oleate (C18:1) fatty acid esters, respectively (Figure 1). These PSs were unique in that they primarily contained fatty acid esters of a single length and degree of unsaturation, rather than a complex distribution. However, they contained mono-, di-, and triesters, as well as esters of both sorbitan and isosorbide head groups. Each major PS component could be assigned to a single peak using a previously described reversed-phase evaporative light scattering detection–high-performance liquid chromatography (ELSD-HPLC) method (29) so that the change in each component could be monitored over time. In the context of PS, the ELSD-HPLC method allows for a quantitative and qualitative analysis of hydrolysis of each component (5, 29, 30). The purpose of this study was to compare the pattern of hydrolysis for each PS component in PS20 and PS80 when incubated with carboxylester hydrolases from a broad range of organisms and to determine if there was a PS component that was completely resistant to enzyme-mediated hydrolysis. Our results illustrate a potential fingerprint approach useful in identifying or verifying enzymes responsible for degradation of PS in drug substances. Furthermore, the results suggest that the pattern of PS degradation (i.e., the degradation profile, or “fingerprint”) is dependent on the enzyme type and that no PS component was completely resistant to the carboxylester hydrolases tested here.
Materials and Methods
Materials
Polysorbate
Polysorbate 20, which contained ∼99% laurate fatty acid esters, was synthesized by BASF SE (Ludwigshafen, Germany). Polysorbate 80, which contained ∼98% oleate fatty acid esters, HX2 Ultra-Purity grade, was synthesized by NOF (Irvine, CA). Herein they are referred to as PS20 and PS80. Although these PSs primarily contained fatty acid esters of a single chain length and degree of unsaturation, they contained mono-, di-, and triesters and contained esters of both sorbitan and isosorbide head groups.
Enzymes
Members of the family of carboxylester hydrolases were chosen because they have been previously shown to act on PS and were identified as impurities in mAB bioprocessing (27, 28). Enzymes used were either immobilized on immobead 150, which are methacrylate polymers with a distribution of particle sizes that range from 0.15 to 0.50 mm (31), or were free (non-immobilized) enzymes. Immobilized enzymes, including Pseudomonas cepacia lipase on immobead 150 (PCL), Candida antarctica lipase B on immobead 150 (CALB), and Thermomyces lanuginosus lipase on immobead 150 (TLL), were purchased from Sigma Aldrich (St. Louis, MO). Free enzymes, including rabbit liver esterase (RLE) and porcine pancreatic lipase type II (PPL), were purchased from Sigma Aldrich. Candida antarctica lipase B (CALB) was provided by Roche Diagnostics (Penzburg, Germany).
Methods
Preparation of Polysorbate Stock
All neat PS bottles were stored in nitrogen purged bottles in a 5 °C cold room protected from light. From these neat material, 5% stock PS solutions were prepared in ultra-pure 18.2 MΩ water and stored in a 5 °C cold room protected from light with aluminum foil and used within 2 weeks.
Polysorbate Hydrolysis with Immobilized Enzymes
The advantage of using immobilized enzymes was that the reaction could be easily stopped by centrifugation at specific time points to separate the enzyme beads and PS. Furthermore, the unit definition was the same for enzymes tested (same substrate, tributyrin, and assay conditions), and therefore the activity could be adjusted for comparison. Time course experiments were performed using immobilized PCL, TLL, and CALB. Reactions were carried out in a sterile falcon tube in a total of 40 mL using 0.625 U/mL enzyme. Reactions were also performed using 1.25 U/mL enzyme, but the hydrolysis was often too fast to follow the reaction (data not shown). Reactions were prepared as follows: first, PS20 or PS80 was diluted from 5% to 0.1% in 20 mM histidine-acetate pH 6.0 in a total reaction volume of 40 mL. This buffer was used because it is a common formulation buffer for mABs. A 300 μL sample of supernatant was collected as the t0 sample (non-hydrolyzed PS). Next, immobilized enzyme powder was added to the reaction tube at a concentration of 0.625 U/mL. The reaction tube was covered in aluminum foil to protect from light and rotated at 50 rpm on a ChemGlass Life Sciences roller mixer TSRT9D at 25 °C. For each reaction time point, the falcon tube was spun at 4000 rpm for 1 min using Allegra X-12R centrifuge. After spinning, the supernatant was visually inspected for the presence of enzyme beads. If any beads were visualized, tubes were left on the bench top until all beads settled at the bottom before sample was collected. A 300 μL sample of supernatant was collected at each time point: 10 min, 30 min, 1 h, 2 h, 3 h, 4 h, 5 h, 6 h and 7 h. These samples were analyzed on the same day using ELSD-HPLC method (29) with the HPLC autosampler kept at 4 °C. CALB samples were passed through a Corning 0.22 μm syringe filter prior to loading into the HPLC because the enzyme beads floated to top of solution even after 4000 rpm spin, while PCL and TLL beads did not float and therefore did not require filtering.
Polysorbate Hydrolysis with Free Enzymes
The advantage of using free enzymes was that many options of enzymes were available. However, experimental time points were limited by the 30 min it took to complete each ELSD-HPLC cycle. Time course experiments were performed with PPL, RLE and CALB. Unlike the immobilized enzymes, the unit definition for the free enzymes differed. Therefore, the amount of enzyme used was one that gave an observable range of hydrolysis that could be followed using the ELSD-HPLC method. These were 3 U/mL for PPL, 2 U/mL for RLE, and 2 U/mL for CALB. Enzyme stocks were prepared at 10 U/mL in 20 mM histidine-acetate pH 6.0 and filtered using a Steriflip-GV 0.22 μm filter. Reactions were prepared as follows: first, PS20 or PS80 was diluted from 5% to 0.04% in 20 mM histidine-acetate pH 6.0 in a total reaction volume of 2 mL and used as the t0 sample (non-degraded PS). In a separate HPLC sample vial, enzyme was diluted from to the U/mL concentration stated above and added to 0.04% PS in 20 mM histidine-acetate pH 6.0 in a total reaction volume of 2 mL. Immediately after preparation the sample was analyzed using a reversed-phase ELSD-HPLC method (29). Samples were analyzed every 30 min from the same vial kept in the 25 °C HPLC autosampler.
Reversed-Phase ELSD-HPLC
HPLC was performed using an Agilent 1200 HPLC system (Palo Alto, CA, USA) equipped with a binary gradient pump, autosampler, a temperature-controlled column compartment, and an evaporative light scattering detector (model 380-LS, Varian, Palo Alto, CA, USA). The ELSD settings were as follows: gas flow rate was 1.0 standard liter per minute, nebulizer temperature set to 45 °C, and evaporation tube temperature 100 °C. The detector was set to 60% intensity when 0.04% PS was used and 15% intensity when 0.1% PS was used. Reversed-phase chromatography analytes were separated using a Zorbax 300SB-C8 column (50 × 4.6 mm, 5 μm, Agilent, Santa Clara, CA, USA). Initial conditions were set at 90% solvent A (2% formic acid in water) and 10% solvent B (2% formic acid in isopropanol). Solvent B was increased to 20% in the first minute and held for 2.4 min. Separation of PS components was achieved using a linear gradient of 20% to 100% B over 19.6 min, followed by an equilibration step. Major PS peaks were identified based on previous reports and comparison with similar experiments in the literature, all from the same company (9, 29, 32). Some smaller peaks were not identified with certainty and were therefore omitted from discussion in this article. ELSD-HPLC chromatogram peaks were integrated using Chromeleon 6.8. Time course graphs shown are presented with each peak shown as a semi-logarithm plot of the percentage of the initial peak area of each time point. The semi-logarithm plots were based on the equation: log10 [% Initial Peak Area = (Areatn / Areat0) * 100], where t0 = 0 mins (initial time) and tn = incubation time points. The y-axis is presented as percentage of the initial PS amount. Graphs were made using GraphPad Prism (GraphPad Software Inc., San Diego, CA). Hydrolysis was quantified using a parameter called t50, which was defined as the time required for each major PS component to reach 50% of the initial value.
Results
Reversed-Phase ELSD-HPLC of PS20 and PS80
A range of carboxylester hydrolases were tested for their ability to hydrolyze major components of PS20 and PS80. Reversed-phase ELSD-HPLC chromatograms of PS20 and PS80 were acquired using a previously established method, and the chromatograms were very similar to previous reports (29, 32). PS20 contained six peaks: monolaurate of POE sorbitan (Ms) and POE isosorbide (Mi), dilaurate of POE sorbitan (Ds) and POE isosorbide (Di), trilaurate of POE sorbitan (Ts), and one unidentified peak (Figure 2A). PS80 contained nine peaks: monooleate of POE sorbitan (Ms) and POE isosorbide (Mi), dioleate of POE sorbitan (Ds) and POE isosorbide (Di), trioleate of POE sorbitan (Ts), and four unidentified peaks (Figure 2B). Because the unidentified peaks made up only a small percentage of the total peak area, they were neglected for this study. Notably, when log(area) was plotted versus log(concentration) using 0.01%, 0.02%, 0.04%, 0.06%, and 0.1% PS standards, a linear fit yielded an r2 value of >0.99 for each PS component (data not shown). Representative chromatograms for the time course experiment for immobilized Pseudomonas cepacia lipase over 7 h show distinct decreases in peak area for the major components of both PS20 (Figure 2A) and PS80 (Figure 2B). We additionally observed a set of peaks, which eluted between 1 to 3 min in our ELSD-HPLC chromatograms, that increased in intensity over time (data not shown). These peaks have been previously identified as non-esterified POE-sorbitan and -isosorbide, PEG, and related species (29). The increase in the area of these peaks over time could not plausibly be used to monitor hydrolysis due to contributions from degradation of all PS components simultaneously. Instead, we monitored the decrease of POE sorbitan (or POE isosorbide) mono-, di-, and triester peaks.

Reversed-phase ELSD-HPLC chromatograms showing hydrolysis of (a) 0.1% PS20 and (b) 0.1% PS80 by immobilized Pseudomonas cepacia lipase.
Hydrolysis of PS by Immobilized Enzymes
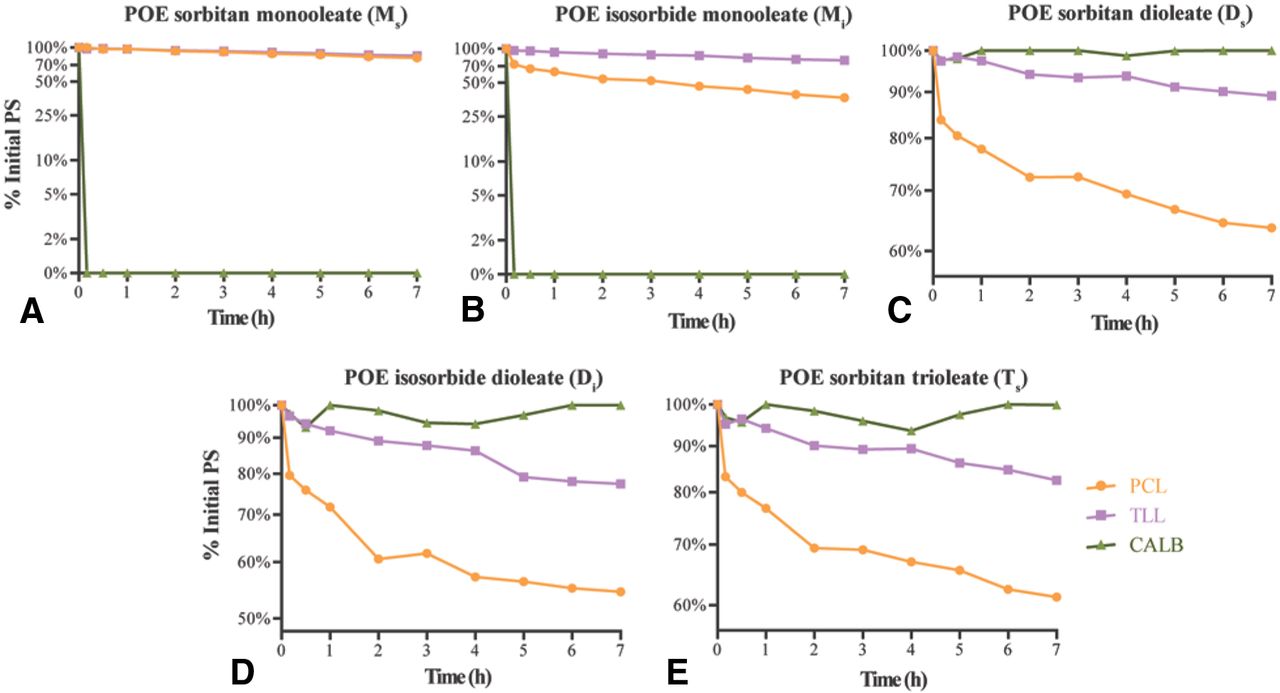
Three immobilized carboxylester hydrolases were analyzed for hydrolytic activity against 0.1% PS20 or PS80 using the reversed-phase ELSD-HPLC method. Lipases tested were PCL from the Gram-negative bacterium Pseudomonas cepacia, TLL from the fungus Thermomyces lanuginosus, and CALB from the fungus Candida antarctica. The percent of each major PS component remaining after incubation with 0.625 U/mL immobilized enzymes for 7 h is reported in Table I, and the hydrolysis over time is visualized for PS20 in Figure 3 and PS80 in Figure 4. The pattern of hydrolysis for major PS components was similar between PCL and TLL for both PS20 (Figure 3) and PS80 (Figure 4). In contrast, CALB showed a different pattern of PS hydrolysis when compared to PCL and TLL for both PS20 (Figure 3) and PS80 (Figure 4). Because the percent PS degradation where the ELSD detector response becomes non-linear or indistinguishable from experimental noise is unknown, hydrolysis was quantified using a parameter called t50, which we defined as the time required for each PS component peak in the HPLC chromatogram to reach 50% of its initial value. The t50 value fits within the linear range of the ELSD detector for each PS component to reach 50% of the initial area as determined using a standard curve for PS (data not shown). Hydrolysis of a PS component that occurred more readily should have a lower t50 value when compared to a slow hydrolyzing component. The t50 value for each major PS20 and PS80 component when incubated with immobilized PCL, TLL, or CALB is reported in Table II. Comparison showed that PCL had a lower t50 value for POE isosorbide esters when compared to POE sorbitan esters, except for dioleate esters, whose degradation did not reach 50% degradation (Table II). TLL, like PCL, had a lower t50 value for POE isosorbide esters components when compared to POE sorbitan esters of PS20 (Table II). However, a difference in t50 value for PS80 components was not readily observed because 50% was not achieved within the experimental time frame (Table II). In addition, both PCL and TLL had a lower t50 value for laurate esters of PS20 when compared to oleate esters of PS80, except for POE sorbitan monoesters (Table II). In contrast, comparison between POE sorbitan and POE isosorbide esters was not possible for CALB due to the rate of hydrolysis (Table II). However, CALB had a lower t50 value for POE sorbitan monoesters when compared to POE sorbitan triesters (Table II). Furthermore, CALB had a lower t50 value for POE sorbitan dilaurate and POE isosorbide dilaurate esters when compared to POE sorbitan dioleate and POE isosorbide dioleate eters (Table II). Together, these data show that the PCL-mediated and TLL-mediated degradation profiles of PS20 and PS80 are similar and different from the CALB-mediated PS degradation profile.
Percent of 0.1% PS20 and PS80 Remaining after 7 h of Incubation with 0.625 U/mL Immobilized Enzymes. Percent of the Initial Area Remaining for Each PS Component after Hydrolysis Is Shown.

Comparison of hydrolysis of 0.1% PS20 over time by 0.625 U/mL immobilized enzymes.

Comparison of hydrolysis of 0.1% PS80 over time by 0.625 U/mL immobilized enzymes.
Sensitivity of 0.1% PS20 and PS80 to 0.625 U/mL Immobilized Enzymes. The t50 Value (in Hours) Is Shown for Each Major PS Component.
Hydrolysis of PS by Free Enzymes
Three free carboxylester hydrolases were analyzed for hydrolytic activity against 0.04% PS20 or PS80 using the reversed-phase ELSD-HPLC method. Lipases tested were PPL from porcine pancreas and free CALB for comparison with immobilized CALB. In addition, an esterase, RLE, from rabbit liver was tested. The percent of each major PS component remaining after incubation with 3 U/mL PPL, 2 U/mL RLE, or 2 U/mL CALB for 5 h is reported in Table III, and the hydrolysis over time is visualized for PS20 in Figure 5 and PS80 in Figure 6. The overall pattern of hydrolysis for major PS components was similar between PPL, RLE, and CALB for both PS20 (Figure 5) and PS80 (Figure 6). As before, enzyme-mediated PS hydrolysis was quantified using the t50 parameter. The t50 value for each major PS20 and PS80 component when incubated with free PPL, RLE, or CALB is reported in Table IV. PPL had a lower t50 value for POE sorbitan monoesters when compared to POE sorbitan di- and triesters and a lower t50 value for POE isosorbide monoesters when compared to POE isosorbide diesters (Table IV). RLE had a lower t50 value for POE sorbitan mono- and diesters when compared with POE sorbitan triesters (Table IV). CALB had a lower t50 value for POE sorbitan dilaurate and POE isosorbide dilaurate when compared to POE sorbitan dioleate and POE isosorbide dioleate (Table IV). PPL, RLE, and CALB each had a lower t50 value for POE sorbitan monoesters when compared to POE sorbitan triesters (Table IV), though the difference is not as exaggerated for CALB with PS20. Notably, we observed a lag phase using two free mammalian enzymes, PPL and RLE (Figure 6). The lag phase phenomenon has been previously reported for hydrolases (33). The lag phase we observed could be due to the slow adsorption of enzyme to the substrate interface (i.e., micelles) (33, 34). Together, these data show that the PPL-, RLE-, and CALB-mediated degradation profiles of PS20 and PS80 are similar in their preference for POE sorbitan/isosorbide monoesters when compared to POE sorbitan triesters. Importantly, the CALB-mediated degradation profiles of PS20 and PS80 were very similar between immobilized CALB (Table II) and free CALB (Table IV).
Percent 0.04% PS20 and PS80 Remaining after 5 h of Incubation with Free Enzymes Using 3 U/mL PPL, 2 U/mL RLE, or 2 U/mL CALB. Percent of the Initial Area Remaining for Each PS Component after Hydrolysis Is Shown.

Comparison of hydrolysis of 0.04% PS20 over time by free enzymes.

Comparison of hydrolysis of 0.04% PS80 over time by free enzymes.
Sensitivity of 0.04% PS20 and PS80 to 3 U/mL PPL, 2 U/mL RLE, or 2 U/mL CALB. The t50 Value (in Hours) Is Shown for Each Major PS Component.
Discussion
In this study, the ability of carboxylester hydrolases to hydrolyze major components of PS20 and PS80 was evaluated. Following data collection, an attempt was made to determine the hydrolytic rates and kinetic parameters for each PS component using a mathematical model. Unfortunately, experimental data could not fit any model accurately. Classical enzyme kinetics, such as the Michaelis–Menten kinetics, cannot accurately describe our system because it contains multiple substrates that are all hydrolyzed simultaneously, most of which are hydrolyzed to other substrates. Therefore, the individual rates of mono- and diester PS components cannot be determined via these methods within our experimental setup. While the rate of hydrolysis of triesters, being the highest order of PS ester observed, was assumed to be independent of other components, the rate of hydrolysis for mono- and diesters was dependent on the rate of hydrolysis for components one level higher than itself. Therefore, our interpretation of the hydrolysis here is currently limited in that we could not deconvolute the “true rate” of each component. A more quantitative kinetic evaluation of PS hydrolysis rates would require each component to be analyzed independently. However, pure standards of PS components are currently unavailable. Instead, for a comparison of hydrolysis, we utilized the t50 parameter, which was defined as the time required for each PS component to reach 50% degradation.
Experiments were performed using either 0.04% or 0.1% PS, rather than a wide range of PS concentrations. These PS concentrations were chosen because they represent the PS concentrations commonly utilized in drug formulations (30). The pattern of PS hydrolysis observed via the ELSD-HPLC method is analogous to what we term the PS degradation profile or the fingerprint. One might argue that the fingerprint of enzyme-mediated PS degradation could depend on the PS concentration due to differences in the number of PS components residing as a micellular composition or on the distance from the Km of each substrate. The CMC of PS20 and PS80 in aqueous solutions have been previously measured as 0.007% (w/v) and 0.0017 % (w/v), respectively (35, 36). Therefore, the concentrations of PS used in our experiments are well above the currently known PS CMC values. Importantly, we note that the PS degradation profile was similar in the presence of immobilized CALB (Table II) or free CALB (Table IV) even though different PS concentrations were utilized.
Immobilized PCL, TLL, and CALB were adjusted to the same units/mL (0.625 U/mL) so their hydrolytic activity for PS could be compared. Results show that immobilized CALB had lower t50 values, which corresponds to higher hydrolytic activity, for POE sorbitan and isosorbide monoesters when compared to immobilized PCL and TLL for both PS20 and PS80 esters (Table II). In contrast, immobilized CALB had a higher t50 value for POE sorbitan trilaurate of PS20 when compared to immobilized PCL and TLL (Table II). The t50 value of immobilized PCL and TLL was similar for some components, such as POE sorbitan mono- and diesters of PS20 and PS80, but varied for other components, such as POE isosorbide mono- and dilaurate (Table II). However, the overall degradation pattern was similar between PCL and TLL (Table II). Based on this analysis, a comparison between hydrolytic rates of POE sorbitan monoester and POE sorbitan triester is a good indicator for the pattern of PS hydrolysis. Unfortunately, the hydrolytic rates between free enzymes could not be compared with the current experimental design.
Our hypothesis was that each PS component would be hydrolyzed with various efficiencies due to their differences in structure and hydrophobicity. Indeed, our results suggest that the degree of hydrolysis is influenced by the identity of the PS head group. For example, using immobilized PCL and TLL, the POE isosorbide mono- and diesters had a lower t50 value when compared to POE sorbitan mono- and diesters for PS20 (Table II). With immobilized CALB, the hydrolytic reaction against POE sorbitan and isosorbide monoesters proceeded too fast to monitor with the current experimental setup and therefore could not be compared (Table II). With the free enzymes, PPL, RLE, and CALB, there did not seem to be a clear trend in the difference between the hydrolytic rates of POE sorbitan esters when compared to POE isosorbide esters (Table IV). Because we assumed there is no interconversion between sorbitan and isosorbide, we believe this comparison between sorbitan and isosorbide components is plausible. Interestingly, a previous report suggested that POE isosorbide esters were hydrolyzed faster than POE sorbitan esters of PS20 in a formulation containing a mAB (32), which is similar to the pattern of hydrolysis observed by PCL and TLL in our experiments.
In some cases, there was a trend in which the rate of hydrolysis for PS20 was faster than that of PS80 with similar head group and degree of ester. For example, with immobilized PCL and TLL, laurate esters had a lower t50 value compared to oleate esters, except for POE sorbitan monoester (Table II). Similarly, for free CALB, laurate esters had a lower t50 value when compared to oleate esters, except for POE sorbitan monoester and POE isosorbide monoester (Table IV). In other cases, such as free RLE, there was not a clear trend when comparing hydrolysis of laurate and oleate esters (Table IV).
The rate of hydrolysis for mono-, di-, and triesters often differed from each other. For example, in experiments utilizing immobilized PCL and TLL, POE sorbitan monolaurate had a higher t50 value than POE sorbitan di- or trilaurate (Table II). The opposite trend was observed for immobilized CALB, where POE sorbitan monolaurate had a lower t50 value than POE sorbitan trilaurate and POE sorbitan monooleate had a lower t50 value than POE sorbitan dioleate and POE sorbitan trioleate (Table II). In another example with free RLE, POE sorbitan monolaurate and POE sorbitan monooleate had a lower t50 value than POE sorbitan trilaurate and POE sorbitan trioleate, respectively (Table IV). Because the digestion of di- and triester feeds into the population of monoesters, we believe that these conclusions concerning (in some cases) a faster hydrolytic rate for POE sorbitan or POE isosorbide monoesters when compared to high-order ester types is plausible. In other cases, such as the slower hydrolytic rate of POE sorbitan monoester when compared to POE sorbitan dilaurate and POE sorbitan trilaurate with immobilized PCL (Table I), it is possible that the hydrolysis of monoesters is only perceived as slower because the hydrolysis of di- and triester esters feeds into the population of monoesters.
Finally, the results obtained here can be compared with those previously reported in the literature. In this study PCL was shown to be more active against PS20 than PS80 components, with the exception of POE sorbitan monoester (Table II). This observation is similar to a previous report of higher activity against bulk PS20 using Pseudomonas strains that were clinically isolated (17). Similarly, TLL was shown to be more active against PS20 than PS80 components, with the exception of POE sorbitan monoesters (Table II), which is in conflict with a previous observation that the activities against bulk PS were very similar in isolated Thermomyces strains (18). The results reported here are in agreement that CALB is active against PS80, especially POE sorbitan monooleate (13). Finally, RLE and PPL were shown to be active against PS80, in agreement with previous reports (37).
Our results additionally illustrate a potential fingerprint approach useful in identifying or verifying enzymes responsible for degrading PS, whether they are from residual host cell impurities carried over after bioprocessing or from contamination prior to or during handling. This approach is not unlike the identification of unique polymorph fingerprints observed by X-ray diffraction (38) or infrared spectroscopy (39). On numerous occasions in the literature PS has been shown to be degraded in mAB formulations and although the responsible enzyme(s) has yet to be definitively identified, carboxylester hydrolases are a possible candidate (13, 27–28). Our results imply that the enzyme-mediated degradation profile of PS can be used to confirm the presence of a contaminating enzyme, which would likely be introduced during expression and carried through the purification process. Future studies examining a broader range of enzymes to hydrolyze PS and further comparison with “real-time” monitoring of PS hydrolysis in drug substances could strengthen the case for the ELSD-HPLC method as a fingerprint approach to distinguish enzyme-mediated PS hydrolysis in drug formulations.
In summary, our results provide the novel observation that major PS components are uniquely hydrolyzed by different carboxylester hydrolases in a specific pattern, resulting in enzyme-specific PS degradation profiles. Future structural and biochemical studies are needed to elucidate why some enzymes have higher hydrolytic activity against certain PS components, though the reaction is likely governed by the availability for different enzyme active sites to accommodate bulky hydrophobic POE or ester moieties (5, 37, 40). Previous work had shown that acid/base hydrolysis was specific to monoesters, while di- and triesters were primarily degraded by oxidation (8). Data analysis and interpretation is complex because of the heterogeneity of PS and the fact that hydrolysis of some PS components feeds into the population of other components. However, it is clear that none of the PS components in either PS20 or PS80 were completely resistant to hydrolysis by all of the enzymes tested (Tables I and III). Although the data do suggest a possible advantage of PS80 versus PS20 in terms of the reduced rate of enzyme-mediated hydrolysis for some PS components, such as di- and trioleate esters (Table I and III), PS80 has been shown to be more prone to oxidation than PS20 (8). Taken together, these data suggest that additional caution should be taken during the selection process of PS as a surfactant/stabilizer in biotherapeutic protein formulations. Use of another surfactant that does not contain hydrolase-sensitive ester bonds may be a suitable solution in some cases. Alternatively, future improvements in drug substance purification schemes, refined bioprocessing methods, and incorporation of sensitive methods to detect and identify residual host cell impurities would help circumvent PS hydrolysis due to residual host cell protein activity.
Conflict of Interest Declaration
The authors declare that they have no competing interests related to this article.
Acknowledgements
The authors would like to thank Drs. Frank Wedekind (Roche Diagnostics), Sandeep Yadav, and Barthelemy Demeule for valuable discussion, and Dr. Jamie Moore for support. We would like to thank the National Institute of General Medical Sciences, National Institutes of Health for the financial support to trainees (A. C. M. and D. C. K.) of the Biotechnology Training Program (T32-GM008359) at the University of Kansas.
- © PDA, Inc. 2016
References


Jump to section
Related Articles
Cited By...
- Physicochemical Excipient-Container Interactions in Prefilled Syringes and Their Impact on Syringe Functionality
- Profiling Active Enzymes for Polysorbate Degradation in Biotherapeutics by Activity-Based Protein Profiling
- Functional Redundancy in Local Spatial Scale Microbial Communities Suggest Stochastic Processes at an Urban Wilderness Preserve in Austin, TX, USA