
Abstract
Quality culture as an enabler of high-quality performance and subsequently as a source of competitive advantage is increasingly discussed among operational excellence (OPEX) and quality executives. Research studies indicate an impact of quality culture on performance, especially on the success of quality improvement programs, such as Total Quality Management initiatives. A continual challenge in quality culture research, however, remains the lack of practical and accepted metrics to assess culture. In 2014, the Parental Drug Association (PDA) conducted a quality culture survey within the pharmaceutical industry. The results indicate a positive and significant correlation between quality (culture) behavior of a production site's employees and quality (system) maturity, which represents the maturity of the quality system in place. As the maturity of the quality system is more comfortable to assess by objective criteria, the positive correlation between quality (culture) behavior and quality (system) maturity may be exploited by using the latter as an indicator for quality culture. This paper confirms this positive relationship by exploring the comprehensive St. Gallen OPEX database for pharmaceutical production plants. Furthermore, data analysis shows that high-performing production sites, regarding timely provision of high-quality drugs, reveal a higher level of both quality (system) maturity and quality (culture) behavior than low-performing sites.
Introduction
In their 2017 article, “The Future of Pharmaceutical Quality and the Path to Get There,” Yu and Kopcha (1) show that the pharmaceutical industry still has a long way to go to improve quality. A comparison with other sectors confirms that the pharmaceutical industry is lagging in quality despite significant improvements in process and product understanding. While the electronic and automobile industry achieves a level of Six-Sigma (equals no more than 3.4 defects per one million parts), the pharmaceutical industry is still operating at a level of two- to three-sigma. Six-sigma, however, is rarely achieved (1).
Following Janet Woodcock, Director of the US Food and Drug Administration (FDA) Center for Drug Evaluation and Research (CDER), the FDA envisions “a maximally efficient, agile, flexible manufacturing sector that reliably produces high-quality drug products without extensive regulatory oversight” (2). Considering the current state of quality in the pharmaceutical industry, however, the industry needs continuous efforts to improve the overall quality of its products and processes.
Besides advanced manufacturing technologies and tools, such as Pharmaceutical Quality by Design (1), quality culture is discussed as a major enabler of sustainably improved quality performance. According to Srinivasan and Kurey (3), quality culture is critical to an organization and strongly influences the overall quality of the product.
This paper aims to contribute to the ongoing discussion on the importance of quality culture in the pharmaceutical industry by exploring the database based on the St. Gallen operational excellence (OPEX) benchmarking (4). The database consists of more than 330 data sets from pharmaceutical production facilities worldwide (5). The quantitative analysis has two primary objectives, namely, to evaluate prior findings on quality maturity and quality behavior described by Patel et al. (6) and to test whether production facilities with a comparably high operational performance also show a significantly higher level of quality culture.
Current Status
The concept of a strong corporate culture that enables superior performance has been discussed widely and is supported by many scholars. Hackman and Wageman (7) found that Total Quality Management (TQM) programs require a respective culture and not just the implementation of technical management practices. This finding is supported by the research of Baird et al. (8), Alotaibi (9), and Naor et al. (10) that discuss the role of culture as a driver of quality management and performance. Mohammad Mosadegh Rad (11) shows that the link between organizational culture and success of TQM initiatives is also present in nonmanufacturing surroundings like hospitals. Scott et al. (12) reviewed 10 studies from the health-care industry and found that 4 studies claimed to have uncovered supportive evidence of the link between culture and performance. The remaining 6 studies failed to show a significant connection. However, none provided evidence against it. Bortolotti et al. (13) examined the role of organizational culture for the success of lean implementation. The findings correspond to the conclusions presented on the role of culture as an enabler for successful TQM implementation. Independent of the industry, scholars found evidence that an appropriate culture fosters creativity and strategic flexibility of companies (14) and has a positive impact on firm performance. Wu (15) emphasizes in particular the role of quality culture and argues that quality culture serves as an antecedent to quality performance. Also, Wu et al. (16) show that managers need to consider the currently prevailing quality culture when selecting and implementing quality practices.
Following Srinivasan and Kurey (3), a culture of quality can be described “as an environment in which employees not only follow quality guidelines but also consistently see others taking quality-focused actions, hear others talking about quality, and feel quality all around them.”
However, although a significant number of papers discussing how to create and embed quality culture has been published, few contributions address the question of how to operationalize and measure quality culture. To overcome this challenge, Patel et al. (6) formulated the proposition that a firm quality culture correlates with specific behaviors (quality culture behavior). Furthermore, the researchers assumed that these behaviors are driven by quality system maturity attributes. Following Patel et al. (6), quality (culture) behavior can be defined as follows:
Behaviors observed at the site or organization that are associated with a strong quality culture in areas such as clear communication and transparency, commitment and engagement, technical excellence, and standardization of requirements.
Quality (system) maturity is defined as follows:
Objective characteristics of a quality system that can be observed or verified upon inspection or internal audit and that have a positive relationship with quality culture behaviors, including formal programs in preventive maintenance, environmental health and safety, risk management, human error prevention, and training or continuous improvement.
Supporting the assumption that quality behavior is driven by quality system maturity with empirical evidence would facilitate the measurement of quality culture, as quality system maturity attributes can be quantified and observed more efficiently, for example, during an audit, than quality behaviors. Therefore, the first hypothesis is as follows:
Hypothesis 1: Quality maturity and quality behavior are positively correlated.
Hypothesis 1 has been tested and is supported by the findings of the PDA Quality Culture Report. Based on data gathered in mid-2014 with the Quality Culture Survey, Patel et al. (6) have calculated an aggregate behavior score and an aggregate maturity score.
The aggregate behavior score reflects the degree to which survey participants observe specific quality behaviors in their organization. A higher score indicates more frequently observed behaviors supporting a positive quality culture at the site or organization. The aggregate maturity score reflects the degree to which an organization has implemented specific formal programs within its quality system. A higher score indicates more formal programs with a higher level of implementation in place. Using a scatter plot analysis, the research team found a significantly positive correlation between the aggregated maturity score and the aggregated behavior score (see Results). This finding supports the hypothesis 1 that quality maturity and quality behavior are positively correlated.
This paper builds on these initial results and aims to reevaluate the findings based on data from the comprehensive St. Gallen OPEX database (cf. Figure 1). The second objective of the paper is to investigate the question of whether the quality culture prevailing at a pharmaceutical production facility affects the site's performance. Reviewed literature suggests a positive relationship between the level of quality culture and performance, although not all studies have observed a significant effect. We assume that production sites that perform exceptionally well, the so-called high performers (HPs), also show a higher level of quality culture. Therefore, the second hypothesis we would like to examine is as follows:
Hypothesis 2: High-performing production facilities have a significantly higher level of quality culture.
The database and the approach for testing both hypotheses are introduced in the next section.
Database and Approach
Database
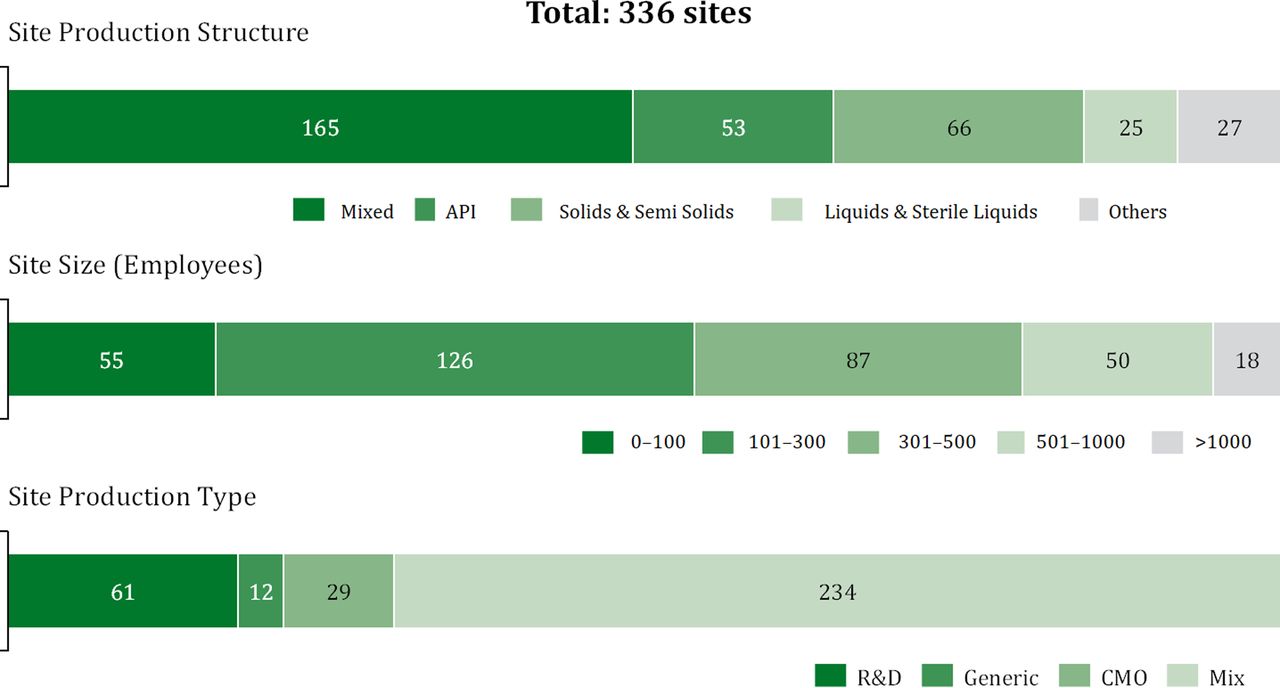
Since 2004, the Institute of Technology Management at the University of St. Gallen has been assisting several pharmaceutical companies in improving their performance with its benchmarking study on OPEX. Today, the benchmarking database consists of 336 manufacturing sites from over 124 different companies and thus represents the largest nonconsulting driven OPEX benchmarking database in the pharmaceutical industry worldwide.
As shown in Figure 1, the database contains data sets from different technologies and small-, medium-, and large-sized production facilities.

Structure of St. Gallen OPEX benchmarking database.
The OPEX benchmarking follows a comprehensive approach and addresses the following four aspects of operational performance of a pharmaceutical production unit:
Performance metrics: Industry-wide applied metrics, such as scrap rate, service-level delivery, and lead times, are used to assess the effectiveness of the production facility.
Structural factors: Structural factors provide background information on the site, such as size and headcount full-time equivalents (FTEs), technology, and product program, and are used to build comparable peer groups.
Cost and headcount: Cost and headcount figures are used to assess the resource consumption needed to achieve the level of operational effectiveness.
Enablers: Enablers are defined as methods and tools leading to better performance. The level of enabler implementation is an indicator for a production facility's efforts to implement and develop OPEX. In contrast to all other metrics, enabler implementation is measured using a five-point Likert scale self-assessment (17).
Approach
Measuring Quality Culture:
As quality culture addresses various aspects of attitude and behavior of individual employees, as well as characteristics of how the organization is organized, we integrate several indicators to determine the level of quality culture of a production site. The quality culture score is determined by three categories.
The first category consists of the so-called engagement metrics. These metrics are measurable key performance indicators (KPIs) that are part of the performance assessment of the OPEX benchmarking. The first two metrics are quantity of improvement suggestions per employee and quality of improvement suggestions. They serve as an indicator of employee motivation and commitment to contribute to the continuous improvement of the production site's performance. Training and level of qualification serve as indicators for an employee's skills and the organization's willingness to invest in their knowledge base. Finally, sick leave, level of safety, and employee turnover rate serve as indicators for whether the management can provide a safe and healthy work environment, which we consider a prerequisite for high-quality work. Table I exhibits the engagement metrics along with a short definition.
Engagement Metrics of the PPSM
For every production facility in the database, an engagement metrics score was calculated as the average of the relative performance of the metrics. Relative performance is the performance relative to all other facilities in the sample, normalized to 100%. The production site with the highest number of suggestions receives a sub-score for this metric of 100%, and the site with the lowest number 0%. For employee turnover, we consider a low-to-moderate level of turnover rate as favorable compared with a high level of turnover rate. Hence, sites with a high turnover rate get a lower score for these metrics. In short, the higher the engagement metrics score, the higher is the employees' involvement, motivation, and strife for continuous improvement.
The second and third categories of the quality culture score are quality behavior and quality maturity, respectively. To operationalize both factors, the research team has adopted the definition of Patel et al. (6) as stated above and assigned, if applicable, an enabler of the St. Gallen OPEX benchmarking to either quality behavior or quality maturity.
For instance, the enabler item “We have implemented tools and methods to deploy a continuous improvement process” describes the maturity of the quality system and is therefore assigned to the quality system maturity category. The enabler item “Shop-floor employees actively drive suggestion programs (not excl. linked to a suggestion system in place)” in contrast, addresses the behavior and attitude of employees regarding their engagement to increase quality by contributing improvement suggestions. Therefore, this enabler item is assigned to the category quality culture behavior. From a total of 114 enablers in the categories of Total Productive Maintenance (TPM), TQM, Just-in-Time (JIT), Effective Management System (EMS), and basic elements, 26 enablers have been assigned to quality behavior and 36 to quality maturity (5). Table II shows the allocation of the OPEX enablers to the two sub-categories, namely, quality behavior and quality maturity. A more detailed overview of the assignment of the individual enabler items to the two groups is available in the Appendix.
Assignment of Enabler to the Sub-categories of Quality Behavior and Quality Maturity
Similar to the engagement metrics score, quality behavior and quality maturity scores were calculated as the average of all enablers in those sub-categories. A high-quality behavior score indicates that behavior that supports quality can be observed frequently. A high-quality maturity score suggests a mature quality system with a high level of implementation of formal programs in areas such as preventive maintenance, environmental health and safety, risk management, human error prevention, and training or continuous improvement. All three scores combined form the overall quality culture score, which will be used to test Hypothesis 2 (see Table III).
Cultural Excellence Score
Defining High-Performing Production Sites:
While often financial figures are used to determine performance, our focus is on the operational rather than the financial performance of the production facilities. Therefore, we used the KPI service-level delivery (on time and in-full [OTIF]) as an indicator of the overall operational performance of a plant. According to the benchmarking definition, the metric service-level delivery (OTIF) measures the timely provision of the right drug in the right amount and the right quality. [Service-level delivery (OTIF) is perfect order fulfillment (percentage of orders shipped in time from your site ±1 day of the agreed shipment day) in the right quantity (±3% of the agreed quantity) and right quality to your customer.] Hence, it is a good indicator of a production site's ability to provide medicines needed in the right amount and the right quality. We argue that this is the core responsibility of a pharmaceutical production site and consider therefore the metric service-level delivery (OTIF) as an excellent indicator to distinguish high-and low-performing production sites.
Based on this metric, the following two groups have been defined for the subsequent analysis:
Group 1: HP sites: This group comprises all sites belonging to the top 10% of all sites regarding their performance for the KPI service-level delivery (OTIF).
Group 2: Low-performer (LP) sites: This group comprises all sites belonging to the bottom 10% of all sites regarding their performance for the KPI service-level delivery (OTIF).
Results
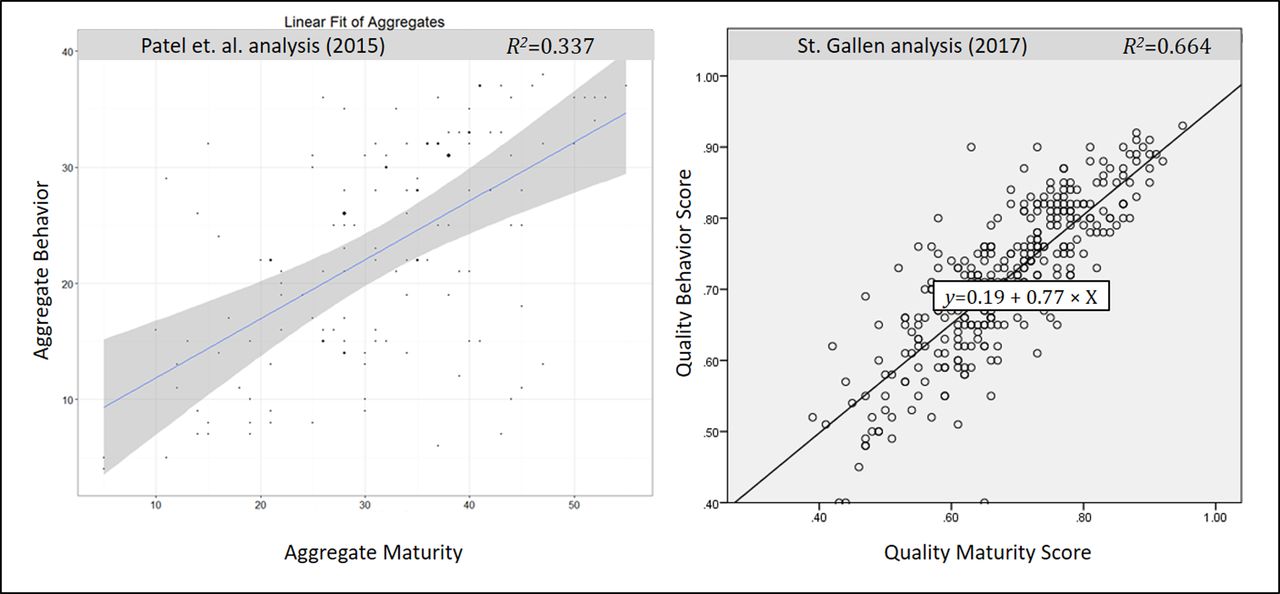
To test Hypothesis 1 (quality maturity and quality behavior are positively correlated), the research team performed a scatter plot analysis with a linear regression line. The results are shown in Figure 2.

Correlation of quality maturity and quality behavior—PDA results (left) and St. Gallen results (right).
The graph on the left side of Figure 2 shows the result of the PDA Quality Culture Survey Report (6). It indicates a positive correlation between quality maturity and quality behavior with a degree of determination of 33.7% (R2 = 0.337). (An R2 of 0.0337 indicates that 33.7% of the variation of quality behavior can be explained by the variation of quality maturity.) According to Cohen (18), an R2 of 0.25 represents a large effect size for a behavioral study of this nature. Patel et al. (6) concluded that the relationship between quality maturity and quality behavior is both statistically significant and of practical importance.
The St. Gallen analysis confirms this result with an independent set of data. The graph on the right side of Figure 2 shows a strong positive correlation between the scores. The degree of determination is 66.4% (R2 = 0.664). Therefore, Hypothesis 1 can be supported by both results.
Hypothesis 2 aims to show a positive relationship between the level of quality culture and the site's performance. To test Hypothesis 2 (high-performing production facilities have a significantly higher level of quality culture), the research team performed four t-tests for equality of means.
As shown in Table IV, according to analysis 1, sites belonging to the HP peer group have a significantly higher mean value (0.657) of the overall quality culture score than sites assigned to the LP peer group (0.058). The corresponding p-value of the test is 0.006 and therefore statistically significant to the 0.05 level. This finding supports Hypothesis 2.
t-Test for Equality of Means Results
Furthermore, Table IV shows the results of the t-test for all categories that define the quality culture score. Analysis 2 reveals the same pattern as analysis 1. HP sites have a significantly (p = 0.007) higher average engagement metrics score (0.549) compared with LP sites (0.438). Following the expectation, the same observation applies to the quality behavior score (p = 0.036) and the quality system maturity score (p = 0.039).
Discussion and Outlook
The findings of Patel et al. (6) based on the PDA Quality Culture Survey in 2014 show a positive correlation between quality culture behavior and quality system maturity. While the analysis can only show a positive correlation and no direction of the relationship, Patel's research team assumed that quality culture behavior is driven by the maturity of the quality system rather than the reverse. The St. Gallen OPEX research team used the comprehensive benchmarking database to challenge the early findings on the relation of quality culture behavior and quality system maturity. Based on the enabler section of the benchmarking, the team calculated scores for both categories. A scatter plot and linear regression confirmed the initial results, even with a higher level of determination. Therefore, the hypothesis of a positive relationship between quality culture behavior and quality system maturity is supported.
The results of the second analysis support the assumption that high-performing production facilities are also those sites that have on average a higher level of quality culture implementation. This result contributes to the discussion of the impact of quality culture on performance by showing that well performing companies emphasize and develop a strong quality culture.
There are two main limitations of this paper. First, the assignment of the St. Gallen OPEX enabler to the two categories defined by Patel et al. (6) does not provide a 100% match to the questions of the PDA Quality Culture Survey. Therefore, the quality culture behavior score and the quality system maturity score must be considered as an approximation rather than a one-to-one reproduction of the scores used for the initial analysis. Second, the database is biased in favor of production sites in the U.S. and Europe. Therefore, the validity of the findings is limited to other areas.
This paper documents a significantly positive relationship between the maturity of the quality system and quality behavior of employees. Further research in this field may address the question of whether specific elements of a quality system that have a strong relevance for employees' quality behavior can be identified.
By providing a better understanding of the drivers of desired quality behavior, plant leaders will be supported in their decision of how to allocate budgets to increase the maturity of their quality system, which is assumed to have an indirect impact on the prevailing quality culture. Another interesting aspect for further research is to evaluate the effect of quality culture on a performance score that integrates both effectiveness metrics and efficiency metrics, such as costs and headcount shares. Showing that a high-quality culture not only fosters the sites' effectiveness but also contributes to higher profitability will further increase the industry's appetite to invest in and develop a high level of quality culture.
Conflict of Interest Declaration
The authors declare that they have no competing interests.
Appendix:
Stg Enabler Fit To Quality Culture Behavior (QB) and Quality System Maturity (QM)
- © PDA, Inc. 2018


