
Abstract
Sufficient rubber stopper sealing performance throughout the entire sealed product life cycle is essential for maintaining container closure integrity in the parenteral packaging industry. However, prior publications have lacked systematic considerations for the time-dependent influence on sealing performance that results from the viscoelastic characteristics of the rubber stoppers. In this paper, we report results of an effort to study these effects by applying both compression stress relaxation testing and residual seal force testing for time-dependent experimental data collection. These experiments were followed by modeling fit calculations based on the Maxwell-Wiechert theory modified with the Kohlrausch-Williams-Watts stretched exponential function, resulting in a nonlinear, time-dependent sealing force model. By employing both testing evaluations and modeling calculations, an in-depth understanding of the time-dependent effects on rubber stopper sealing force was developed. Both testing and modeling data show good consistency, demonstrating that the sealing force decays exponentially over time and eventually levels off because of the viscoelastic nature of the rubber stoppers. The nonlinearity of stress relaxation derives from the viscoelastic characteristics of the rubber stoppers coupled with the large stopper compression deformation into restrained geometry conditions. The modeling fit with capability to handle actual testing data can be employed as a tool to calculate the compression stress relaxation and residual seal force throughout the entire sealed product life cycle. In addition to being time-dependent, stress relaxation is also experimentally shown to be temperature-dependent. The present work provides a new, integrated methodology framework and some fresh insights to the parenteral packaging industry for practically and proactively considering, designing, setting up, controlling, and managing stopper sealing performance throughout the entire sealed product life cycle.
LAY ABSTRACT: Historical publications in the parenteral packaging industry have lacked systematic considerations for the time-dependent influence on the sealing performance that results from effects of viscoelastic characteristic of the rubber stoppers. This study applied compression stress relaxation testing and residual seal force testing for time-dependent experimental data collection. These experiments were followed by modeling fit calculations based on the Maxwell-Wiechert theory modified with the Kohlrausch-Williams-Watts stretched exponential function, resulting in a nonlinear, time-dependent sealing force model. Experimental and modeling data show good consistency, demonstrating that sealing force decays exponentially over time and eventually levels off. The nonlinearity of stress relaxation derives from the viscoelastic characteristics of the rubber stoppers coupled with the large stopper compression deformation into restrained geometry conditions. In addition to being time-dependent stress relaxation, it is also experimentally shown to be temperature-dependent. The present work provides a new, integrated methodology framework and some fresh insights to the industry for practically and proactively considering, designing, setting up, controlling, and managing of the stopper sealing performance throughout the entire sealed product life cycle.
- Compression stress relaxation (CSR)
- Residual seal force (RSF)
- Container closure system (CCS)
- Container closure integrity (CCI)
- Stopper
- Vial
- Cap
- Seal
- Capping
- Time-dependent
- Temperature-dependent
- Maxwell-Wiechert model
- Kohlrausch-Williams-Watts (KWW) stretched exponential function
Introduction
A popular container closure system (CCS) configuration for parenteral drug products is composed of three major packaging components: a glass vial, a rubber stopper, and an aluminum seal (1). The aluminum seal may or may not have a flip-off cap, depending on targeted applications. The dimensions and tolerances of each component can be different from one manufacturer to another. Physical and mechanical properties of the rubber stoppers can also vary due to different formulations, different manufacturing processes, and different manufacturers.
Among the three components of the CCS, the rubber stopper plays a vital role in sealing performance by conforming its rubber flange to the glass interface of the vial sealing area as it is held under compression by the aluminum seal. As a result, the capping process, which imparts the necessary compression, is a critical step to deform the rubber stoppers and complete assembly of the CCS. The parenteral packaging set-up includes the CCS components (vial, rubber stopper, and aluminum seal) and the capping process. The rubber stopper, vial, and aluminum seal, together with the capping process, need to be properly selected and controlled to ensure container closure integrity (CCI).
There are many testing methods (2,3,4,5) currently used to assess CCI. Some are probabilistic leak test methods, while other are deterministic leak test methods. USP Chapter <1207> (2) provides a list of CCI testing methods with guidance and explanation. The latest publication by DeGrazio (6) provides an overview of some holistic considerations to ensure CCI performance. However, while these CCI testing methods do evaluate CCI performance, it is well known to the industry that residual seal force (RSF) testing (7,8,9) can provide a complementary measurement to immediately evaluate the actual sealing tightness of the CCS configuration as assembled by the parenteral packaging set-up. RSF is the force that a rubber closure flange exerts against the vial land seal surface of an assembled, capped CCS (2,6,7,8). In general, CCSs must have sufficient seal force in the first place in order to deliver acceptable CCI performance regardless whatever CCS configuration is to be used. However, different CCS configuration may lead to have different minimum RSF requirement for acceptable CCI performance. For a given CCS configuration, it is a common practice to adjust and set up proper stopper compression through the vial capping process in order to obtain sufficient RSF for acceptable CCI performance. RSF is included in USP 1207.3 as a seal quality test for parenteral vials. RSF testing can be used as a first-hand indicator related to acceptable CCI performance (9, 10), assuming the CCS components have no defect that can affect CCI (vial cracks, closure puncture, etc.). The resultant RSF values are directly influenced and controlled by the appropriate selection of rubber stopper, vial, and seal as assembled by the appropriate capping process set-up (10, 11).
Typically, rubber stoppers are made of rubber compounds mainly composed of polymers and fillers. Rubber polymer molecular structures can be linear, branched, cross-linked, and networked, all of which affect the chemical, physical, and mechanical properties of the rubber stopper (12, 13). Rubber stoppers exhibit both elastic and viscous resistance to deformation (14, 15). Rubber stoppers can retain the recoverable (elastic) strain energy partially, but they also dissipate energy (viscous) partially if deformation is maintained. Therefore, under constant strain, rubber stoppers undergo stress decay, known as stress relaxation (14, 15). The RSF of CCS configurations inevitably relaxes due to the viscoelastic characteristic nature of the rubber stopper materials (6,7,17,18,19). The degree of the resultant stress relaxation determines whether the CCS can maintain sufficient CCI throughout the entire sealed product life cycle. Here, this life cycle means the time interval between the moment the vial is capped and the moment the patient is dosed with the drug. As such, shelf life is a part of this sealed product life cycle. However, the sealed vial may also need to go through high-temperature terminal sterilization, low-temperature conditioning, shipping through different climates and/or elevations, use-and-reuse in multi-dose applications, and so on. All these events that occur after a vial is capped will have an impact on seal performance and must be considered as part of the sealed product life cycle.
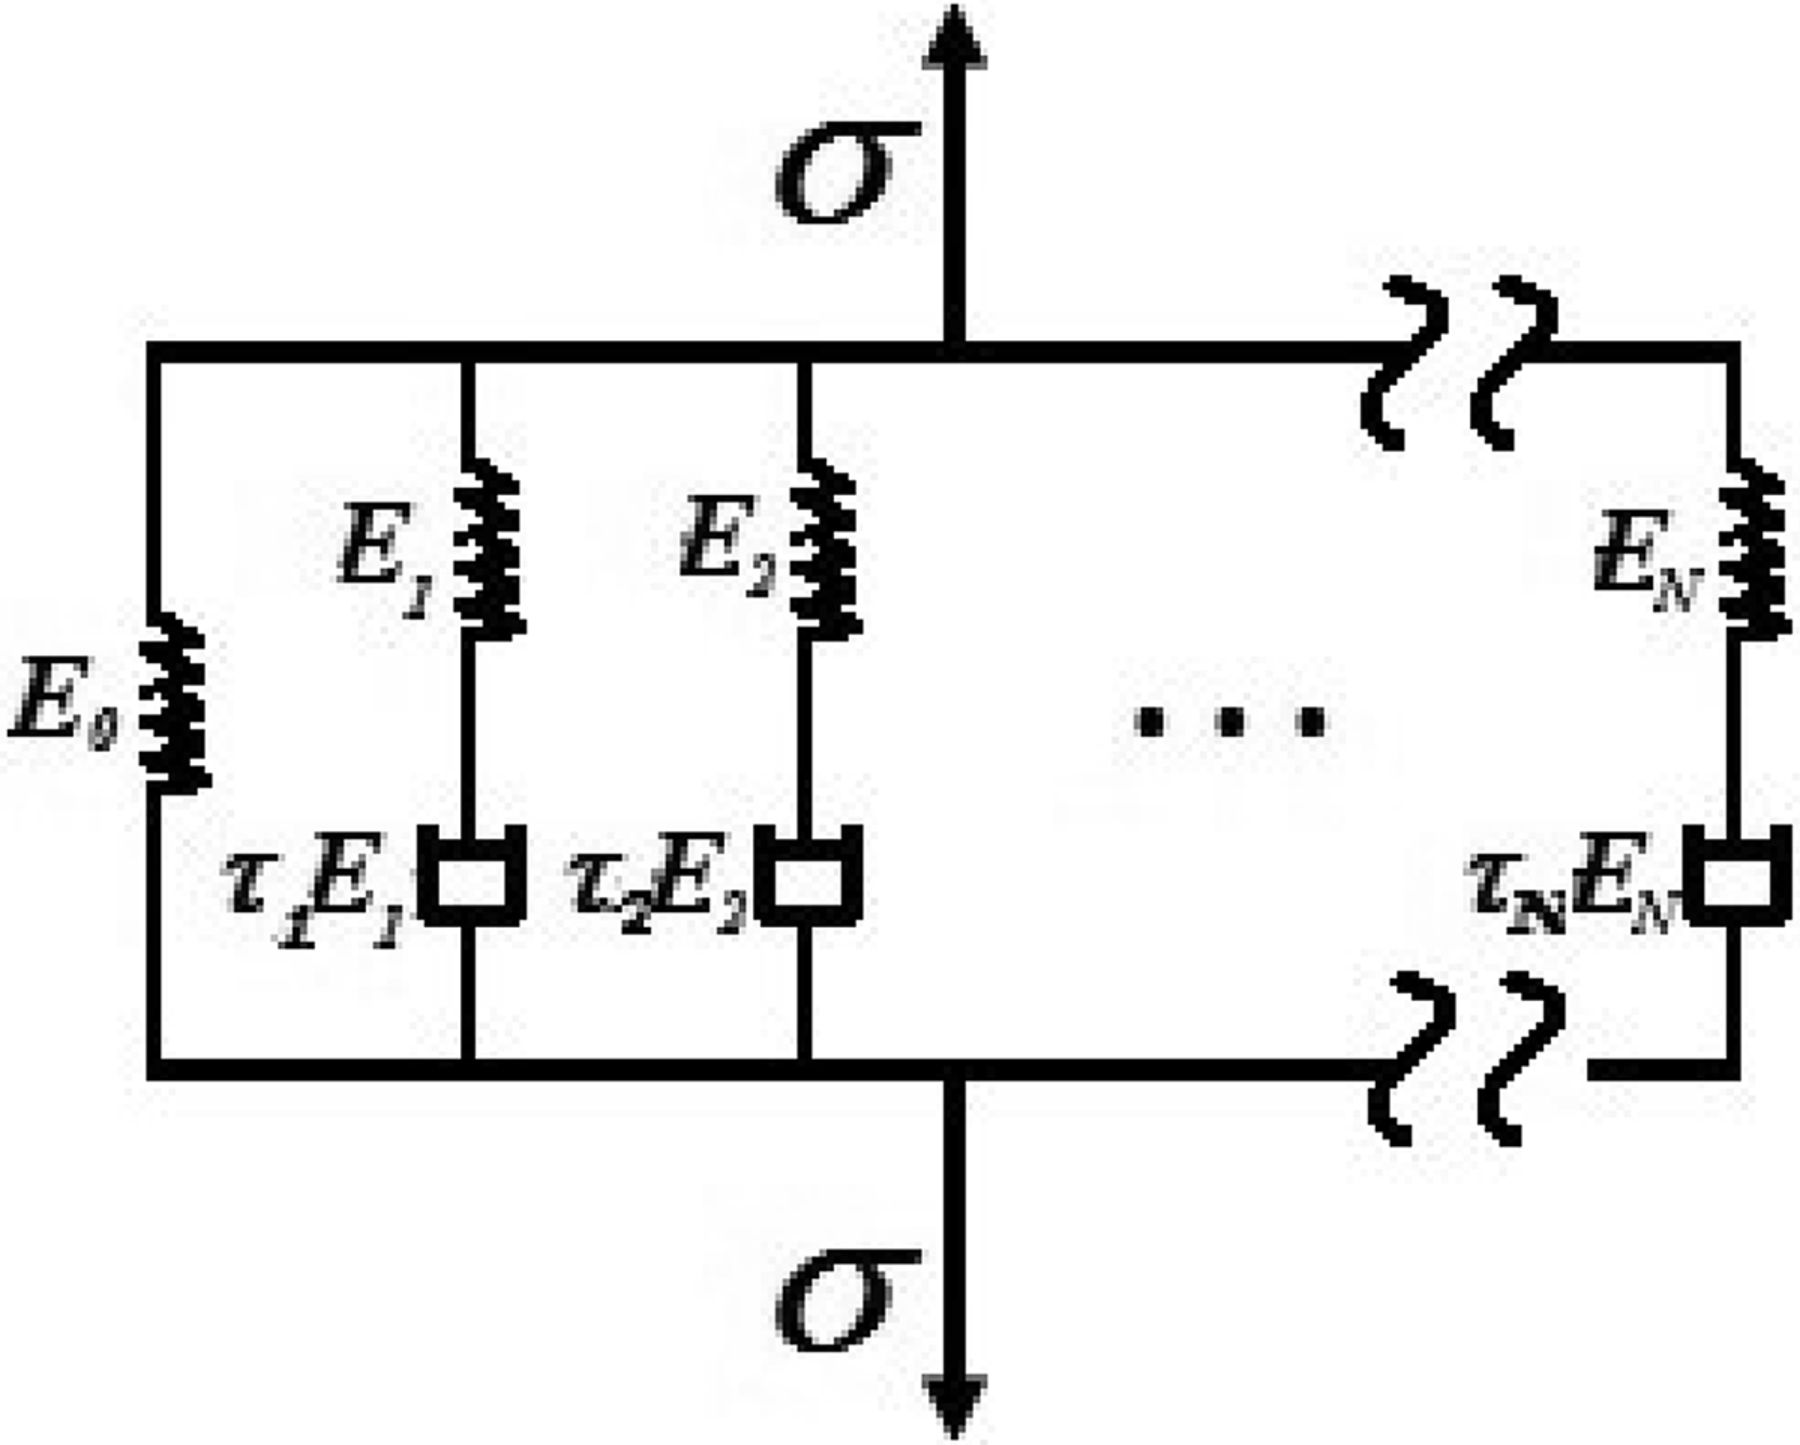
Based on polymer structure and property theories, some physical and mathematical models have been developed to simulate rubber stress relaxation under deformation (14, 15). Figure 1 represents the generalized Maxwell-Wiechert model (14, 15), in which a combination of spring and dashpot elements are connected either in parallel and/or series to simulate the stress relaxation of the rubber materials. The force in springs is associated with elastic resistance, while the force in dashpots is related to viscous resistance, which dissipates over time. Morton et al. published a paper (7) in the late 1980s on the development of an RSF test method by using an extensometer such as Instron, which included an introduction of the generalized Maxwell-Wiechert model and its applicability to RSF testing. A subsequent paper published by the same authors (11) presented results using the RSF test method primarily for evaluation of different rubber stopper materials, but also included additional limited RSF test data of the effect of time on one stopper material. Apart from the aforementioned paper, there has been a lack of systematic studies in the parenteral packaging industry evaluating the time-dependent influence on the sealing force relaxation of viscoelastic rubber stoppers.

The generalized Maxwell-Wiechert model (7, 14, 15) can be mathematically expressed by the following:
 Equation 1 is a set of linear ordinary differential equations. At constant strain e0 for stress relaxation, the summation of the integrations of eq 1 from t = 0 to t becomes (7, 14, 15):
 where
where
σι = stress for ith element
σ = overall stress
e = strain
Ei = modulus of ith element
τi = relaxation time of ith element
e0 = constant strain for stress relaxation
N = total number of elements
t = time
Eo is regarded as the modulus of an element for ultimate elastic stress at infinite time. The product of τi·Ei = ηi is the viscosity of the dashpot. The number N is the total number of elements, which can be optionally 1, 2, 3, etc., and will be determined depending on the complexity of the viscoelastic rubber material system. Equation 2 displays exponential stress relaxation decay over time due to the exponential function and eventually reaches an ultimate stress e0E0. The stress relaxation decay of the stopper sealing force is inevitable throughout the entire sealed product life cycle due to the viscoelastic nature of the rubber stopper materials. The initial sealing force at time zero (t = 0), the magnitude and slope of the stress relaxation decay over time, and the ultimate sealing force at infinite time are all determined by the compression percentage e0 and the elastic modulus Ei as well as the viscous relaxation time τi or viscosity ηi. The compression percentage e0 is the original compression enforced by the capping process. Excessive capping compression may cause stopper dimpling and/or cosmetic aluminum seal skirt wrinkling. Stopper dimpling may not only cause potential concerns for the stopper to be pushed into the vial during the needle penetration, especially for large spike needles, but also potentially risks CCI as the stopper flange is continually pulled away from the vial sealing surface. Lower capping compression may lead to insufficient sealing force and may subsequently result in CCI failure over time.
The elastic modulus Ei and viscous relaxation time τi or viscosity ηi are the physical and mechanical properties of the rubber stopper materials. Essentially, the rubber stopper material properties dominate the exponential sealing force decay slope throughout the entire sealed product life cycle. These material properties, in turn, are determined by the rubber polymer molecular structure and chemical formulation of the rubber stoppers together with the appropriate stopper manufacturing process and conditions (12,13,14,15). The rubber stopper materials must be properly designed, formulated, and manufactured to satisfy the demanding CCI performance throughout the entire sealed product life cycle. It is a common practice in the parenteral packaging industry to set up and adjust capping compression e0 to have an appropriate sealing force at time zero, such as high capping compression for stoppers with low elastic modulus (or so-called soft stopper), or vice versa. In general, the capping process set-up (e0) needs to be diligently managed together with the stopper material properties (Ei, τi, and ηi) for sufficient sealing force throughout the entire sealed product life cycle.
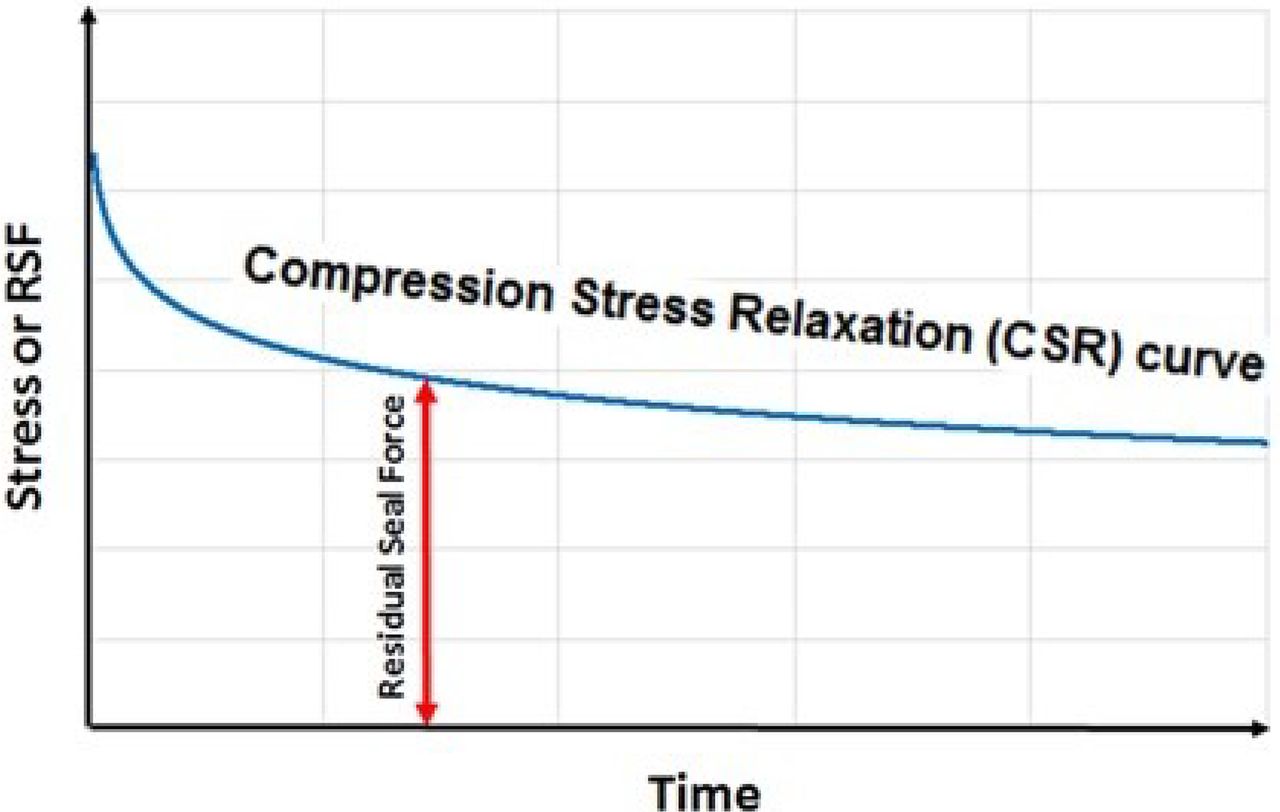
Figure 2 is a schematic drawing of the continuous, time-dependent compression stress relaxation (CSR) curve and RSF data point of rubber stoppers, assuming the completion of the vial assembly capping at t = 0. CSR is a continuous relaxation curve well defined in rubber polymer science (13,14,15), and RSF is any individual data point along the CSR curve as defined in the parenteral packaging industry (7⇓–9). In other words, any specific data point along the continuous CSR curve of Figure 2 corresponds to an RSF value at that particular moment in time. RSF is dynamically decayed along the CSR curve. Historically, an RSF data point for a vial assembly is discretely tested and collected from its own relaxation curve at the moment of the testing. The RSF data point can be measured by extensometer testing equipment such as Instron (7, 8). Mathaes et al. (9) recently published an alternate test method, in which a metallic vial fixture needs to be specifically constructed with a piezoelectric force sensor for RSF data collection. The magnitude and rate of RSF decay depend on rubber polymer molecular structure, rubber formulation, rubber properties, dimensions (stopper, vial, and aluminum seal), capping process set-up, and so on, all of which need to be carefully considered, selected, set up, assessed, controlled, and managed. Every drug is expected to maintain acceptable quality while being sealed in the CCS, and the rubber stoppers must provide sufficient RSF throughout the entire sealed product life cycle.
The purpose of this paper is to investigate the time-dependent nature of the rubber stopper sealing force and present (1) CSR testing and its time-dependent modeling fit for the rubber stoppers, and (2) RSF testing and its time-dependent modeling fit for the rubber stoppers. The modeling fit can be used to calculate and predict sealing force relaxation over time. In general, the mandatory regulatory requirement is that sterile pharmaceutical product remains sterile and that stability is maintained over the sealed product life cycle. These requirements on sterility and stability imply requirements for CCI, which in turn imply that sealing performance should be sufficient to maintain CCI. This paper intends to raise the awareness of rubber stress relaxation property impact on stopper sealability over sealed product life cycle for patient safety. The integrated framework from this study helps to properly consider and systematically manage the sufficient rubber stopper sealing performance throughout the entire sealed drug life cycle. Hopefully, this fresh methodology can be used as an investigation tool by readers to generate their own seal performance data for the evaluation of their own specific CCS configurations.
Experimental Testing and Modeling
There are two phases of the testing and modeling in our study:
Phase I: CSR testing and modeling fit
Phase II: RSF testing and modeling fit.
Phase I: Compression Stress Relaxation (CSR) Testing and Modeling Fit
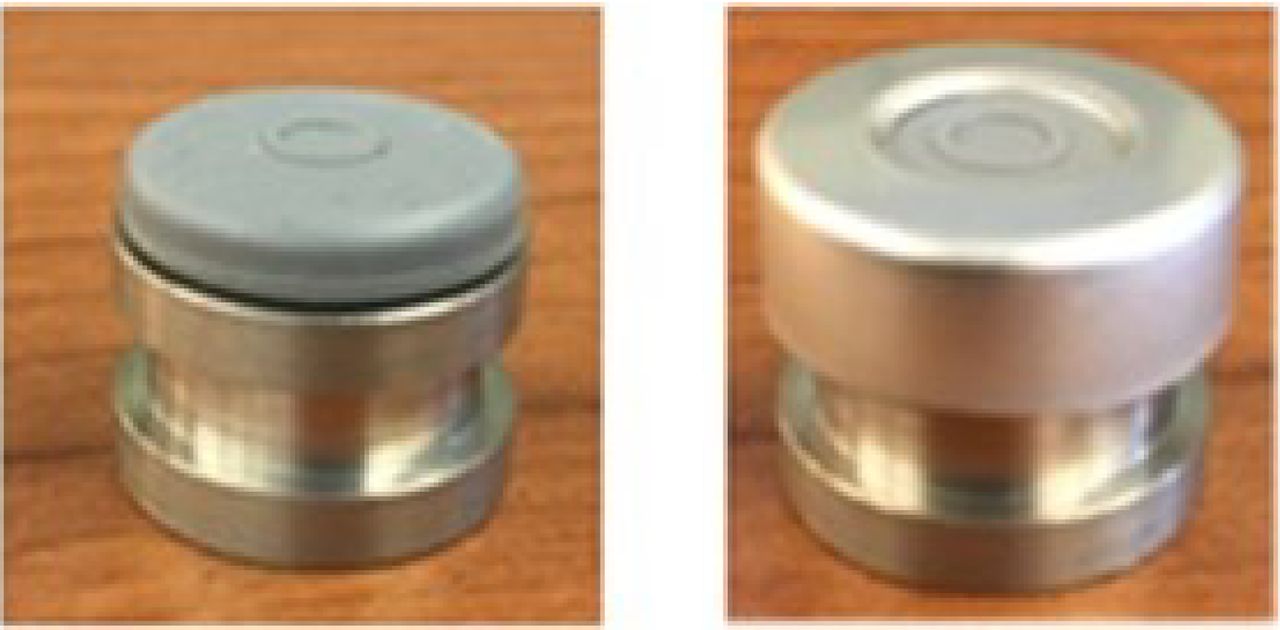
The CSR testing set-up is based on ISO 3384-1 Rubber, vulcanized or thermoplastic—Determination of stress relaxation in compression—Part 1: Testing at constant temperature, Method A. Instead of using typical cylindrical test button or O-ring samples, a testing sample assembly (Figure 3) is composed of a 20 mm rubber serum stopper plugged into a stainless steel fixture designed to dimensionally mimic a 20 mm glass vial (flange/neck/shoulder), both with and without an aluminum seal covering the stopper. For the testing sample assemblies covered with aluminum seals, the seals are not crimped onto the stainless steel vial fixture. The entire sample assembly is compressed between two flat metal plates and maintained at a fixed, constant 25% compression of the stopper flange thickness. The compression force vs time is continuously monitored for the duration of the testing. Basically, the test set-up and procedure are based on ISO 3384-1, but a modified rubber stopper sample assembly is used instead. The following is a summary of the test set-up:
A temperature-controlled chamber maintained at 23 ± 1 °C is used for all sample conditioning and CSR testing.
Samples are 20 mm serum stoppers with a nominal flange thickness of 3.33 mm. All of the test samples are conditioned at 23 ± 1 °C for at least 48 h before starting CSR testing.
A stainless steel fixture designed to dimensionally mimic 20 mm glass vial (flange/neck/shoulder) holds each 20 mm stopper as shown in Figure 3.
Two different sets of testing sample assemblies are evaluated. One set is with aluminum seals covered on stoppers, and another set is without aluminum seals, as shown in Figure 3. Multiple samples are tested for each set. For the sample assemblies covered with aluminum seals, a 20 mm West aluminum I-seal is used but is not crimped onto the 20 mm stainless steel fixture.
Each sample is subject to a fixed, constant 25% compression of the stopper flange thickness throughout the entire testing duration. The 25% compression is precisely controlled and maintained by testing machine.
Sample assemblies without aluminum seals are tested for 1000 h, whereas the sample assemblies with aluminum seals are tested for 1500 h. Note: the difference in test duration is due to equipment availability and the maintenance schedule.

The compression force vs time is continuously tracked and recorded by computer throughout the entire duration of the experiment without subjective human interference during the testing.
After the CSR curves (force vs time) were collected, the CSR modeling fit calculations (force vs time) were applied based on the generalized Maxwell-Wiechert model of eq 2. This model is idealized with the assumptions of first-order linearity and derives from the set of linear ordinary differential equations of eq 1. In general terms, the viscoelastic rubber stopper material is assumed to have both Hookean elastic solid behavior (in which stress is a first-order linear approximation to strain deformation) and Newtonian viscous liquid behavior (in which stress is a first-order linear approximation to strain deformation rate) at the same time. In reality, the assumption of linearity may not match well with the observed test data because actual stress relaxation of the rubber stoppers can be much more complicated. This complication is likely due to the rubber stoppers' nonlinear viscoelastic nature under large compression deformation coupled with restrained geometry conditions of the sealed vial assembly. The theory of nonlinear viscoelasticity has been widely discussed in rubber polymer science and engineering (20,21,22). If the viscoelastic response of the stress relaxation is different from the typical exponential decay of eq 2, its viscoelasticity is likely no longer linear. There is no universal constitutive equation that can predict the nonlinear viscoelastic response of all the rubber polymer materials. Hence, the modeling fit is to be modified case by case. Based on our progress during the course of this study, the nonlinear Kohlrausch-Williams-Watts (KWW) function (20, 23, 24) was chosen to modify the exponential function of the generalized Maxwell-Wiechert model of eq 2. Setting N = 1, the modified model becomes:
 The KWW function is a stretched exponential function. The exponent β describes the breadth of the distribution in the limits of 0 < β ≤ 1. The β-term has been empirically associated (20,24,25,26) with rubber polymer molecules and molecule-to-molecule interactions including molecular structures, molecular weight, molecular weight distribution, crosslinking structure, crosslinking density, and so on, all of which affect the energy dissipated during stress relaxation. The nonlinear KWW stretched exponential equation has proven to be more appropriate in modeling polymer stress relaxation than the simple exponential equation in many modeling applications (20,24,25,26). The number N represents the degree of simulation complexity for the rubber polymer structure. The more complicated the structure, the larger number N is likely to be, which leads to more sophisticated modeling fit calculations and more computing iteration times. Based on progress from our modeling fit iterations during the course of the study, it was found that setting N = 1 for our case gave good modeling fit results without sacrificing valuable computation time. Equation 3 is the base of modeling fit for the study.
The modeling fit with the test data was carried out using following Maxwell-Wiechert model modified by the nonlinear KWW stretched exponential equation as per eq 3:
 where x1, x2, x3, and x4 are the parameters adopted to represent e0E0, e0E1, 1/τ1, and β, respectively. The numerical modeling fit calculation uses the reduced gradient nonlinear method (27,28,29) by systematic iterations for the minimization of:
 where Ft = observed force and Fm = modeling force. F(x) is nonlinear. The reduced gradient method is to solve the partial differential equation matrix:
 by the following numerical iterations:

 Once all the final values (x1, x2, x3, and x4) have reached and satisfy ‖(∇F(x))‖ < ϵ, the numerical modeling fit is complete. Modeling fit based on eq 5 through eq 8 can process massive amount of testing data simultaneously from multiple testing curves collected from the same testing set-up. The modeling fit algorithm can be employed by the user as an investigation tool to calculate the sealing force throughout the entire sealed product life cycle.
Phase II: Residual Seal Force (RSF) Testing and Modeling
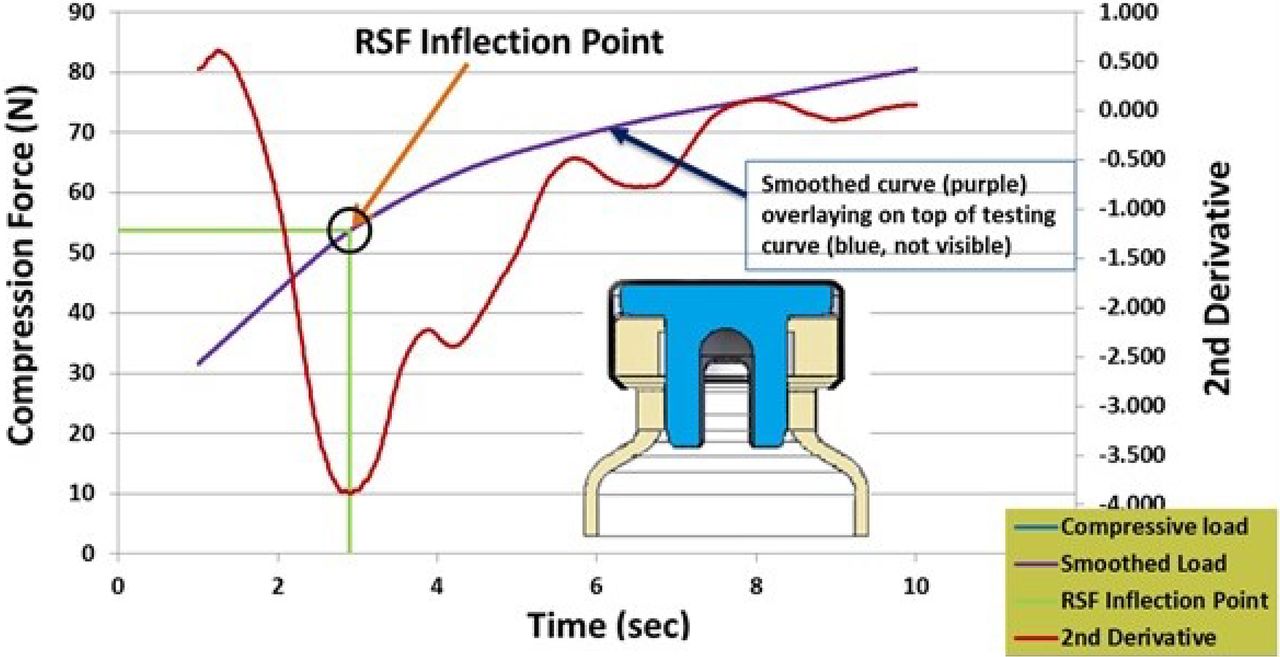
RSF is the force that a rubber closure flange exerts against the vial land seal surface of an assembled and capped CCS. RSF starts and continues immediately after a vial has been capped. However, once a vial has been capped, the RSF also starts to continuously decay. RSF is time-dependent, and the actual magnitude of RSF value depends on the timing when it is tested. The RSF of the sealed vial assemblies can be measured by an extensometer such as Instron (7, 8). Basically, it can be summarized to have four steps (8) to capture a single RSF data point as shown in Figure 4: (1) to test and collect the original compression data curve (force vs time) using an extensometer such as Instron, (2) to run the quadratic regression to minimize the testing noise and get the smoothed data curve from the original testing data curve, (3) to calculate the 2nd derivative data curve from the smoothed data curve, and (4) to locate the unique RSF inflection data point on the original testing data curve by corresponding it to the absolute minimum of the 2nd derivative at the exact same point on the time axis.
The local quadratic regression smoothing is a linear regression (8, 27, 30) for
 Based on mathematical algorithm from typical textbooks (27, 30), using least squares for calculating the best a, b, and c values by minimizing the function,
 Solving equations ∂F/∂a = 0, ∂F/∂b = 0, and ∂F/∂c = 0. This is done with matrices.
 where
where
F = compression force
t = time
a, b, and c are calculated smoothing parameters
Unlike CSR testing, which can be tested continuously on the same sample, RSF testing is a discrete test method for an individual sample because the internal stress-strain status within the sample assembly will change and redistribute immediately after the RSF measurement. Fundamentally, rubber polymer is a well-known viscoelastic material (12⇓⇓–15, 20⇓⇓⇓⇓⇓–26). Rubber has both elastic characteristic and viscous characteristic. As described in generalized Maxwell-Wiechert model (Figure 1), under constant compression percentage, the elastic stress portion is represented by springs, and the viscous stress portion is represented by dashpots and to be dissipated over time. The exponential decay of rubber CSR (either for CSR or RSF decay) is due to the viscous stress decay (related to dashpots in Figure 1). For RSF testing on a vial assembly, it has to enforce additional over-compression in order to generate a testing curve passing its RSF inflection point for subsequently calculating the RSF inflection point result (Figure 4). Theoretically, multiple RSF testing on a same vial sample by repetitively adding and removing additional compression percent to the original existing compression percentage within the same vial assembly, the elastic stress portion is fully recoverable regardless how many times of additional compression percentage and subsequent removal are repetitively going to be over the time. The viscous stress portion under additional compression percentage will be initially “returned” to certain level once the additional compression percentage is removed and the compression percentage recovered to the level at its original existing compression percent, but the viscous stress is not fully recoverable and there will be extra viscous stress dissipation in addition to its original decay from original existing compression percentage. The viscous stress will be completely dissipated and ultimately exhausted over the time, and the level-off portion of the relaxation curves in Figure 2 is mainly from elastic stress portion under a constant compression. In a schematic description, the more compression, the more and quicker piston displacement (Figure 1) within dashpot, leading to have more viscous stress dissipation. The more additional over compression, the more nonrecoverable viscous stress drop (dissipation) is going to be within the vial after each RSF testing on the same vial sample. Multiple RSF testing on the same vial assembly will artificially accelerate and create its own new viscous stress decay path much faster than its supposedly original viscous stress dissipation decay path and may rapidly advance and exhaust its viscous stress, and consequently make the decay curve level off faster. Multiple RSF testing on the same vial assembly will mess up the track of original RSF decay curve along its natural time axis, and it will be very difficult to establish the time-dependent modeling prediction without knowing its supposedly original RSF decay curve along its natural time axis.
However, multiple RSF testing on the same vial sample is supposedly not to destroy its ultimate RSF force (schematically level-off portion of Figure 2), but it just artificially messes up much-needed time track for time-dependent modeling fit and prediction. Because our intention is to construct an RSF relaxation decay trend for time-dependent modeling fit along the time axis, we choose to test undisrupted vial assemblies at each scheduled time point for time-dependent modeling fit. In order to do so, we had to seal thousands of vials in one single batch on the same day by using the same rubber stoppers, glass vials, aluminum seals, and crimping through the same capping process set-up, but tested each vial sample only once at a different time point and recorded it accordingly for time track and subsequently used the testing data for time-dependent modeling fit laer.
After thousands of RSF vial samples being made in a single batch, RSF testing is carried out by following a planned time schedule to pull out a group of ten sample assemblies each time from the same aforementioned sample batch. The RSF test data are recorded along the time axis for time-dependent evaluation and modeling. Here is the RSF testing set-up and procedure in detail:
The laboratory temperature is maintained at 22 ± 1 °C for both sample conditioning and testing.
Samples are 20 mm serum stoppers with a nominal flange thickness of 3.33 mm. These are the same stoppers used for CSR testing.
Stoppers are placed into 20 mm, 10 mL Schott Standard glass vials.
Vial and stopper assemblies are covered with 20 mm West aluminum I-seals. The same seal was also used for CSR testing.
All testing samples are capped using a Genesis RW-4 #R425 capping machine with the exact same capping process set-up.
A single batch of all the sample assemblies is made on the same day. A group of 10 sample assemblies is pulled out from the batch each time for RSF testing per the following time schedule:
Pull 10 samples every day for the first 2 weeks, excluding weekends and holidays.
Pull 10 samples at the end of third week and fourth week.
Pull 10 samples at the end of second month and third month.
All the testing assemblies are conditioned at 22 ± 1 °C temperature all the time before starting the RSF testing.
The RSF of the vial assemblies is measured by Instron (model 3345 with 500 N loadcell) at 0.05 cm/min compression speed, using Ludwig's method (8) and the same testing fixture design (Cap Anvil D) proposed by Ludwig (8).
After all the RSF data (force vs time) was collected, the RSF modeling fit calculation was applied based on eq 4 followed by the same reduced gradient nonlinear approach as shown by eq 5 through eq 8.
Results and Discussion
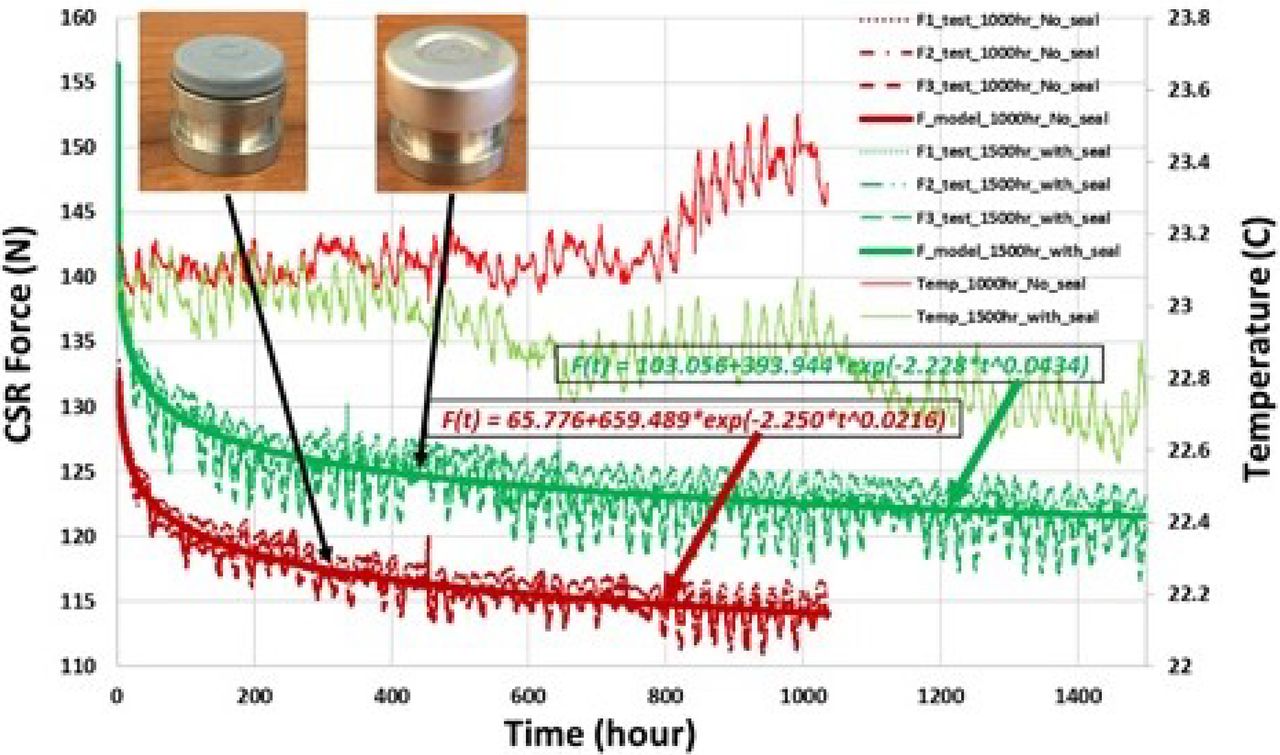
The original CSR test data along with the CSR modeling data is represented in Figure 5. The dark red curves are for sample assemblies without aluminum seals tested for 1000 h, whereas the dark green curves are for the sample assemblies with the aluminum seals tested for 1500 h. Each set of CSR testing data curves includes three testing samples as shown by the legend in Figure 5. The resultant modeling fit (smooth curves) and equations for each CSR set are included in Figure 5. The light red curve and light green curve are the testing temperatures whose colors correspond to their respective sample assemblies. All of the sample assemblies are compressed at the fixed, constant 25% of the stopper flange thickness. The following are some major highlights from Figure 5:
Evidently, testing curves are very explicitly and consistently grouped separately according to samples with and without seals. Both testing assemblies (with and without aluminum seals) clearly demonstrate exponential decay as expected due to the viscoelastic nature of the rubber stoppers and eventually level off. The CSR modeling curves match very well with the testing data curves.
The CSR data curve (dark green) for the sample assemblies with the aluminum seals is higher than the CSR curve (dark red) for the sample assemblies without the aluminum seals. This is mainly because the aluminum seal prevents the rubber stopper from further deforming and flowing in the horizontal direction as opposed to the sample assembly without the aluminum seal. This restrained geometry results in the increase of stress in the vertical direction.
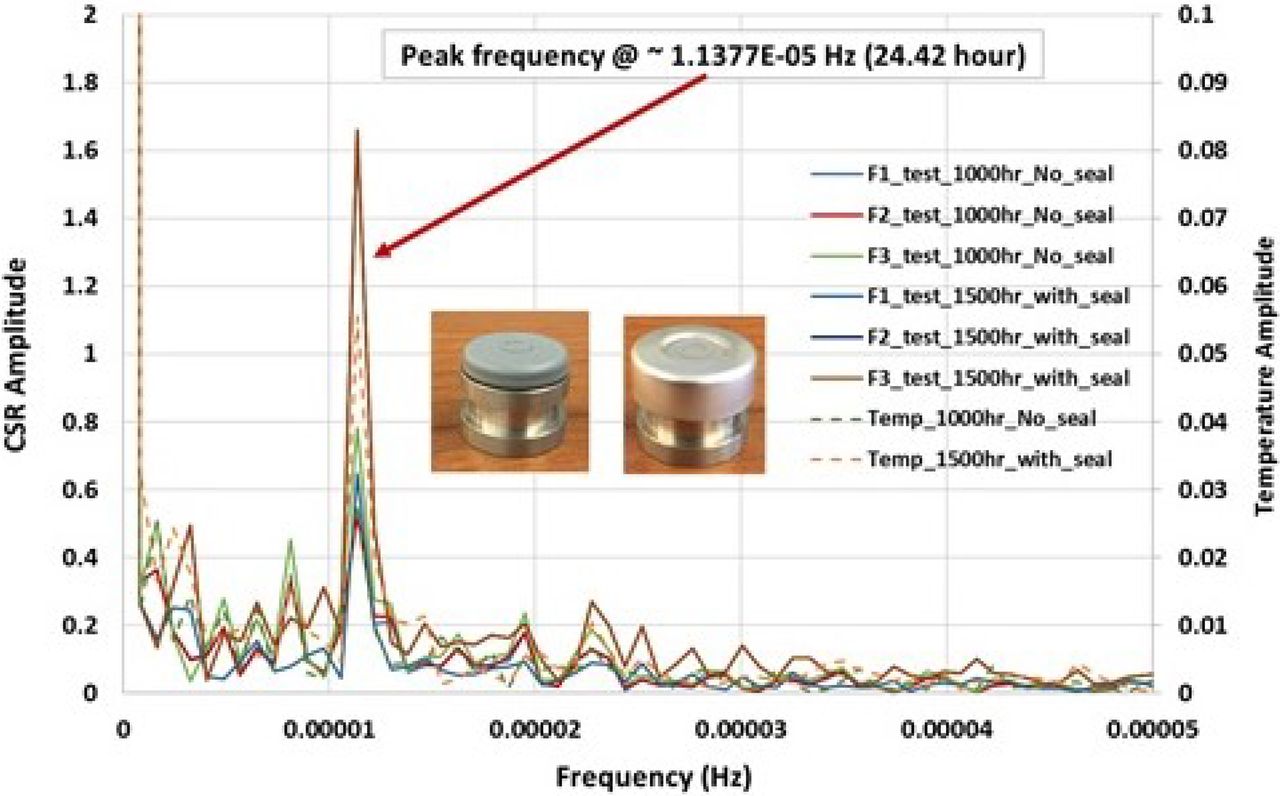
Both CSR test data and temperature data have cyclic variations, as shown in Figure 5. It is observed that the CSR variation cycles appear to be equivalent to the temperature variation cycles for the same up-and-down cycle time. To substantiate the cyclic observations, the Fast Fourier Transform (FFT) calculation (16, 27, 31) is carried out per eq 12 to convert all of the original CSR and temperature data from its original time domain to its frequency domain,
 where n represents a discrete sequence of sequential data points in the time domain, and k is a discrete sequence of sequential data points in the frequency domain. yn represents the original CSR or temperature data points in the time domain, and Yk is the transformed FFT data points represented in the frequency domain. Figure 6 is the FFT results in the frequency domain. All eight FFT curves (both CSR and temperature) have their major peaks co-located at the exact same 1.1377 × 10 –5 Hz frequency, equivalent to a cycle time of 24.42 h, which is almost a daily cycle. The rational here is that the daily CSR variations are caused by daily temperature fluctuations, where approximately ∼0.2 °C daily temperature variations lead to ∼5 N CSR force variations, as shown in Figure 5. Even though the temperature chamber for CSR testing is well controlled per ISO 3384-1 standard at 23 ± 1 °C, it still has small daily ∼0.2 °C temperature changes corresponding to a weather climate cycle from daytime temperature to nighttime temperature. Basically, CSR force is sensitive to temperature change. If a sealed vial assembly is purposely stored at different temperatures, the sealing force is going to change correspondingly. CSR force is not only time-dependent, but also temperature-dependent (another subject to be studied for future publications). At this point, however, the current CSR model does not include temperature as a variable in the Maxwell-Wiechert model modified with the nonlinear KWW stretched exponential function (eq 4), and the cyclic CSR variations due to temperature fluctuations are considered as a noisy variation in the modeling fit through eq 5 to eq 8. The modeling fit just captures the overall exponential CSR decay trend vs time for the specified 23 ± 1 °C range.


The RSF data together with the RSF modeling fit curve are represented in Figure 7, in which the discrete blue dots represent the original RSF test data points and the continuous green curve is the modeling fit data calculated from those individual RSF data points. The discrete RSF test data points in Figure 7 are collected and recorded along the time axis according to testing plan for time track. There are RSF data variations within each testing sample group as shown in Figure 7, and these variations are statistically inevitable, and likely due to the stack of dimensional tolerance variations (stoppers, vials, and aluminum seals), rubber stopper material property variations within the same batch, consistency of the capping process, temperature fluctuations, timing variations of the RSF testing, and so on. Another source of RSF data variations is from the RSF measurement method itself by using an extensometer, and that is why every RSF inflection point calculation needs to go through the local quadratic regression first to smooth the RSF testing data curve and minimize the statistical testing noise from the RSF measurement itself (8). The time-dependent RSF modeling fit is to capture the overall RSF exponential decay trend vs time. The resultant modeling fit equation is included in Figure 7. Note that the time t in equation in Figure 7 should be in hours, though the horizontal axis is expressed in weeks. As an example of modeling application, the RSF prediction at the end of 5 years is 79.648 (N) as shown in Figure 7.
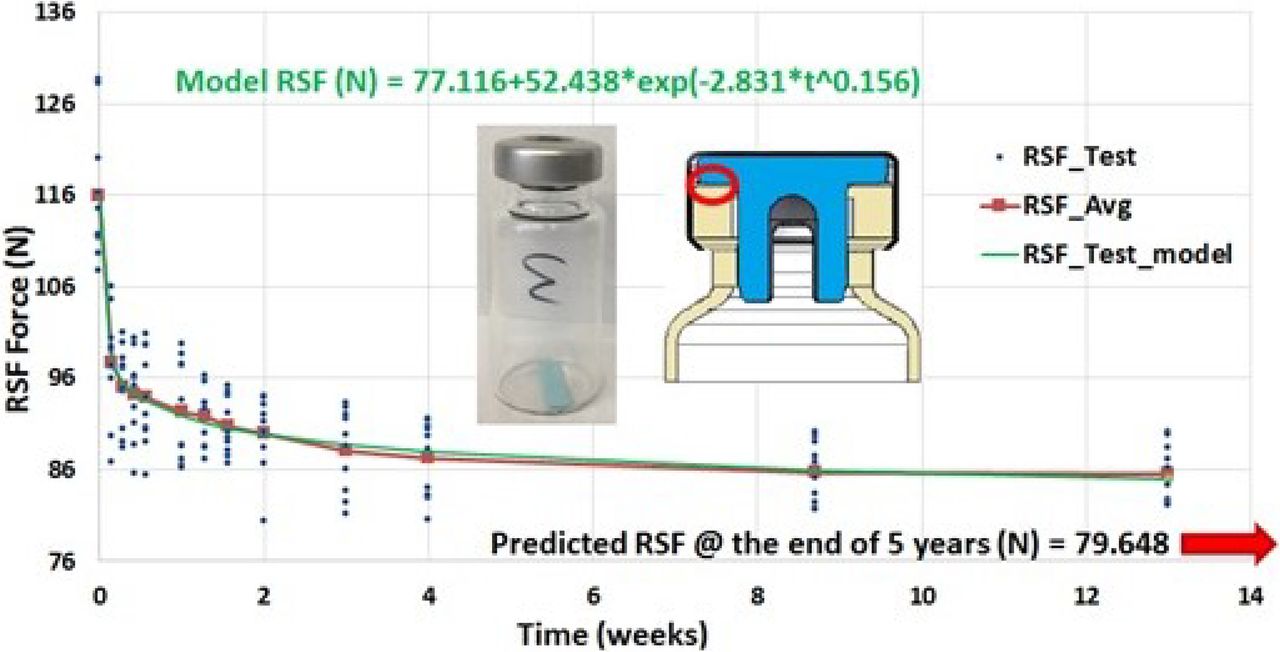
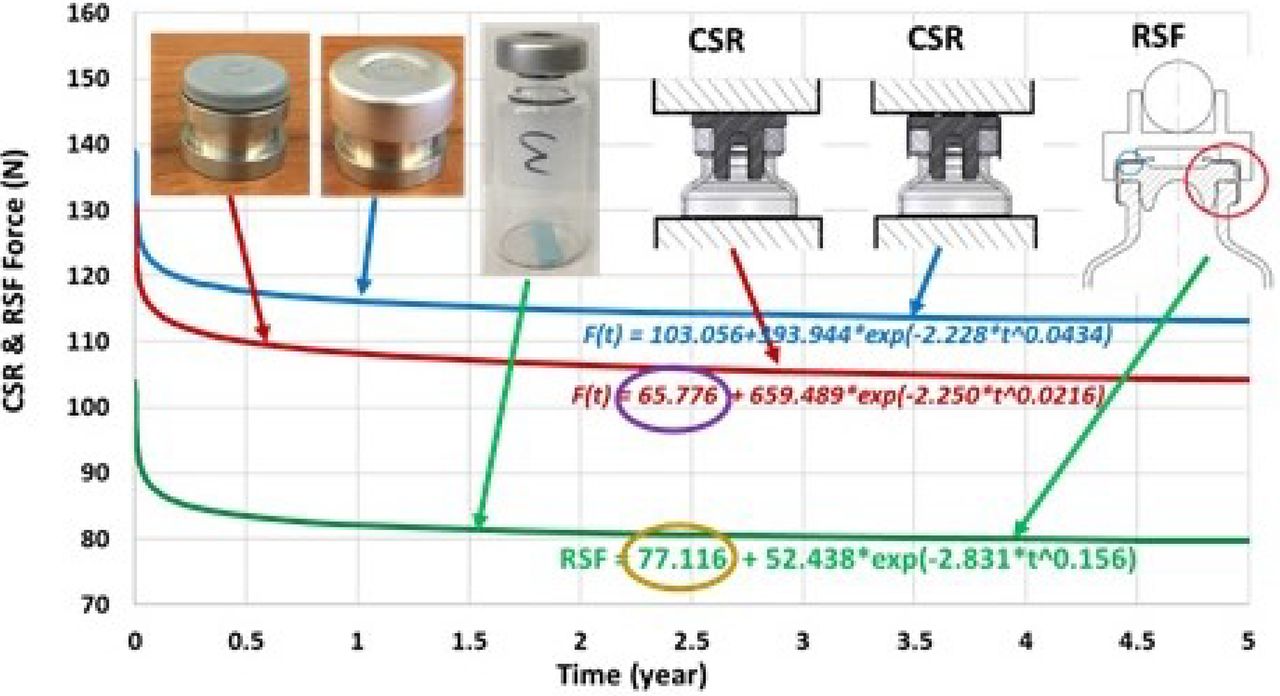
Figure 8 is the recap of all the CSR and RSF modeling data curves together with their modeling fit equations. Note that the time t in all equations in Figure 8 should be in hours, though the horizontal axis is expressed in years. The following are some discussions in general:
Both CSR and RSF have shown time-dependent exponential decay due to the viscoelastic stress relaxation of the rubber stoppers, and this levels off eventually. However, it must be made clear that the CSR testing per ISO 3384-1 is just a foundation used to schematically demonstrate and explain the time-dependent decay nature of seal force. The CSR testing data in this paper must not be mistakenly used to quantitatively match and predict the exact RSF. The seal top deformation difference (CSR flat top vs RSF crown top contour) will lead to having different rubber stopper stress distribution and different exponential decay paths, as well as different stopper seal force level over time. The scope of this paper does not include using CSR testing per ISO 3384-1 to match and predict exact RSF results.
Using the same rubber stoppers, the differences of stress relaxation levels between CSR and RSF are mainly associated with the following:
For CSR testing, at fixed constant 25% compression per ISO 3384-1 specifications, the vial seal top is maintained flat by the metal fixture plate during CSR testing. The CSR compression percentage can be quantitatively determined and precisely controlled and maintained during the test. Based on CCS component dimension data, the nominal stopper flange diameter is 0.837′ calculated at ideal 25% compression with compressed flat top. The nominal inside diameter of the aluminum seal is 0.810′. The aluminum seal will touch and block the horizontal flow of rubber stopper flange in comparison with less blockage of horizontal rubber flow for stoppers without aluminum seals. This leads to having the higher CSR with an aluminum seal (blue curve in Figure 8) than without an aluminum seal (red curve).
For RSF testing, all the sample assemblies were made through the same capping process set-up. It is difficult to test and measure the exact compression percentage because the top of the vial assembly is not flat. There is no standard test method available for how to define and measure compression percentage for a sealed vial with a crown top contour. The exact contour shape is so formed by itself in real time determined by CCS stress redistribution and deformation after the capping process. However, it is empirically and subjectively estimated by trial operators to have roughly less than ∼20% compression of the stopper flange thickness, and it was never actually measured because of lack of well-defined standard test method. The RSF sample vial top has a crown shape deformation because of rubber flow during the capping process, which is different from the relatively flat top deformation during CSR compression. Based on CCS component dimension data, the nominal stopper flange diameter is calculated at 0.809′ for presumably ideal 20% compression with a compressed flat top, and it is actually less than 0.809′ diameter for RSF vial samples with a crown top contour because stopper rubber partially flows vertically upward to form the crown top. The nominal inside diameter of the aluminum seal is 0.810′. As clearly shown by cross-sections of RSF vail samples by X-ray computed tomography imaging in Figure 9, all RSF vial samples never have their stopper flange edges blocked by the side skirt of aluminum seals even though we do not know the precise compression percentage for RSF vial samples due to lack of standard testing methods. As a rational outcome, it reasonably explains why the 25% compression CSR curve without seal is higher than the RSF curve in Figure 8, and this is because RSF compression is much lower than 25% and the rubber stopper flange is not horizontally blocked by the side seal skirt of RSF samples.
In Figure 8, the purple circled value in the modeling fit equation for the CSR curve, without an aluminum seal, is lower than the golden circled value for the RSF curve with an aluminum seal. These two values represent the ultimate force of the CSR or RSF at infinite time. In other words, the red CSR curve without an aluminum seal will cross over and become lower than the RSF curve sometime beyond 5 years but before infinite time. It is going to take 84,880,914 years to get to the crossover point by calculation, and this is beyond practical interest. As the modeling fit equations are clearly shown in Figure 8, readers can easily perform the calculation and construct their own chart for whatever time of their own interest without being limited to 5 years. Because both CSR and RSF testing used the same rubber stoppers, this curve crossover demonstrates that the stress magnitude and relaxation slope likely depends not only on the original compression (25% vs ∼20% compression) but also the restrained dimensional conditions (with and without aluminum seals) on the rubber stoppers as well as the deformation shape (flat top vs crown top).
The exponent β values of the three KWW modeling equations in Figure 8 are all different. This demonstrates that the nonlinearity of the time-dependent stress relaxation is associated with both the large deformation of the rubber stoppers and the restrained geometry conditions. In a practical sense, both product dimensional design (rubber stopper, aluminum seal, and vial) and restrained dimensional conditions together with capping process set-up likely have an impact on the time-dependent stress relaxation of the vial sealing performance.

It is well recognized that rubber stress relaxation is predominantly determined by its viscoelastic properties. The rubber formulation and the rubber stopper manufacturing process determine the viscoelastic properties of the rubber stopper products. In addition, the viscoelastic properties of the rubber stoppers may be affected by washing process, sterilization process, drug contact, shipping and storage conditions, and all of which may influence the time-dependent stress relaxation of the rubber stoppers. Shipping and storage at different altitudes can cause pressure differentials of the sealed vial assemblies and subsequently change the stress relaxation curve trend. Stopper coating may also have an impact on CCI performance. In general, CCS must have sufficient seal force in the first place in order to deliver acceptable CCI performance regardless whatever CCS configuration is to be used. The question as far as how much seal force is sufficient for acceptable CCI is yet to be further quantitatively investigated on a case-by-case basis for any specific CCS configuration (including stopper coating). Hopefully, our methodology framework can be a tool used as a part of future investigation and publications regarding how to conduct and iterate the time-dependent stress relaxation testing and modeling for all these scenarios.
Conclusion
Through an integrated approach, this study conducted two major testing evaluations: CSR testing based on the ISO 3384 standard and RSF testing for time-dependent experimental data collection. These experiments were followed by nonlinear, time-dependent sealing force modeling fit calculations based on the Maxwell-Wiechert theory modified with the KWW stretched exponential function. By employing both experimental evaluation and modeling calculations on a 20 mm vial/stopper/seal CCS, the results demonstrate that the testing and modeling data show good consistency and the time-dependent sealing force decays exponentially and eventually levels off. This paper shows that the nonlinearity of the stress relaxation of the rubber stoppers derives from the viscoelastic characteristics of the rubber stoppers coupled with their compression into restrained geometry conditions. The modeling fit with capability to handle actual testing data can be employed by the user as an investigation tool to calculate the sealing force throughout the entire sealed product life cycle for their own CCS configurations. In addition, the stress relaxation of the rubber stoppers is not only time-dependent but was also experimentally shown to be temperature-dependent as substantiated by FFT analysis. The sealing force change due to temperature variation is an important subject for further extensive study and publications.
The present work provides a new integrated methodology framework and some fresh insights to the parenteral packaging industry for a systematic approach for how to practically and proactively consider, design, set up, control, and manage stopper sealing performance throughout the entire sealed product life cycle. By using the same integrated framework laid out from this study, more experimental evaluation and modeling fit calculations are to be iterated and conducted for future case study and publications to evaluate the time-dependent stress relaxation under different scenarios such as different rubber stoppers with different viscoelastic properties (due to different rubber formulations, different manufacturing process conditions, different washing and sterilization conditions, etc.), different dimensions, different capping process set-up, different drug contact, different shipping and storage conditions, and so on, all of which are for the purpose to warrant sufficient sealing performance for the CCS throughout the entire sealed product life cycle.
Conflict of Interest Declaration
The authors declare that they have no competing interests.
Acknowledgments
The authors wish to thank Le Ho for his extensive laboratory assistance and Tom Coccia and Mark Lacek for their creative design and machining all the fixtures used in this study. The authors also wish to thank Roger Asselta, Vice President, Genesis Packaging Technologies, Exton, PA, for his help in preparing vial sample assemblies and his technical advice.
- © PDA, Inc. 2018


