
Abstract
This article presents a new theoretical integrated modeling approach for calculating container closure integrity (CCI) that concurrently accounts for both diffusion and mass/volumetric flow in real time; practical case studies are also presented. For pharmaceutical, biological, cell, and gene therapies, container closure systems (CCSs) must ensure drug sterility and stability by safeguarding against microbial contamination and gaseous ingress (e.g., oxygen, carbon dioxide, moisture) according to product requirements. In addition to the testing approach for evaluating CCI performance, a modeling approach can be an important part of a CCI control strategy. Modeling is a powerful tool that provides information in situations where testing is not feasible, technically impossible, too time-consuming, or too expensive. Previously published models have lacked a systematic approach or the versatility needed to coherently and concurrently integrate both diffusion and effusion to solve problems arising in field applications. The new integrated modeling approach described in this article applies a robust numerical method to real-world applications. The model is based on the law of conservation and continuity for molecular flow, Fick's law of diffusion, and the Darcy–Weisbach theory of frictional mass/volumetric flow. This new integrated modeling approach handles time-dependent diffusion and effusion by combining diffusion and mass/volumetric flow seamlessly in real time. For a CCS under vacuum filled with nitrogen, this new modeling approach is able to reveal that oxygen ingress into the CCS through a leak path will enter in two phases, starting with effusion and continuously followed by diffusion in a seamless transition. Our integrated modeling approach is able to calculate and capture the exact timing of the phase transition point, providing unique understanding of complicated CCS problems. Using the finite difference method, all modeling results are numerically solved from the governing equations along with initial and boundary conditions for each individual case. The modeling results were precise and consistent with previously published testing results. This new integrated modeling approach displayed its capability and versatility to handle complicated leakage scenarios in practical applications. As a part of CCI control strategy, the modeling approach is a powerful tool for evaluating leaks, gauging their leak sizes, determining whether the CCS conforms to product requirements, and making informed decisions accordingly. Although additional studies are to be carried out to fully develop the potential of this model, the applications hold great promise and in addition provide insight into CCI and may also provide a solid foundation for CCI testing method development and validation for CCI performance.
- Container closure system (CCS)
- Container closure integrity (CCI)
- Diffusion
- Mass and volumetric flow
- Fick's law
- Darcy–Weisbach equation
Introduction
Container closure systems (CCSs) are designed to maintain the sterility and stability of pharmaceutical products, which must be free of microbial contamination. Gaseous ingress such as oxygen, carbon dioxide, or moisture must be controlled according to drug sensitivity and specific product requirements. Additional protection can be achieved by filling the headspace with inert gas, which may require a lyophilization process for maintaining a certain vacuum pressure level over the product shelf life. Under normal conditions for processing, storing, and shipping, and regardless of whether vacuum sealing is used, a CCS must be properly evaluated to ensure its container closure integrity (CCI) throughout its entire sealed product life cycle. Appropriate CCS qualification for its CCI performance is mandatory before human use. The regulatory requirements for CCI have been addressed by the U.S. Food and Drug Administration (1), USP <1207> (2), the European Commission EudraLex, Volume 4, Annex 1 (3), and the ICH (Q5C) (4).
CCS leakage refers to molecule flow through a leak path under specific conditions and can result in either ingress or egress from the container. The leakage can be because of molecule diffusion and/or mass/volumetric flow. Given that these two flow types are driven by different physical forces, their flow rates are very different. Molecule diffusion depends on the molecule concentration differential, where molecules flow from a high concentration area to a low concentration area (5, 6). Mass/volumetric flow depends on the total pressure differential, where molecules are forced from a high-pressure area to a low-pressure area (5, 6). Molecule diffusion can occur without mass/volumetric flow where a total pressure equilibrium exists (zero total pressure differential), or it can occur simultaneously with mass/volumetric flow. Fundamentally, the dynamic nature of molecule flow means that CCS leakage and CCI are time-dependent. We will further discuss the dynamic nature of molecule diffusion and mass/volumetric flow later in this article.
Previous publications (7⇓–9) have offered holistic considerations for ensuring CCI performance along with the associated CCI testing methods. The CCI performance of a vial CCS has been shown to depend on the stopper sealing force (10⇓⇓–13). However, any type of testing technique may be inadequate because of many factors including: a) specific setup under very specific testing conditions; b) destructive methods that do not occur under real-world conditions; c) inability to iterate testing on the same sample to identify a trend because of a destructive method; d) lengthy testing time consumption for trending resultants from slow leakage; e) issues with representative sampling; and f) resulting inability to reproduce and predict results for various real-world applications. To address these shortcomings, a well-designed modeling approach provides more systematic understanding and more consistent prediction of CCI performance.
There has been a challenge for properly establishing and applying CCI modeling in the parenteral packaging industry. Some publications have explored CCI modeling approaches. Prisco et al. (14) proposed a modeling approach dealing with mass/volumetric flow, which they subdivided into three modeling regimes, namely laminar flow, molecular slip flow, and Knudsen flow, depending on the leak path diameter. Victor et al. (15) tried to establish analytical equations for calculating molecule diffusion and mass/volumetric flow (called effusion). Hede et al. (16) used a revised analytical equation of diffusion to approximate an effusion problem under a small initial 100 mbar of total vial pressure differential.
The purpose of this article was to offer a new integrated modeling approach that concurrently accounts for diffusion flow and mass/volumetric flow based on the law of conservation and continuity for molecule flow, Fick's law, and the Darcy–Weisbach equation of frictional mass/volumetric flow. The numerical modeling approach was used in practical case studies to accurately calculate time-dependent CCI leakage in different packaging formats, packaging conditions, defect types, and defect sizes. This numerical CCI modeling approach is much more robust for real world applications.
Methods—Formulation of the Integrated Modeling Framework
The theories for molecule diffusion and mass/volumetric flow have been very well established with very well-defined assumptions/hypotheses in textbooks (5, 6) for the law of conservation and continuity for molecular flow, Fick's law of diffusion, and the Darcy–Weisbach theory of frictional mass/volumetric flow. The well-established theories of molecule diffusion and mass/volumetric flow were fully adopted and coherently and concurrently used here for the integrated modeling approach presented in this article. According to general diffusion theory (5, 6), a flux of gas molecules through space (x, y, z) at time t follows the law of conservation and continuity for molecule flow:
 where C = the concentration change of the total gas molecule flow, F = the diffusion rate of gas molecule transfer, and E = the concentration change of gas molecule flow resulting from a chemical reaction, convection, mass/volumetric flow, or other causes.
Considering only molecule flow through a leak path in one direction, x, eq 1 becomes
According to Fick's first law of molecule diffusion:
 where Cd stands for the concentration change resulting from molecule diffusion. D is the nominal diffusion coefficient, typically chosen as 0.22 (cm2/s). The negative sign in eq 3 represents molecule diffusion from high concentration to low concentration. For molecule diffusion flow through a leak path with diameter d, the actual diffusion coefficient has a correlation with the diameter d as reported in a previous experiment (15), and it can be virtually correlated by 1/(51,000·d) as reported in a more recent experiment (16). In the present study, mass/volumetric flow are included in the concentration change E, and Ce = E is used for concentration change because of mass/volumetric flow through the leak path. Equation 2 thus becomes
 where
where  is the mathematical expression of Fick's second law for molecule diffusion. To clarify eq 4 in physical terms, the concentration change rate
  of the total molecule flow simply equals a coupled superposition of the diffusion concentration change rate
  and the concentration change rate
  because of mass/volumetric flow.
According to the ideal gas law,
 where P = the pressure of the total gas molecules, Pd = the partial pressure of gas molecules from diffusion, Pe = the partial pressure of gas molecules from mass/volumetric flow, N = the amount of total gas molecules, Nd = the amount of gas molecules from diffusion, Ne = the amount of gas molecules from mass/volumetric flow, V = the volume, R = the ideal gas constant (R = 287.058 m2/s2 K), and T = temperature (T = 295K was selected).
The mass/volumetric flow through a leak path can exhibit some complicated patterns. Flow patterns are determined by many factors, including leak path diameter, leak path length, fluid kinematic viscosity, flow velocity, and surface roughness and friction among others, such that it may lead to having ideal laminar flow, turbulent flow, or critical transition flow in-between. In practice, it is convenient to apply the Darcy–Weisbach equation (17, 18) of frictional flow through a leak path for any pattern of mass/volumetric flow, as follows:
 where
where  = the total pressure differential between the entrance and exit of the leak path,
  = the mass/volumetric flow pressure at the entrance of the leak path,
  = the mass/volumetric flow pressure at the exit of the leak path, d = the leak path diameter, L = the leak path length, ρavg = the average gas density, Vavg = the average velocity of mass/volumetric flow, and f = the friction factor. The friction factor f is to be determined through experiment (17, 18). The Darcy–Weisbach eq 7 is used both for incompressible and compressible flow applications by modifying the f factor with compensation of expansion (17, 18). Equation 7 is treated as having a quasi-steady flow at time t for every finite time period
  . For the sake of simplicity, f = 0.007 is used for our modeling study in this article.
For the average mass/volumetric flow velocity Vavg:
 where Qe is the volumetric flow rate. Per eq 5 of the ideal gas law,
 where
where  is the mass/volumetric flow pressure at the exit of the leak path into the vial container for the CCS application, which is equal to the partial pressure in the vial, and V is the vial volume. Here the average gas density ρavg is calculated as
Substituting eqs 8 and 9 into eq 7, it becomes:
The mass flow rate  is
is
Substituting eqs 9 and 10 into eq 11, it becomes
Substituting eq 12 into eq 6, it becomes:
Equation 13 is the governing equation and includes both diffusion and mass/volumetric flow through a leak path. It is to be solved numerically with defined initial and boundary conditions for a specific case. The finite difference method (19, 20) can be used for numerical solutions.
Results and Discussion
In parenteral packaging, most package types may display very low gas leakage through the gaps that exist even between well-fitted closures (2). However, a CCS package should not permit leakage beyond a drug product maximum allowable leakage limit (MALL) to maintain sterility. Many drug products are sensitive to oxygen, carbon dioxide, or moisture. For example, the drug stability may relate to a certain amount of oxygen even when the oxygen ingress is very slow, and this makes CCI testing more difficult and complicated, if not impossible. A modeling approach provides a quick calculation instead of a lengthy testing period when evaluating samples. That is, when investigating CCSs for defects, an early time point for testing results can be compared with the model results and the leak size and impact can be determined.
In the next sections, we show the modeling results for vial CCSs by numerically solving the previous equations together with applicable boundary conditions and compare the modeling results with previous testing work (15, 16). The previous work was based on headspace measurements to estimate the impact on the diffusion parameter. In relation to the results observed in the previous work, we have divided the conditions from a relatively simple diffusion-only to a complicated combination of diffusion and effusion into cases #1 through #4 to investigate different scenarios relevant for CCI studies of interest.
Case #1: Diffusion Only
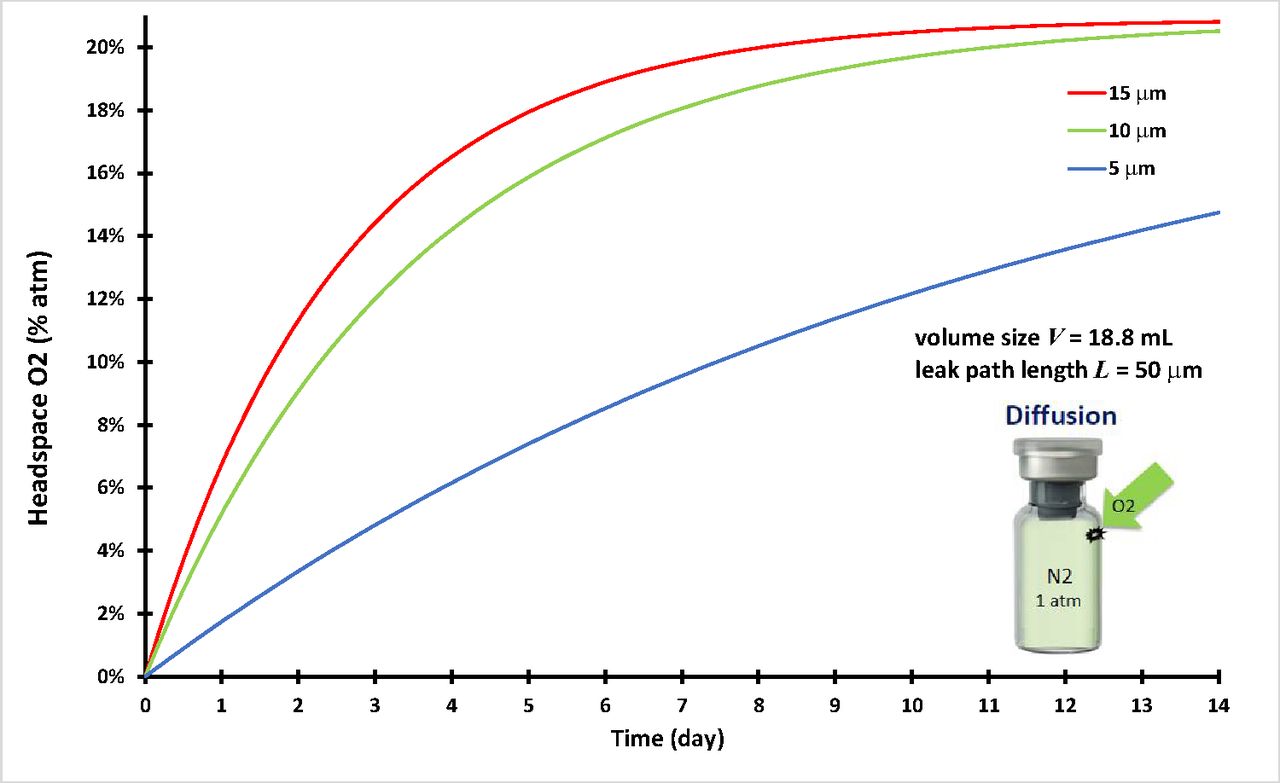
This case examined three vials, all the same volume (V = 18.8 mL) and leak path length (L = 50 µm), but with three different leak path diameters (d = 5 µm, 10 µm, and 15 µm, respectively). It was assumed that the three vials were filled with 100% nitrogen and stoppered/capped tightly. The vial image in Figure 1 is just for illustrative purpose. The nitrogen pressure inside of the vial is equal to the ambient air pressure at time zero. The time-dependent oxygen ingress into the three vials was calculated. There was no pressure differential to drive mass/volumetric flow through the leak path at any time t, and it leads to having

Headspace oxygen percentage of diffusion in an 18.8-mL vial.
The governing eq 13 is to be numerically solved for oxygen diffusion only, using initial and boundary conditions defined specifically for this case.
The initial condition at time zero t = 0 was as follows:
The boundary condition at x = 0 was as follows:
The boundary condition at x = L was as follows:
For the oxygen diffusion mass flow rate
 through the leak path with area
  at the exit (x = L),
This equation uses eq 3 of Fick's first law and eq 5 of the ideal gas law. At the exit of the leak path, Pd(t = t, x = L) is equal to the partial oxygen pressure in the vial with volume V. Using eq 5 to calculate the oxygen diffusion flow rate
 into the vial,
Combining the last two equations for the boundary condition at x = L,
The initial and boundary conditions are listed in Table I. The diffusion case study here entailed numerically solving the governing eq 13 for partial oxygen pressure Pd(t = t, x = L) inside the vials and satisfying all the conditions of eqs 14 through 18 by the finite difference method using SI units. Figure 1 shows the headspace oxygen percentage for the vial of V = 18.8 mL volume and leak path L = 50 µm. As mentioned previously, the nominal diffusion coefficient D correlates with the leak path diameter (15, 16). There were three different defect diameters of 5 µm, 10 µm, and 15 µm, and their correlated diffusion coefficients were 0.484 cm2/s, 0.376 cm2/s, and 0.255 cm2/s, respectively, close to what was previously reported (15). Figure 1 clearly shows that the larger the leak path diameter, the more the oxygen diffusion into the vials. The modeling calculation of time-dependent diffusion results in Figure 1 were similar to previously published testing results (15).
Initial and Boundary Conditions for Modeling Case Studies
Case #2: Effusion-in and Effusion-out
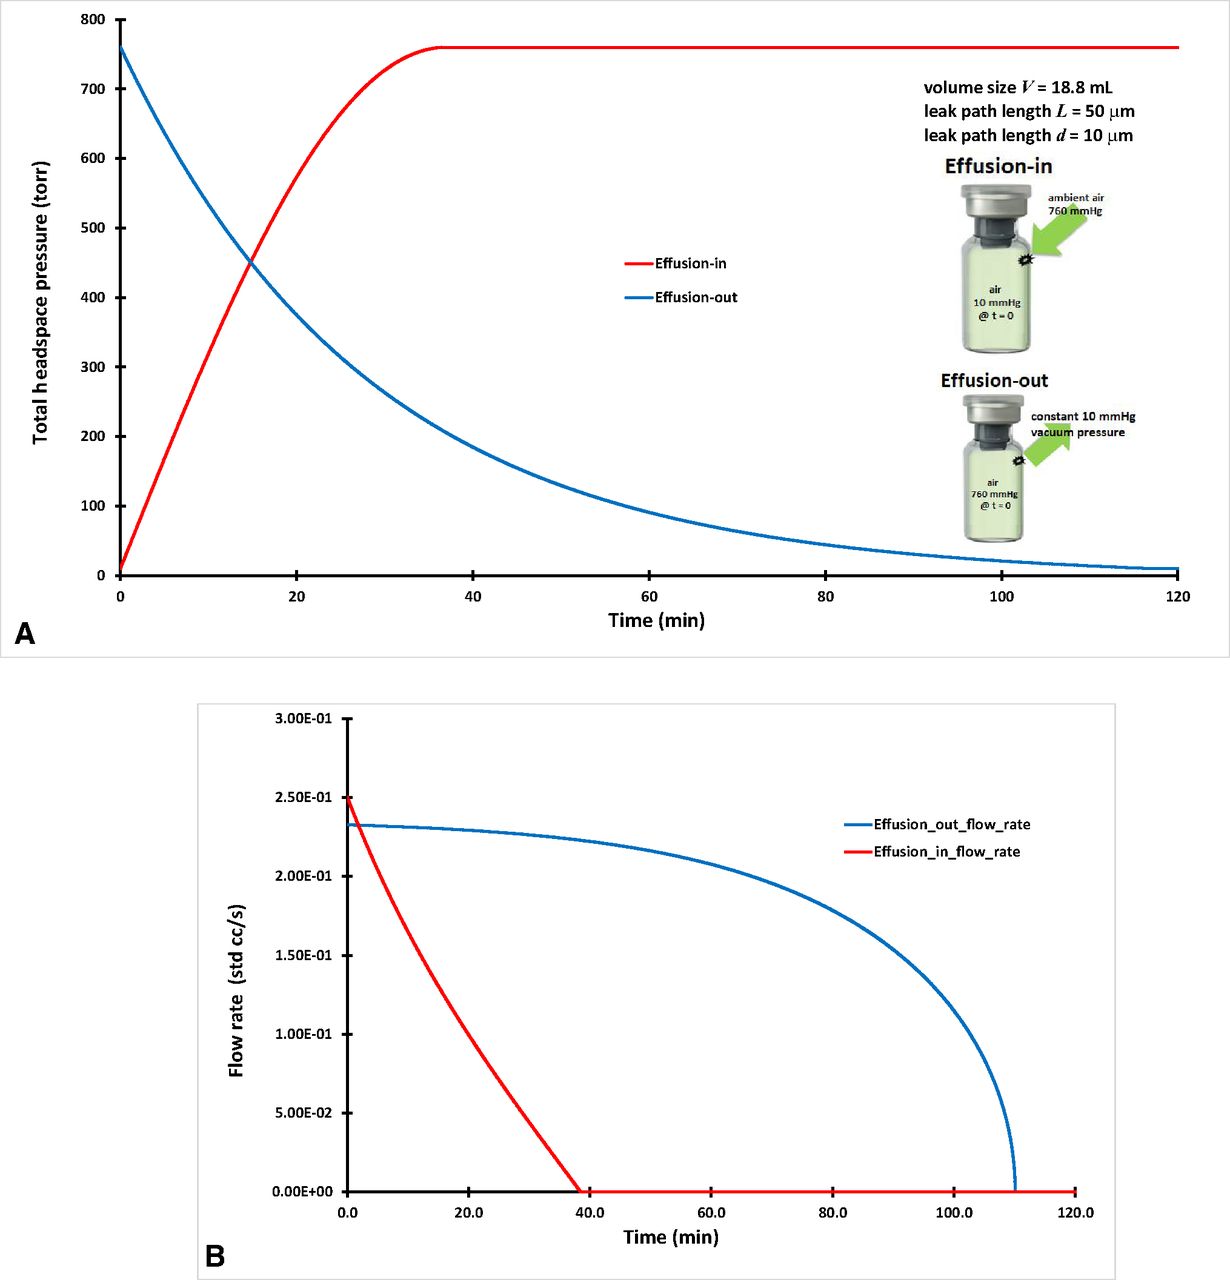
The term “effusion” is loosely used within the parenteral packaging industry, and it may describe a molecule flow summation of both diffusion and mass/volumetric flow. For the sake of modeling practice, a vial of V = 18.8 mL volume size with a leak path of L = 50 µm and d = 10 µm was used to calculate effusion-out and effusion-in. The same correlated diffusion coefficient 0.376 cm2/s for d = 10 µm from Case #1 was used here. It is assumed that the vial was stoppered and capped tightly first in ambient air pressure at 1 atm (760 Torr). This case has two scenarios for vacuum on both sides of the vial as reported previously (15). The modeling work here was to calculate the time-dependent total air pressure inside the vial for the following two sequential scenarios, effusion-out and effusion-in:
For effusion-out, a vacuum pump with constant 10 Torr vacuum pressure was used to evacuate the air from inside the vial through the leak path. The total air pressure inside the vial gradually decreased to 10 Torr total air pressure, achieving equilibrium with the constant vacuum pressure.
For effusion-in, the vacuum pump was removed, and the vial was in ambient air pressure at 760 Torr. The total air pressure inside the vial gradually rose from 10 Torr to the ambient air pressure (760 Torr).
For Effusion-out
The initial and boundary conditions for effusion-out are defined and listed in Table I. The total headspace air pressure P(t = t, x = L) inside the vial was solved numerically from the governing eq 13 along with the initial and boundary conditions. Effusion-out includes both diffusion and mass/volumetric flow. Figure 2A includes the calculated effusion-out headspace air pressure result for the vial, consisting of V = 18.8 mL, leak path L = 50 µm, and d = 10 µm. The modeling calculation of the effusion-out result in Figure 2A is similar to previously published testing results (15).

(A) Headspace air pressure of effusion-out and effusion-in of an 18.8-mL vial. (B) Volumetric flow rate (std cc/s) for effusion-out and effusion-in of an 18.8-mL vial.
For Effusion-in
The initial and boundary conditions for effusion-in are defined and listed in Table I. The effusion-in case of total headspace air pressure P(t = t, x = L) inside the vial was numerically solved from the governing eq 13 along with initial and boundary conditions. Effusion-in includes both diffusion and mass/volumetric flow. The modeling calculation of the effusion-in result in Figure 2A is similar to previously published testing results (15).
The volumetric flow rate (std cc/s) was calculated for effusion-out and effusion-in and is displayed in Figure 2B. The flow rate was zero once it reached zero pressure differential at steady equilibrium. Figure 2A, B clearly shows that effusion-in reached a steady equilibrium quicker than effusion-out did for the same vial sample. This is because molecular dynamics relates to statistical mechanics by using molecule numbers for its molecule movements (21). The air molecule supply from the vial for effusion-out was limited and much less than the almost unlimited air molecule supply from ambient for effusion-in, and it leads to quicker effusion-in than effusion-out.
Case #3: Effusion-in with Small Initial Total Pressure Differential at Time Zero
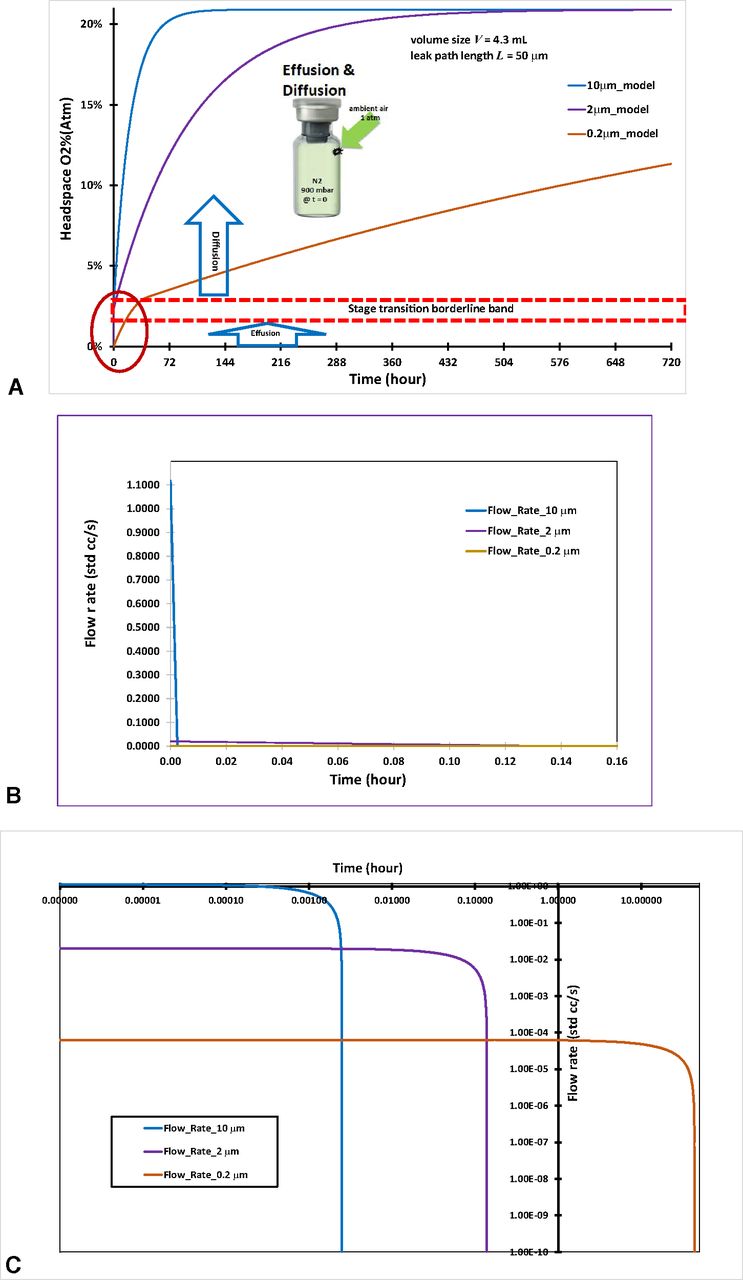
For this case, oxygen ingress into a vial through a leak path was calculated. Three vials had the same volume (V = 4.3 mL) and same leak path length (L = 50 µm) but three different leak path diameters (d = 10 µm, 2 µm, and 0.2 µm, respectively). Regarding sterility concerns, a leak size of 0.2 µm is reportedly the smallest size through which a microorganism can pass (7). For this case, it is assumed that after going through a lyophilization process, the three vials were filled with nitrogen gas and evacuated to end pressure Pe(0) = 900 mbar and then were stoppered and capped tightly. Then the vials were positioned in ambient air pressure for oxygen ingress, starting with 100 mbar total pressure differential (1000 mbar – 900 mbar = 100 mbar) at time zero. This was an effusion-in case that included both diffusion and mass/volumetric flow because of the total pressure differential at the beginning of the effusion. The nominal diffusion coefficient is virtually correlated with leak path diameter d respectively by 1/(51,000·d) (16).
The initial and boundary conditions for this case study are defined and listed in Table I. The headspace oxygen pressure in the vial was numerically solved from the governing eq 13 along with initial and boundary conditions. Figure 3A is the headspace oxygen percentage for the three different leak path diameters of 10 µm, 2 µm, and 0.2 µm.

(A) Headspace oxygen percentage for two-stage transition of effusion and diffusion of a 4.3-mL vial. (B) Volumetric flow rate (std cc/s) for the effusion stage of a 4.3-mL vial. (C) Volumetric flow rate (std cc/s) for the effusion stage of a 4.3-mL vial in logarithmic scale.
As shown in Figure 3A, Case #3 had two stages of effusion and diffusion, respectively, through a seamless transition in real time:
The first stage started with effusion-in and included both diffusion and mass/volumetric flow at time zero, with a total pressure differential of 100 mbar (that is between 1000 mbar ambient pressure and 900 mbar nitrogen pressure inside the vial). This effusion-in stage ended once the total pressure differential had fully dissipated and reached pressure equilibrium with no more mass/volumetric flow.
However, the inside of the vial is still oxygen deficient at the end of the first effusion-in stage because of the pre-occupancy of nitrogen. The second stage immediately and seamlessly started as oxygen diffusion continued into the vial without mass/volumetric flow, eventually reaching the headspace oxygen pressure of 20.9% atm and equilibrium with the oxygen percentage in ambient pressure.
Figure 3A shows the modeling calculation of headspace oxygen percentages in the vials, which was similar to the previously published testing results (16). The integrated modeling approach here accurately captured the stage transition points from the first effusion-in stage to the second diffusion stage, as is highlighted by the red circle area in Figure 3A. The oxygen percentage at the stage transition point differed from one leak path diameter to another. That is why it becomes a stage transition borderline band in Figure 3A depending on the leak path diameter. The total pressure equilibrium timing and its corresponding oxygen percentage depend on the defect diameter: about 8.9 s and 2.29% of oxygen (atm) for 10 µm diameter, about 8.3 min and 2.37% of oxygen (atm) for 2 µm diameter, and about 43.82 h and 3.07% of oxygen (atm) for 0.2 µm diameter, all corresponding to the stage transition borderline band in Figure 3A. It is clear that the bigger the leak diameter, the shorter the total pressure equilibrium timing with slightly lower oxygen percentage (atm) to reach the end of the first stage because of the predominance of quick mass/volumetric flow through the leak path with little oxygen diffusion taking place simultaneously in the first stage. For a smaller leak diameter, it takes a longer time to reach total pressure equilibrium with a slightly greater oxygen percentage (atm) at the end of the first stage because more oxygen diffusion occurs simultaneously in first stage. Modeling precisely calculates the impact of the size of a leak path on CCI performance.
Corresponding to the red circle area for the effusion phase in Figure 3A, the volumetric flow rate (std cc/s) for different leak diameters was precisely calculated by modeling as shown in Figure 3B: a) a flow rate of 1.1178 (std cc/s) at time zero for a 10 µm defect diameter drops very quickly to zero flow rate in 8.9 s; b) a 2 µm defect diameter has a low flow rate of 0.0200 (std cc/s) at time zero and slowly drops to zero flow rate in 8.3 min; and c) a 0.2 µm defect diameter has a very low flow rate of 6.3229E-05 (std cc/s) at time zero and very slowly drops to zero flow rate in 43.82 h. Figure 3B clearly demonstrates that the leak diameter will dictate how fast is the transition of the volumetric flow rate. The horizontal time axis is cutoff at 0.16 h to distinctively show all three curves in Figure 3B. If the time axis is cutoff at 43.82 h, the flow rate curve for the 10 µm defect diameter will be virtually lined up with the vertical axis whereas the other two flow rate curves (2 µm and 0.2 µm) will be virtually lined up with the horizontal axis. For a better overview of the data visualization, a common practice to present the engineering data graph is to use a logarithmic scale for better distinction of multiple data curves. Figure 3C contains the exact same data as Figure 3B but in logarithmic scale for both the vertical and the horizontal axes, which provides a better data distinction for the transition of the volumetric flow rate corresponding to different leak diameters. Figure 3B, C show that the time to reach zero flow rate at the end of the effusion-in stage differed considerably from large to small leak diameters.
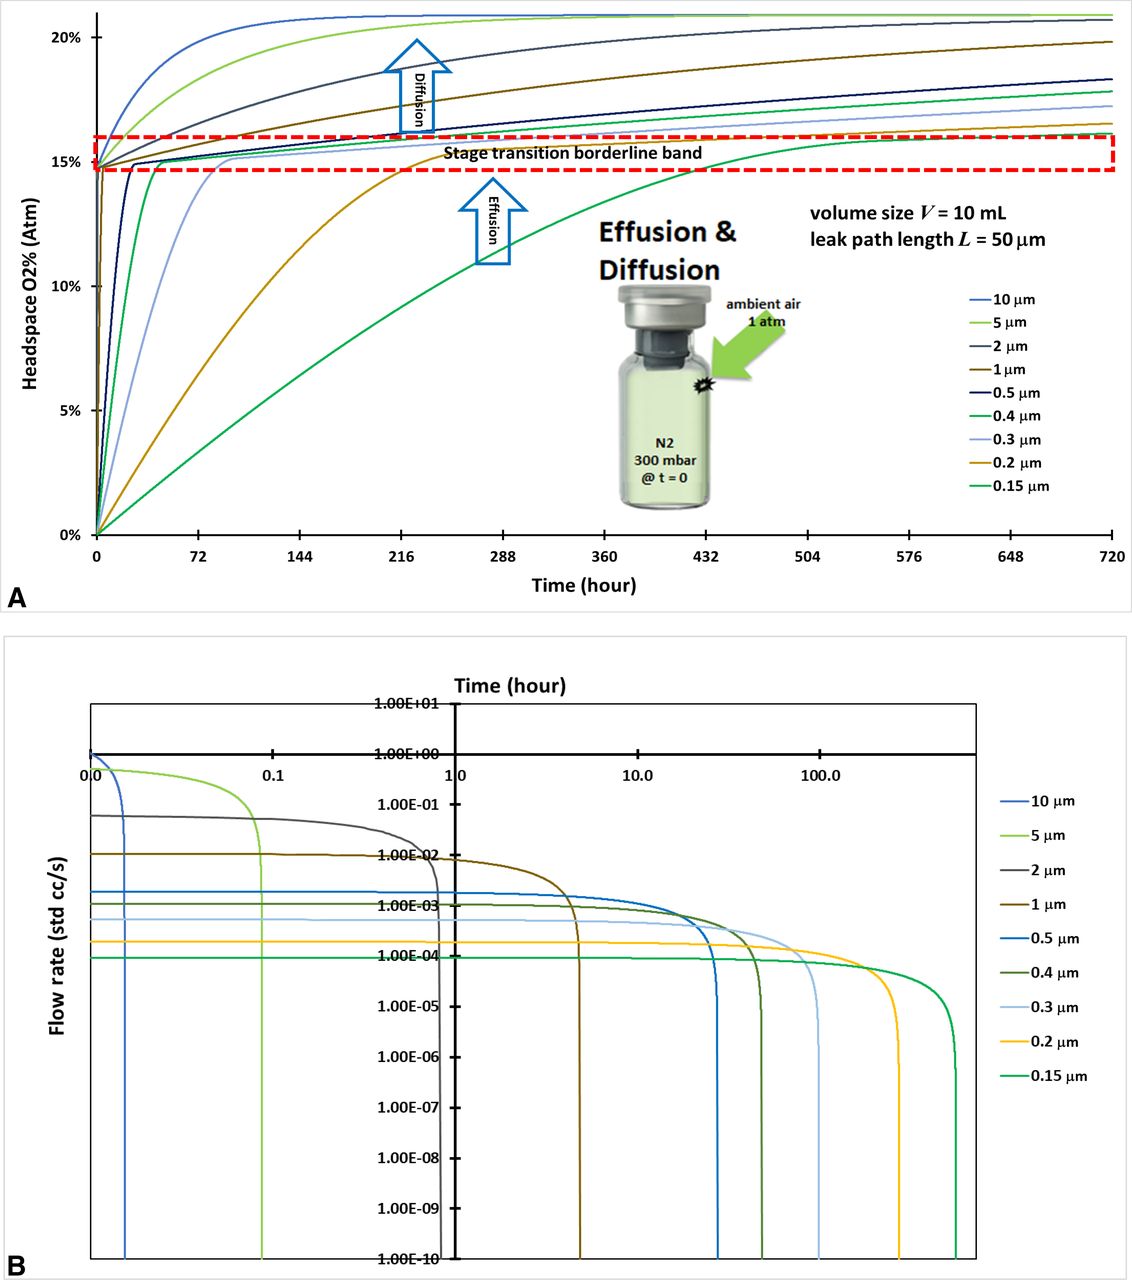
Case #4: Effusion-in with Large Initial Total Pressure Differential at Time Zero
This modeling case for calculating CCI performance assumed that 10-mL vials were filled with nitrogen and stoppered and capped tightly at Pe(0) = 300 mbar end vacuum pressure through the lyophilization process. The vials were then positioned in ambient air pressure and effusion-in started at time zero. The vials had a leak path of L = 50 µm but a series of different leak path diameters ranging from d = 0.15 µm to d = 10 µm. This effusion-in case was similar to Case #3 prior but with a higher total pressure differential at the beginning of the effusion. The initial and boundary conditions are defined and listed in Table I. The headspace oxygen pressure in the vial was numerically solved from the governing eq 13 along with the initial and boundary conditions. Figure 4A shows the modeling calculation of the headspace oxygen percentages and the resulting data spread of the different defect diameters. The stage transition points in Figure 4A are much more visibly pronounced, especially for larger leak path diameters, and this is because of the large initial total pressure differential at time zero. The large initial total pressure differential at time zero will lead to a quick effusion phase followed by a slow diffusion phase, and it makes the transition point more visible. The total pressure equilibrium timing to the end of the effusion-in stage for zero volumetric flow rate (0 std cc/s) was precisely calculated by the modeling shown in Figure 4B, which is in logarithmic scale for better data visualization to display the total pressure equilibrium timing. The timing of the transition point from effusion-in to diffusion clearly relates to the leak path diameter. The larger the diameter, the shorter the total pressure equilibrium timing to reach the end of the effusion-in stage. Modeling various leak path sizes is important as it will impact the leak rate for determining the CCI performance.

(A) Headspace oxygen percentage for two-stage transition of effusion and diffusion of a 10-mL vial. (B) Volumetric flow rate (std cc/s) for the effusion stage of a 10-mL vial in logarithmic scale.
Summary
This article presented a new theoretical integrated modeling approach that simultaneously includes diffusion and mass/volumetric flow for calculating CCI performance; practical case studies were also presented. The modeling approach is based on the law of conservation and continuity for molecule flow, Fick's law for diffusion, and the Darcy–Weisbach theory of frictional mass/volumetric flow. CCI is time-dependent. This modeling approach a) accounted for diffusion and effusion, in which it seamlessly combines diffusion and mass/volumetric flow simultaneously and b) was much more robust for real-world applications. This new integrated modeling approach was able to clearly reveal that CCSs filled with nitrogen through lyophilization may undergo a complicated leaking process of oxygen ingress through a leak path in a seamless two-phase transition, starting with effusion and continuously followed by diffusion. Our integrated modeling approach was able to calculate and capture the exact time of the phase transition point and handle this kind of complicated CCS leakage for real-world applications. The exact two-stage transition point depends on the leak path diameter. All the modeling results were numerically solved from governing equations along with initial and boundary conditions, which were defined for individual practical applications. The modeling results of our case studies were similar to previously published testing results (15, 16). This modeling approach demonstrated its capability and versatility in dealing with complicated leakage problems for practical applications.
For pharmaceutical, biological, cell, and gene therapies, a CCS must ensure not only drug sterility but also drug stability. CCI is a critical factor for maintaining product sterility and stability. The ingress of water and gases can drive microbial growth and chemical instability. Pharmaceutical products are expected to be free of microbial contamination and protected from gaseous ingress, such as by oxygen, carbon dioxide, or moisture, depending on the drug sensitivity and specific product requirements. Our modeling approach is a powerful tool for accurately calculating time-dependent CCI performance more quickly and efficiently, whereas the testing approach may be either technically impossible or too time-consuming. This new modeling approach can be used for evaluating leaks, gauging their leak sizes, determining whether the CCS will conform to product requirements, and making informed decisions accordingly. It may also provide a foundation for CCI testing method development and validation for CCI performance.
Extensive studies are currently underway for further modeling development together with experimental work for various applications.
Conflict of Interest Declaration
The author declares that he has no competing interests.
Acknowledgments
The author would like to thank Le Ho for data graph preparation and Dr. Allison Radwick for coordinating the internal review process of the manuscript. The author would like to thank the reviewers for the many constructive suggestions during the extensive peer review process.
- © PDA, Inc. 2021
References
In This Issue


Jump to section
Related Articles
Cited By...
- A Container Closure Integrity Test Method for Vials Stored at Cryogenic Conditions Using Headspace Oxygen Analysis
- Container Closure Integrity Test Method Development on Vials Stored at -80{degrees}C Using Headspace Carbon Dioxide Analysis
- A Multicompany Survey Study for Helium Leak Container Closure Integrity Test