
Abstract
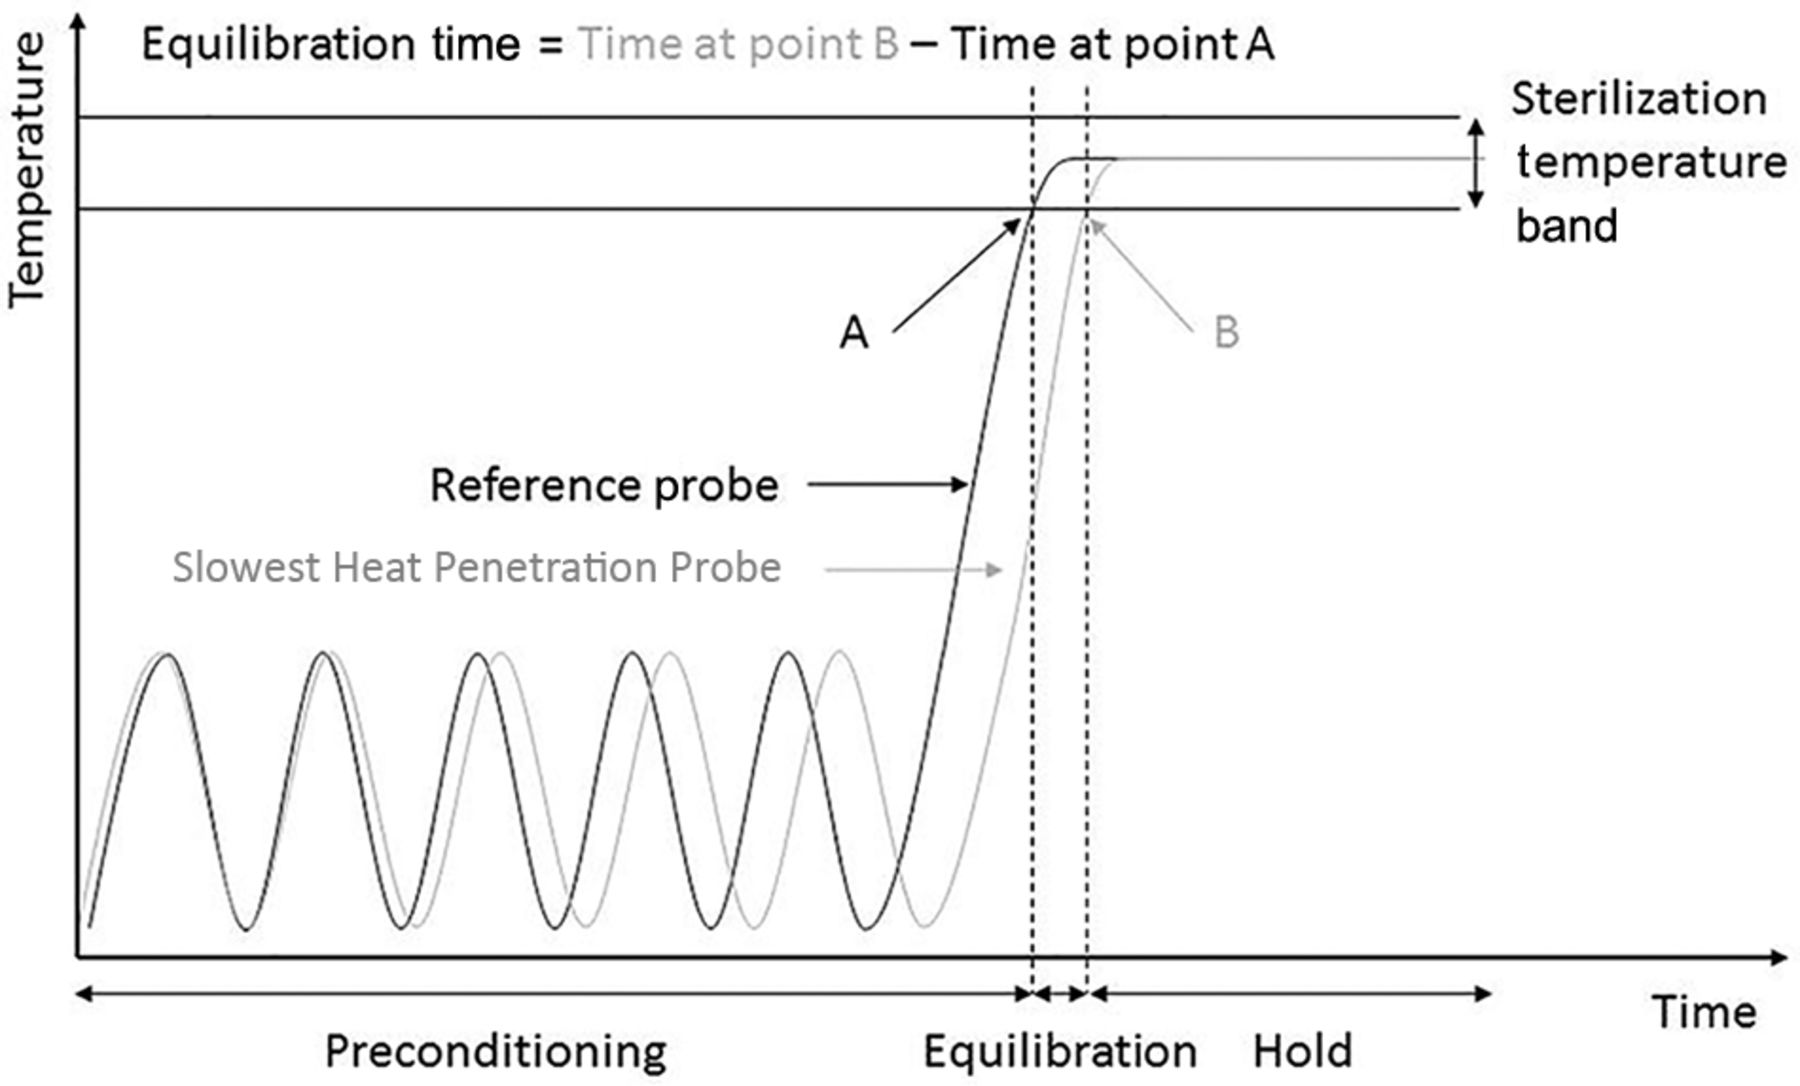
The equilibration time of an autoclave is defined as the period of time that elapses between the attainment of the sterilization temperature at the reference measurement point of the autoclave chamber and the attainment of the sterilization temperature at all measurement probes within the dry goods load placed within the autoclave during a sterilization cycle.
The equilibration time is an indicator of the ability of the autoclave to remove air from and to subsequently sterilize the dry goods load placed within the autoclave chamber. Therefore, the equilibration time is an indicator of the performance of an autoclave. Periodic measurements of the equilibration time and evaluation of the equilibration time data can assure continued performance of the autoclave.
For autoclaves that support biopharmaceutical manufacturing plants, the equilibration time is generally measured by placing heat penetration probes within the dry goods load items placed within the autoclave during a sterilization cycle. However, measurement of the equilibration time in this fashion yields results that are highly variable and difficult to replicate.
This paper presents a study that attempts to understand the impact of the following autoclave variables on the consistent measurement of the equilibration time and on the reduction of the equilibration time: type of dry goods load item placed inside the autoclave, location of the heat penetration probe placed within the dry goods load item, location of the dry goods load item inside the autoclave chamber, orientation of the dry goods load item inside the autoclave chamber, number of coils of the tubing elements of a dry goods load item, total thermal mass of the dry goods load items placed inside the autoclave, temperature of the dry goods load items at the start of the sterilization cycle, presence of residual moisture in the dry goods load items at the start of the sterilization cycle, number of steam and vacuum pulses used for preconditioning in the autoclave recipe, depth of the steam and vacuum pulses used for preconditioning in the autoclave recipe, and hold time of the steam and vacuum pulses used for preconditioning in the autoclave recipe.
The focus of this paper is on tests performed to evaluate these variables followed by analysis and interpretation of the test data to identify key variables that have the highest impact on the measurement of the equilibration time. The conclusion of this paper presents a process to achieve shorter equilibration times in autoclaves through control of the key variables identified.
LAY ABSTRACT: The equilibration time is an indicator of the performance of an autoclave. Periodic measurements of the equilibration time and evaluation of the equilibration time data of an autoclave can assure continued performance of said autoclave.
This paper presents a study performed to develop a general guideline for consistent measurement of the equilibration time of an autoclave through identification and control of key sources of variability that impact the measurement. The focus of this paper is the testing and data analysis performed to identify these key sources of variability observed in a typical autoclave load sterilized through a typical autoclave cycle in a biopharmaceutical manufacturing plant. The conclusion of this paper presents a process to achieve shorter equilibration times in autoclaves through control of the key variables identified.
Introduction
The equilibration time of an autoclave is defined as the period of time that elapses between the attainment of the minimum specified sterilizing temperature (Point A in Figure 1) at the reference temperature probe (that is, the thermocouple [TC] placed in the autoclave drain next to the autoclave's resistance temperature detector [RTD]) of the autoclave and attainment of that same temperature (Point B in Figure 1) at the temperature probe located in the dry goods load item (that is, TCs placed in the dry goods load item; refer to Figure 1).

Equilibration time.
Measurements of the equilibration time of autoclaves used in biopharmaceutical manufacturing plants usually follow one of the following two strategies:
Strategy 1: Measure the equilibration time of an autoclave by placing TCs inside a standard test pack, in line with the guidance in BS EN 285:2015 (EN 285) (1). These tests are referred to as small-load and full-load thermometric tests in EN 285.
Strategy 2: Measure the equilibration time of an autoclave by placing TCs directly inside the slowest-to-heat dry goods load items of an autoclave, in line with the guidance in Parenteral Drug Association (PDA) Technical Reports 1 (2) and 48 (3).
All testing performed in this study followed Strategy 2.
In this case, slowest-to-heat dry goods load items are considered to be worst-case dry goods items as it is difficult to remove air from and then subsequently heat these dry goods items to sterilization temperatures through effective penetration of steam. Thus, worst-case approaches for equilibration time measurements usually involve the use of the slowest-to-heat dry goods items. However, measurement of the equilibration time using this approach generally yields results that are highly variable and difficult to replicate.
This study is divided into two phases. Phase 1 of the study identifies and characterizes the impact of different recipe-independent variables (that is, variables not associated with the autoclave recipe itself) on consistent measurement of the equilibration time. This phase of testing is executed using a constant autoclave recipe with variable values of recipe-independent variables. Variables 1 to 8 mentioned in Materials and Methods are assessed in Phase 1.
Phase 2 of this study identifies and characterizes the impact of different recipe-dependent variables (that is, variables associated with the autoclave recipe itself) on the consistent measurement and the reduction of the equilibration time. Recipe-independent variables identified as critical during Phase 1 testing are kept constant during Phase 2 testing. Thus, this phase of testing is executed using constant values for recipe-independent variables with variable autoclave recipes. Variables 9 to 11 mentioned in Materials and Methods are assessed in Phase 2.
Materials and Methods
Test Equipment
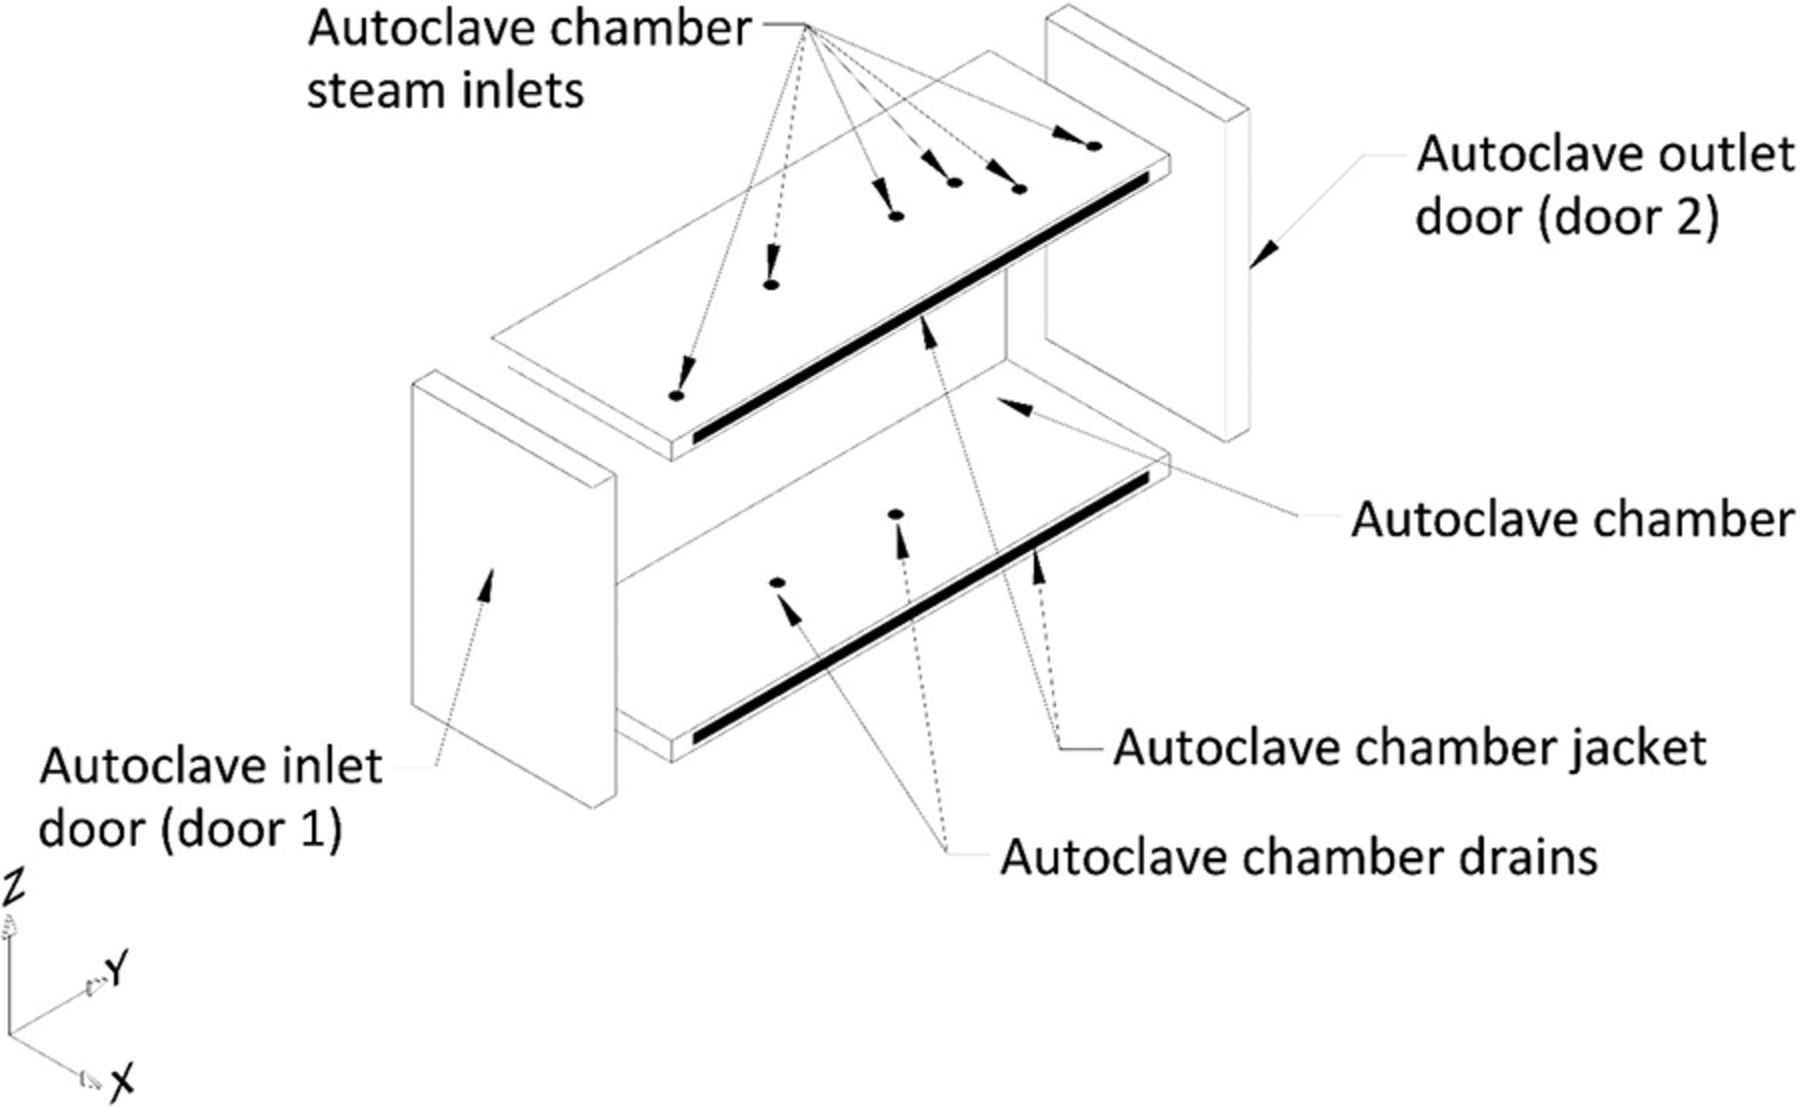
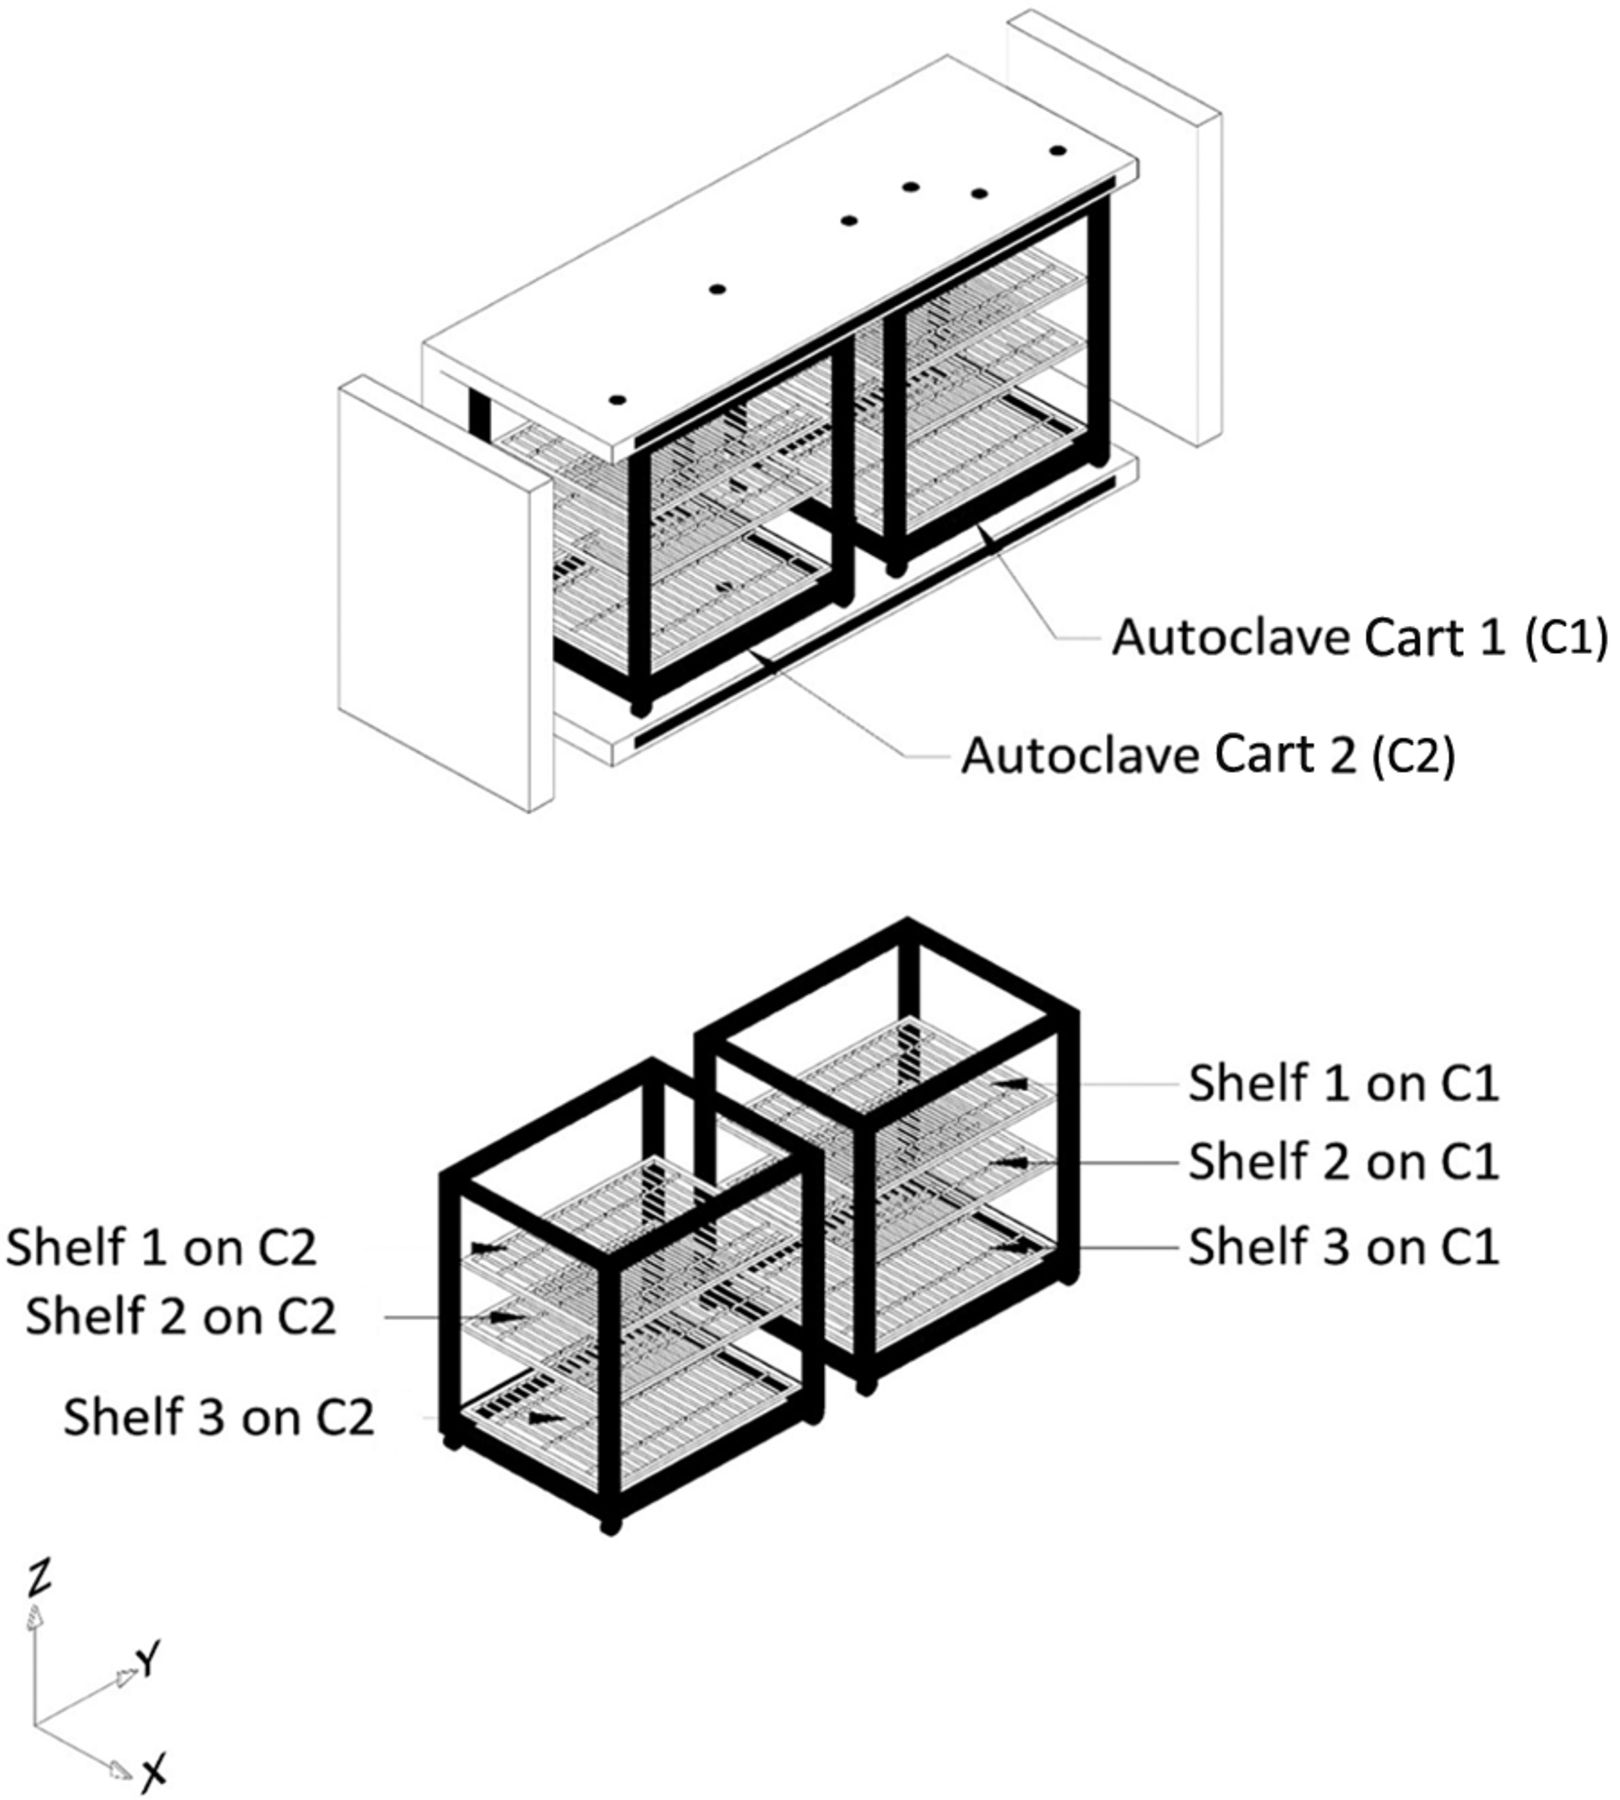
All tests for Phase 1 of this study were performed on a Finn-Aqua autoclave, model 121,225-D (STERIS Corporation, Mentor, OH). This autoclave has a double-door design and a chamber volume of ∼3600 L. This autoclave can accommodate two carts, Cart 1 and Cart 2 (henceforth referred to as C1 and C2, respectively). Each of these carts was equipped with three removable shelves, Shelf 1, Shelf 2, and Shelf 3. All test items were loaded in the autoclave by placing them on the shelves of C1 and C2. The layout of the empty autoclave chamber is depicted in Figure 2, the carts and the shelves that go inside the empty autoclave chamber are depicted in Figure 3.

Depiction of the empty autoclave chamber.

Depiction of the autoclave chamber with carts and shelves.
All tests for Phase 2 of this study were performed on a Steris Finn-Aqua sterilizer, model 91,212-N-DP-C-BPS-AB (STERIS Corporation, Mentor, OH). This autoclave has a double-door design and a chamber volume of ∼1200 L. This autoclave can accommodate one cart with one shelf. All test items were loaded in the autoclave by placing them on this one shelf.
All temperature measurements in both Phase 1 and Phase 2 tests were performed by placing type “T” TCs in the dry goods load items. All TCs were calibrated to have ±0.5°C accuracy. All temperature data were logged by using a Kaye Validator 2000 data logger (Amphenol Advanced Sensors Germany GmbH, Pforzheim, Germany).
All data in both Phase 1 and Phase 2 tests were analyzed and plotted using R (version 3.4.3)(R Foundation for Statistical Computing, Vienna, Austria).
Test Items Selection
The criteria used for selection of test items were designed to ensure that the items selected for testing would pose a greater challenge for steam and heat penetration and in turn would be difficult to equilibrate.
Criterion 1: Heat-up rate of an item, as items with slower heat-up rates are expected to provide a greater challenge to equilibrate to sterilization temperatures. Items with the slowest heat-up rates measured in historical tests were selected.
Criterion 2: Geometrical complexity, as items with higher geometrical complexity such as items with tubing elements having multiple branches were expected to pose a greater challenge to steam and heat penetration. Items with the highest geometrical complexity were selected.
Criterion 3: Insulation within the components of items, as items with higher insulation such as filter elements with their multiple layers of filter membranes were expected to provide a higher resistance to steam and heat penetration. Items with the highest insulation were selected.
Criterion 4: Empty volume of the item, as items with higher empty volumes contain higher volumes of air that provide extra insulation to steam and heat penetration and so they were expected to pose a greater challenge to steam and heat penetration. Items with the highest empty volume were selected.
Test items that fit all of the four criteria mentioned above were selected for testing.
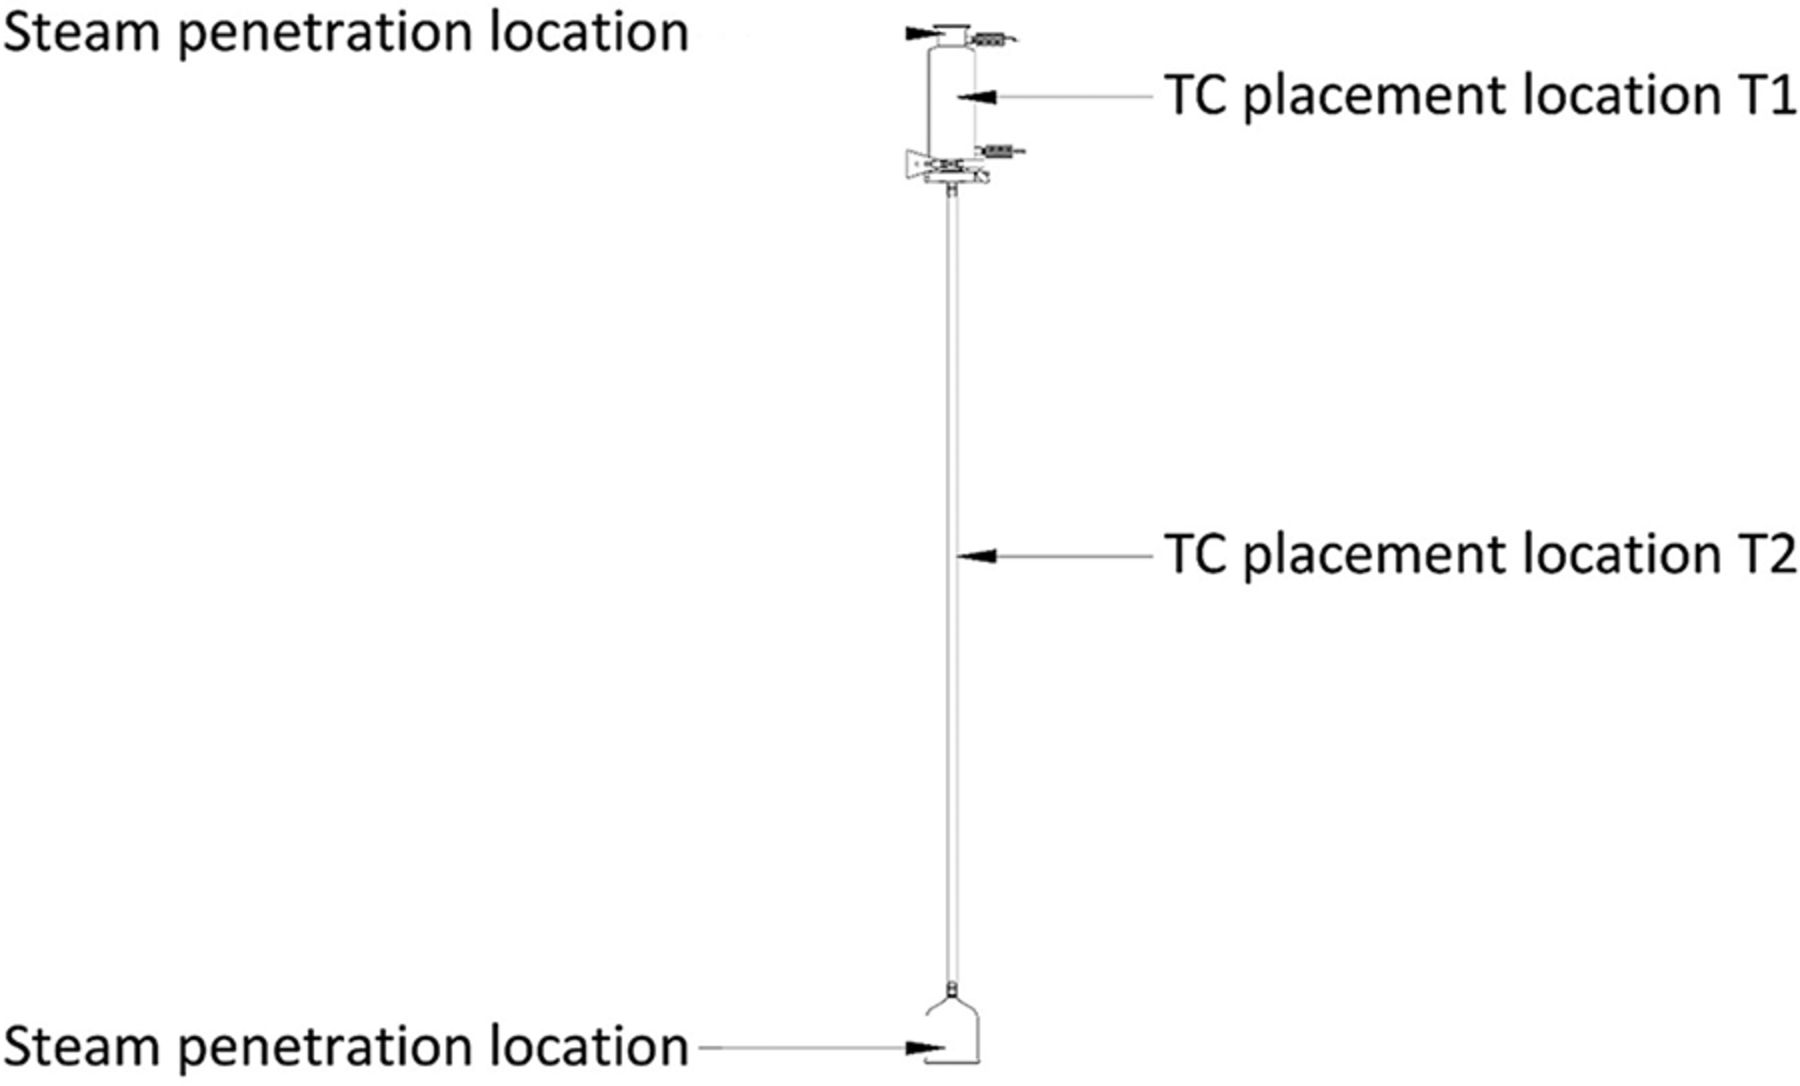
Item 1: 0.1 µ/2.6 ft2 filter in a stainless-steel housing attached to a 6 ft in length silicone tubing and a glass bell. This item fit Criteria 1 and 2 (refer to Figure 4).
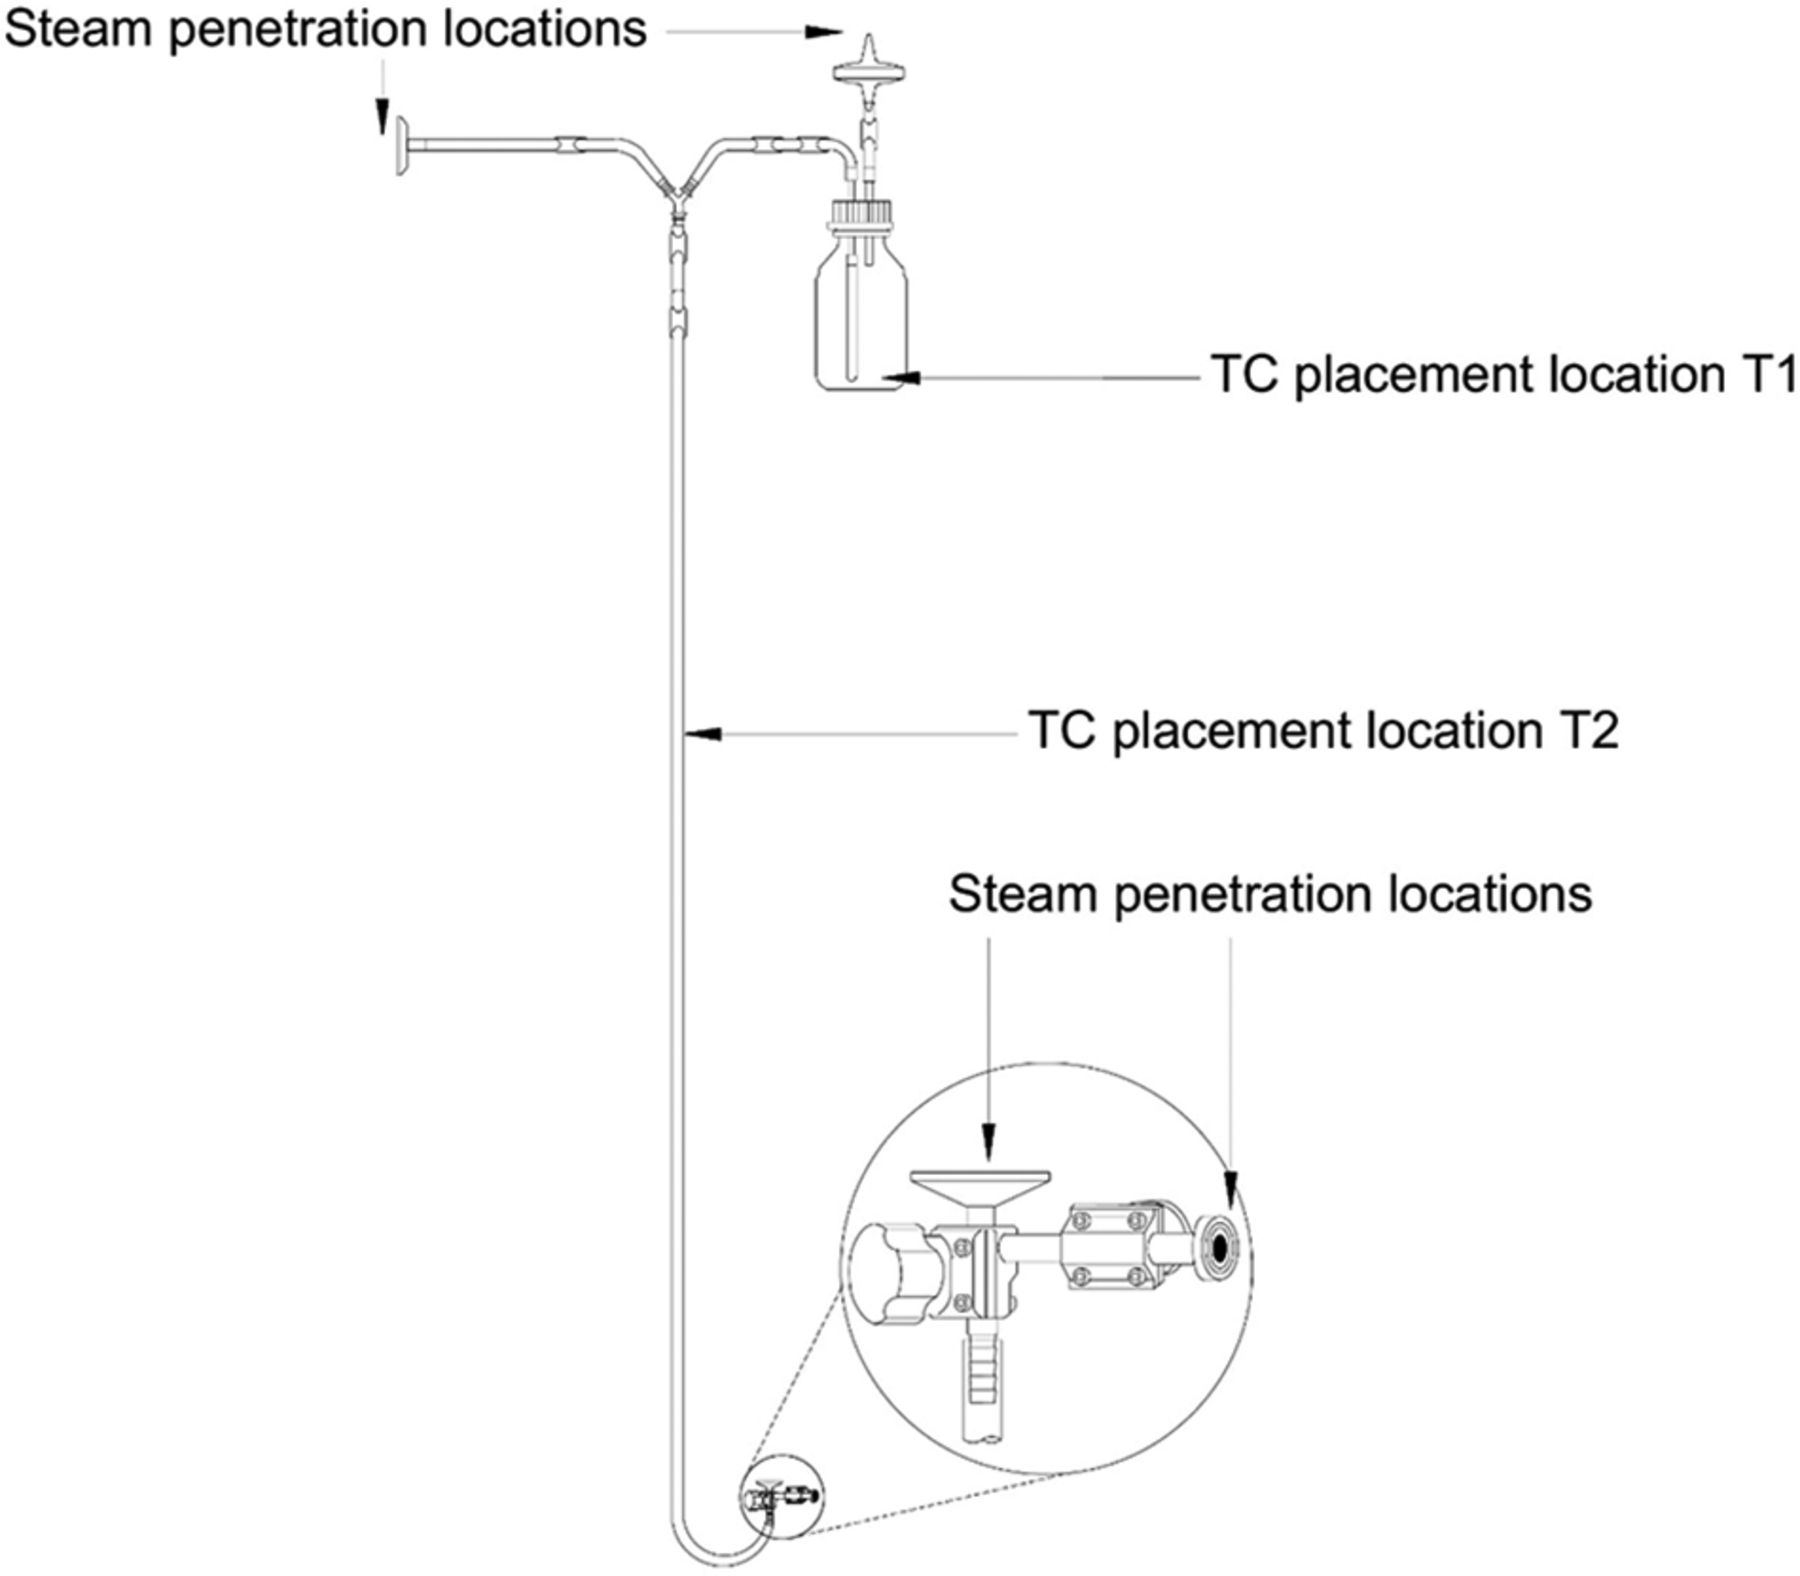
Item 2: 9 ft in length silicone tubing assembly with a “Y” connector, 250 mL glass sample bottle, and a diaphragm valve. This item fit Criterion 2 (refer to Figure 5).
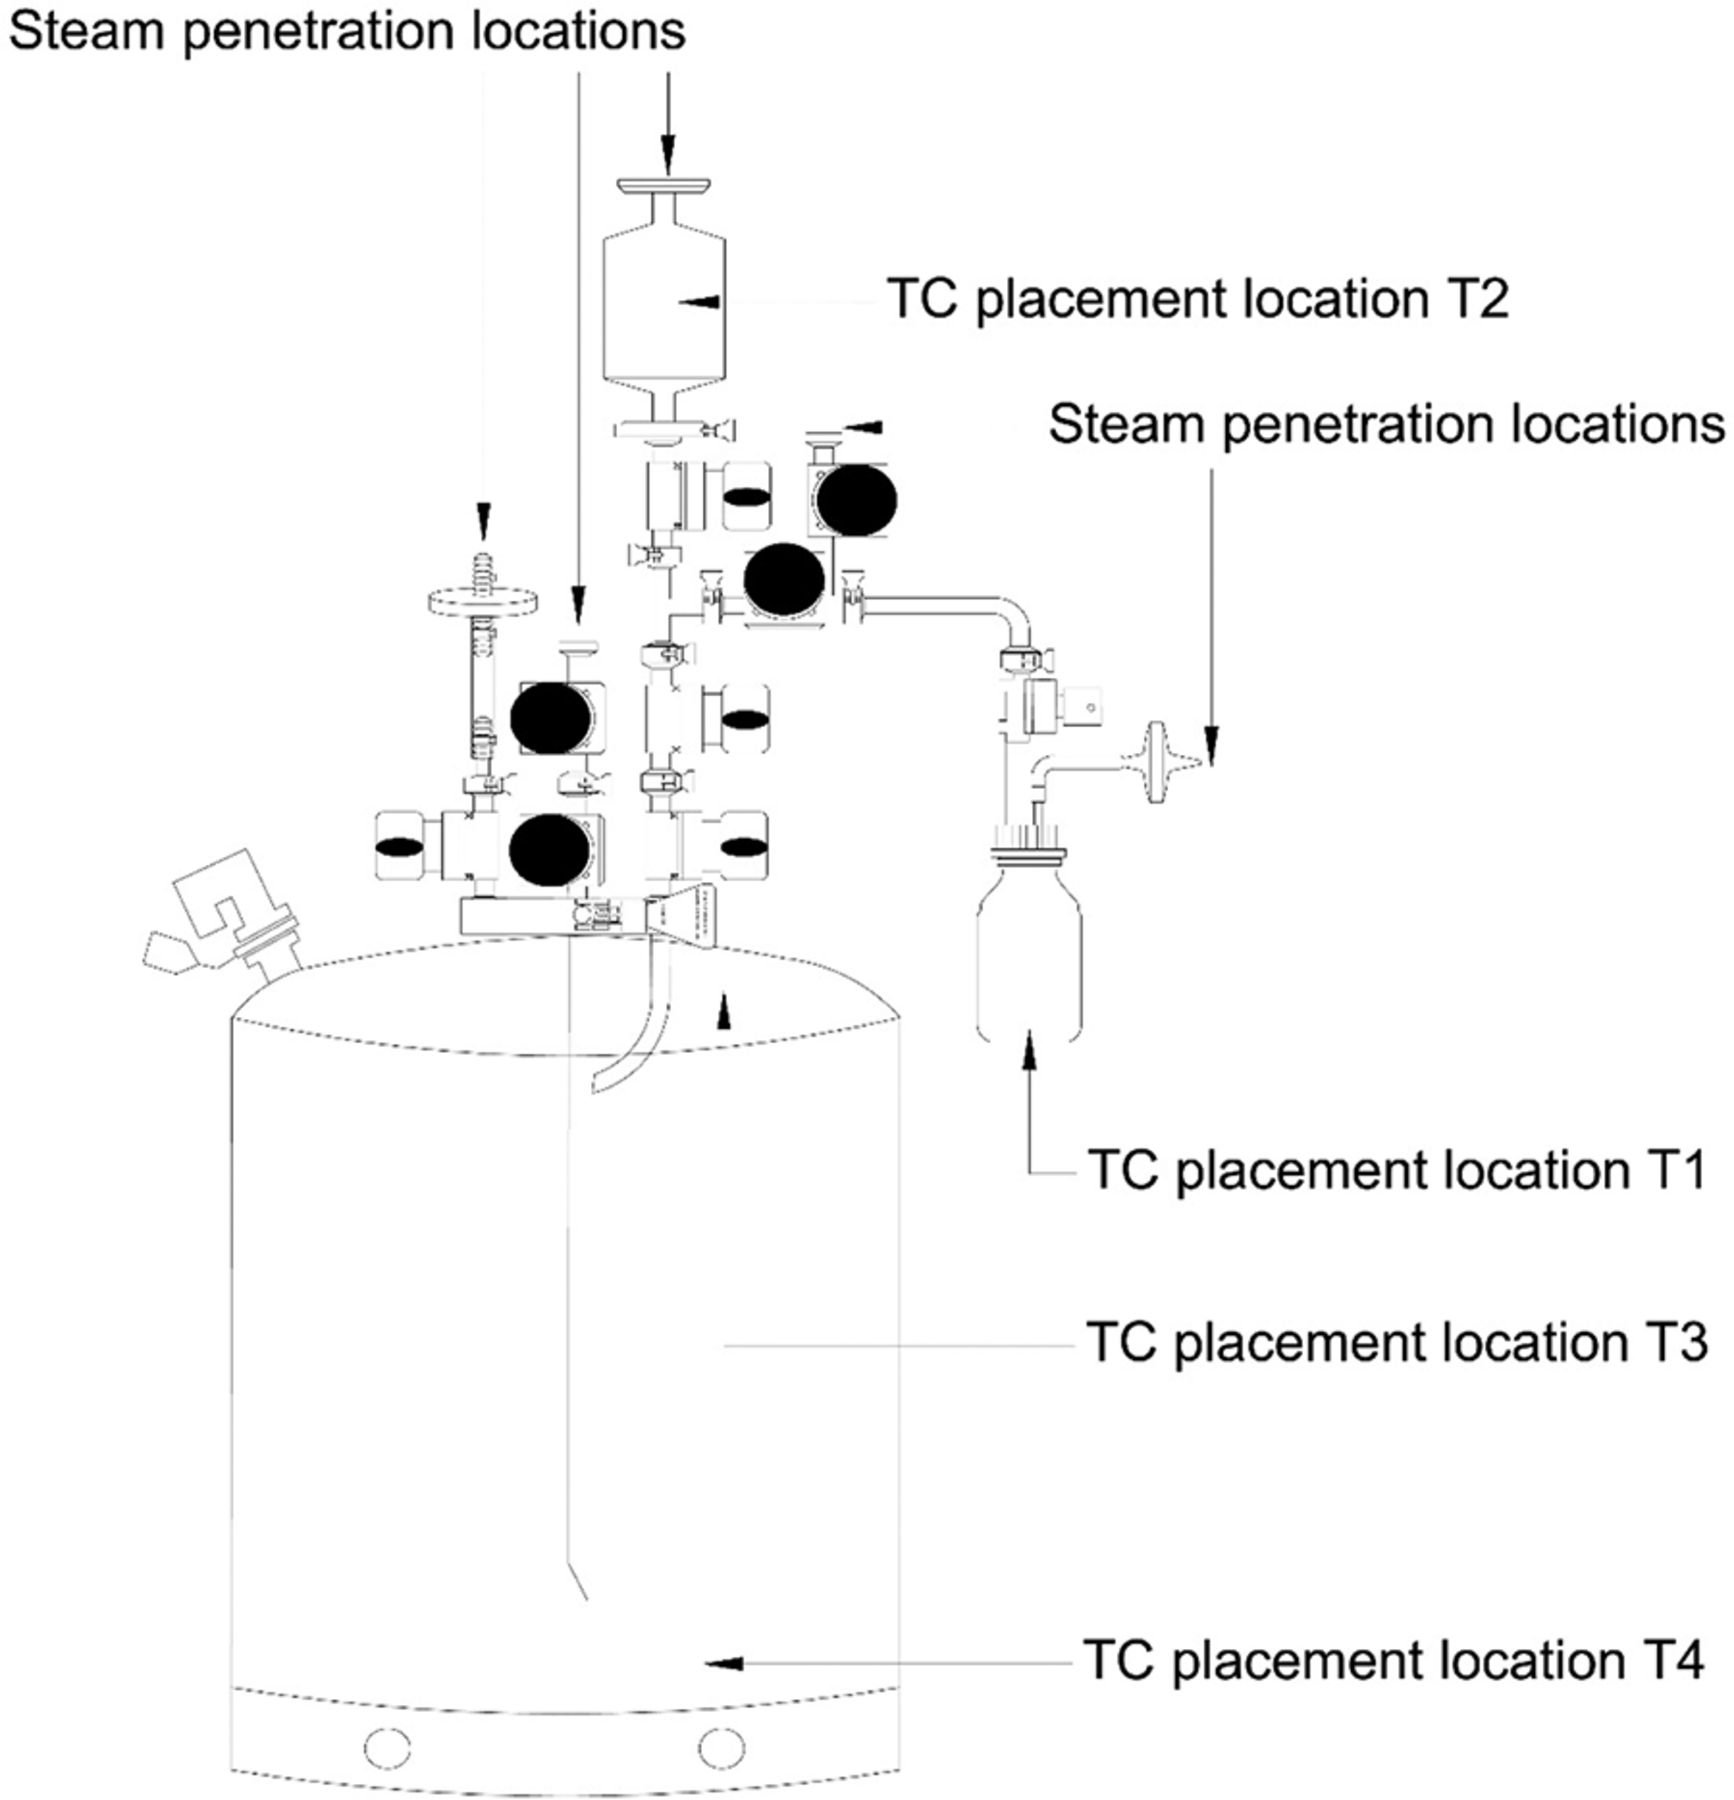
Item 3: 35 L Hastelloy can with 8 diaphragm valves, a 0.22 µ/1000 cm2 filter, and a 250 mL glass sample bottle. This item fit Criteria 2, 3, and 4 (refer to Figure 6).

Item 1.

Item 2.

Item 3.
Test Items' Preparation
Test items were probed with TCs in multiple locations to measure the equilibration times. TCs were placed such that the tips of the TCs did not contact the surfaces of the items and were oriented to avoid condensate accumulation. Additionally, care was taken to ensure that the TCs did not inhibit the flow of steam inside the test items. Refer to Figures 4, 5, and 6 for TC placement locations used during testing for Items 1, 2, and 3, respectively.
Test Variables
The impact of the following recipe-independent variables was studied.
Variable 1: Type of dry goods load item placed inside the autoclave
The type and geometry of a dry goods load item was expected to impact the steam and heat penetration profiles and in turn the different equilibration times. Hence, the impact of dry goods load items of different types and geometries was studied during testing.
Three different dry goods load items, Items 1, 2, and 3, were tested to understand the impact of this variable. Refer to Figures 4, 5, and 6 for details.
Variable 2: Location of the TC placed within the dry goods load item.
Different locations within a dry goods load item were expected to have different steam and heat penetration profiles and in turn different equilibration times. Hence, the impact of the location of the TC placed within the dry goods load item was studied during testing.
TCs were placed in multiple locations within each dry goods item (refer to Figures 4, 5, and 6 in conjunction with Table I for details of the TC placement locations). Each TC placement location was selected by taking into account the following:
Proximity of the TC placement location to the steam penetration locations. TCs placed closer to the steam penetration locations were expected to have easier access to steam than TCs placed further away from the steam penetration locations.
Potential resistance to steam and heat penetration at TC placement locations because of the geometry and/or material of construction. TCs placed in filter elements of an item were expected to encounter greater resistance toward steam and heat penetration through the filter membrane than TCs placed elsewhere in the item.
Variable 3: Location of the dry goods load item inside the autoclave chamber.
The location where a dry goods load item was placed inside the autoclave was expected to have an impact on its equilibration time. Hence, the impact of the location of the dry goods load item inside the autoclave chamber was studied during testing.
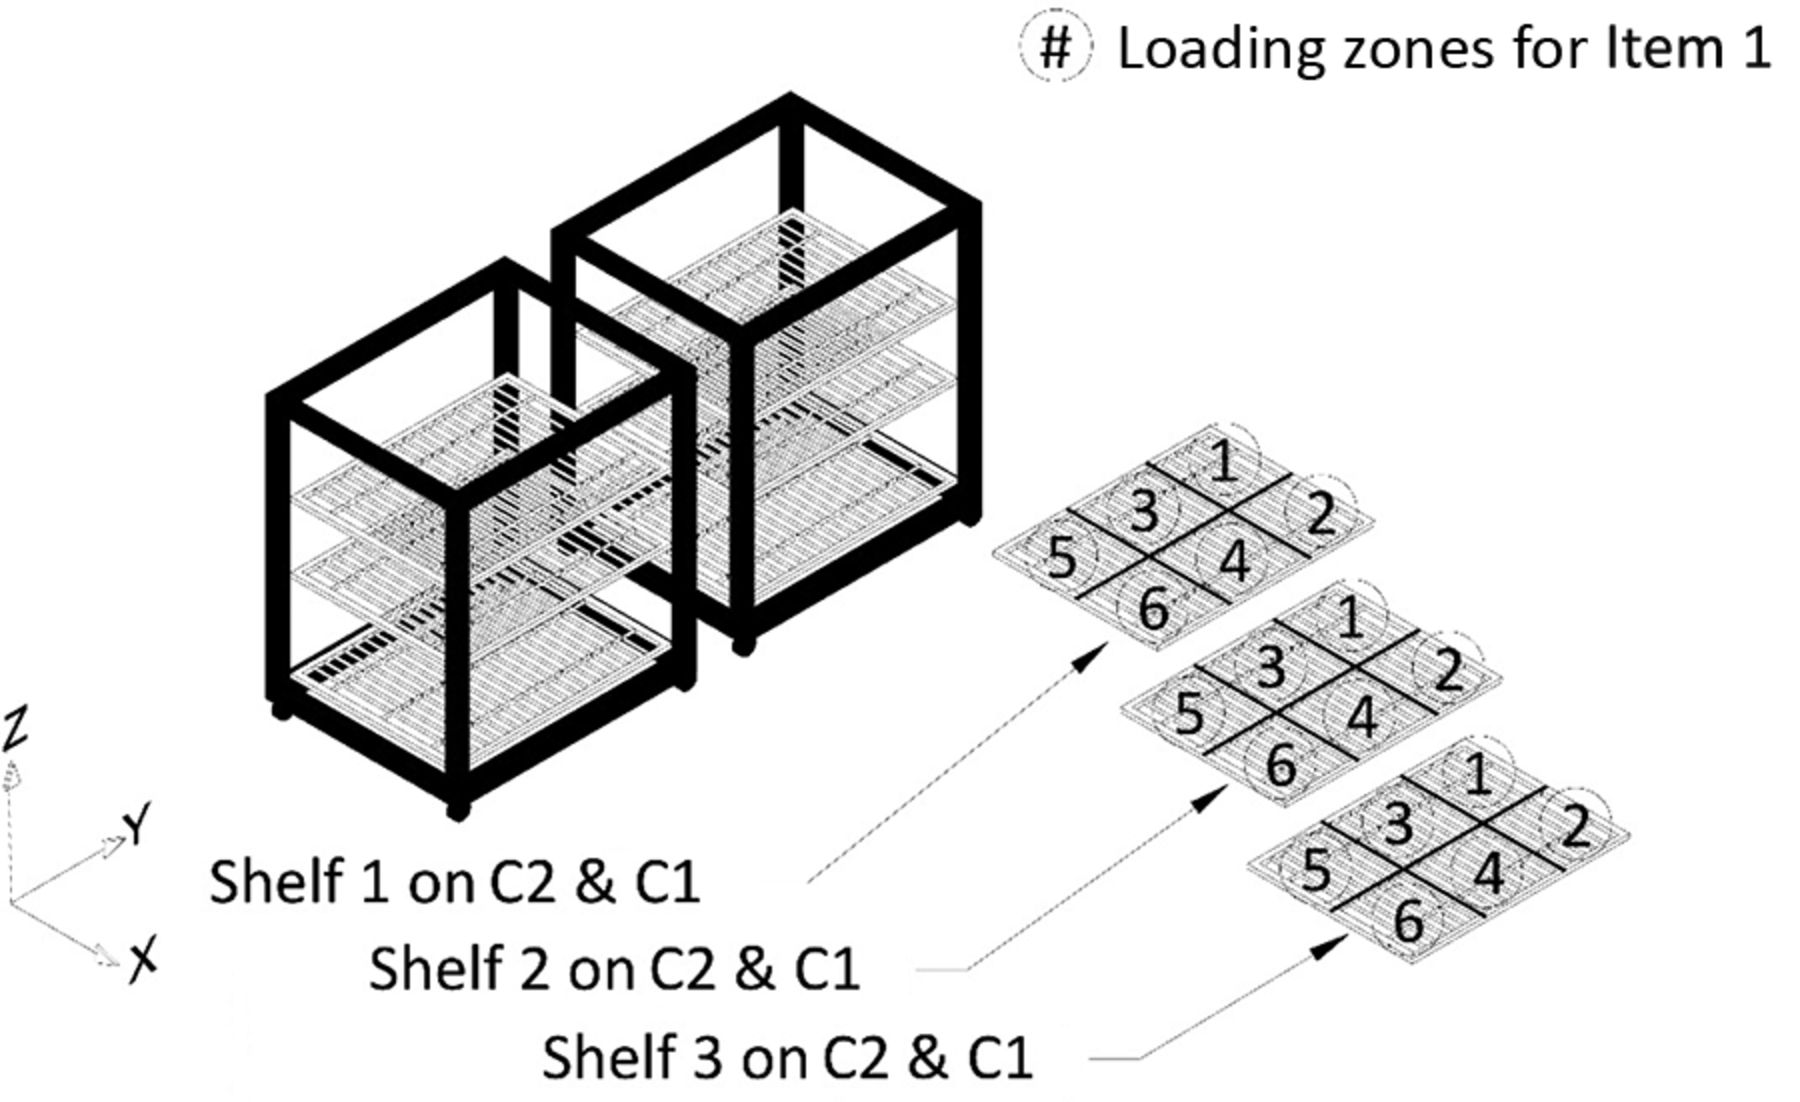
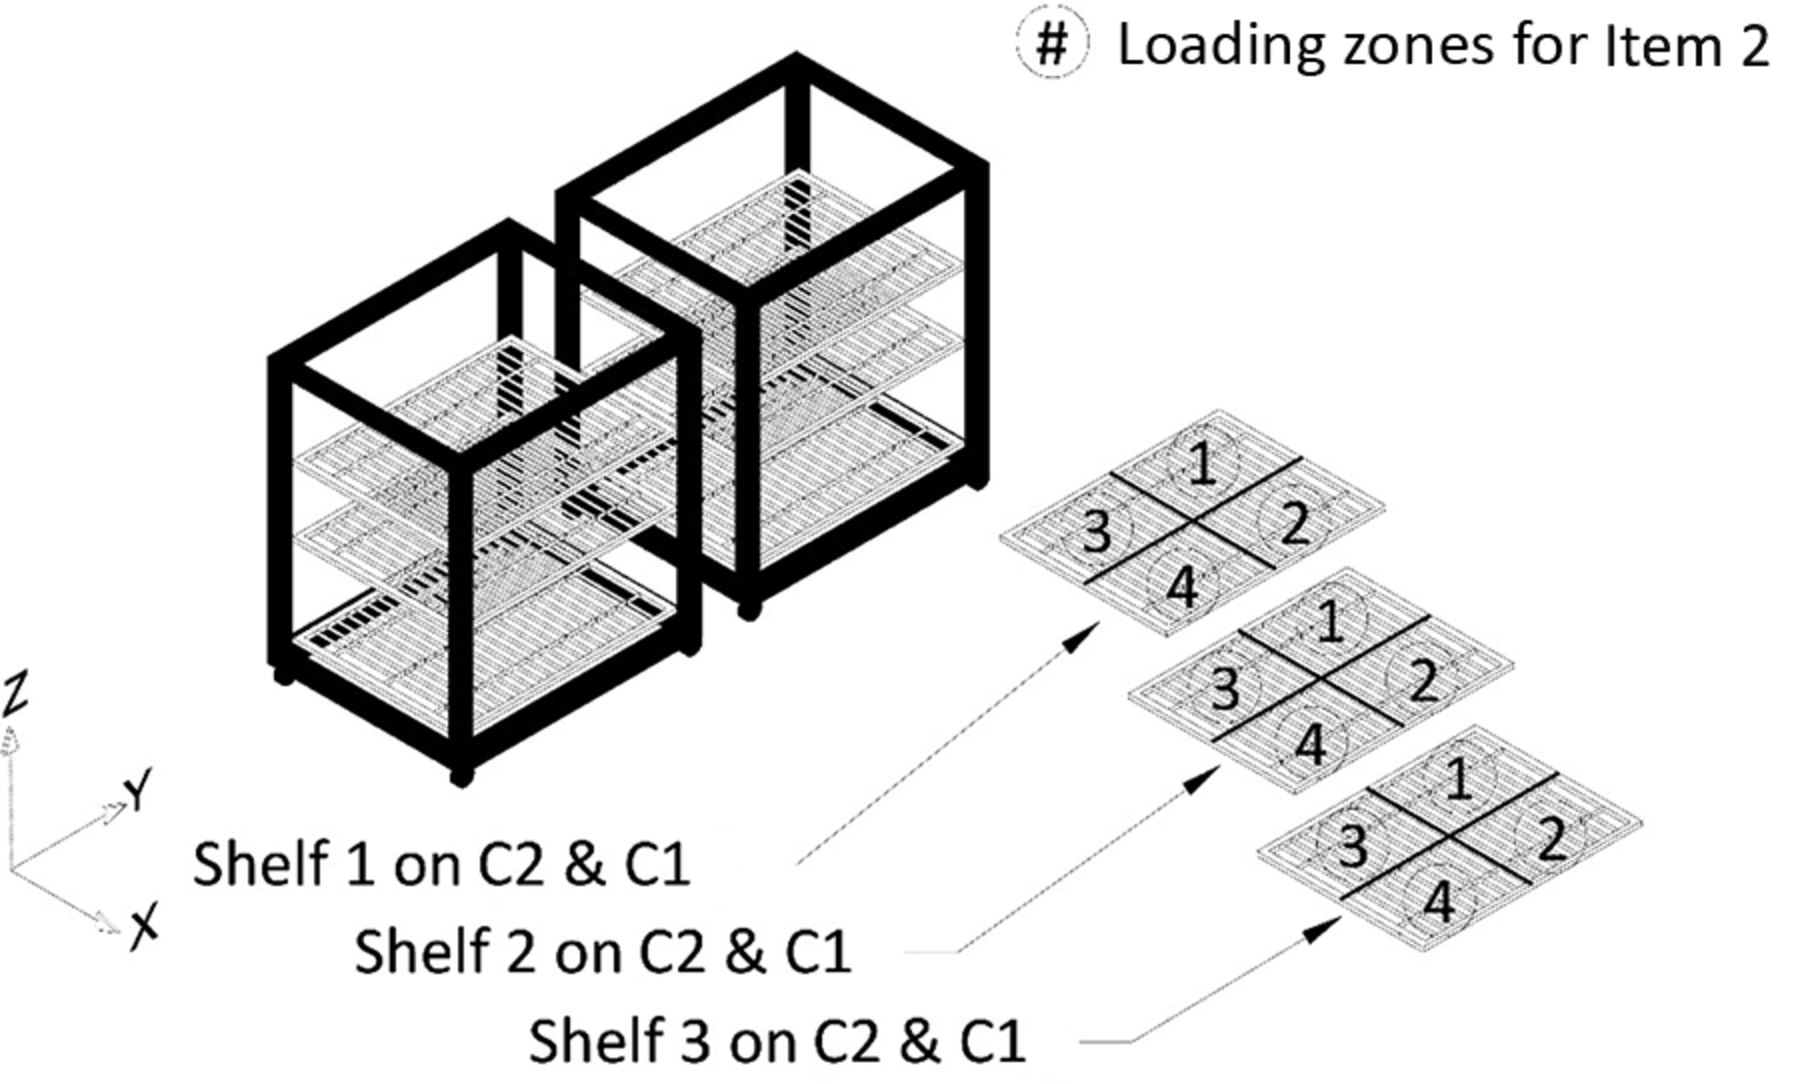
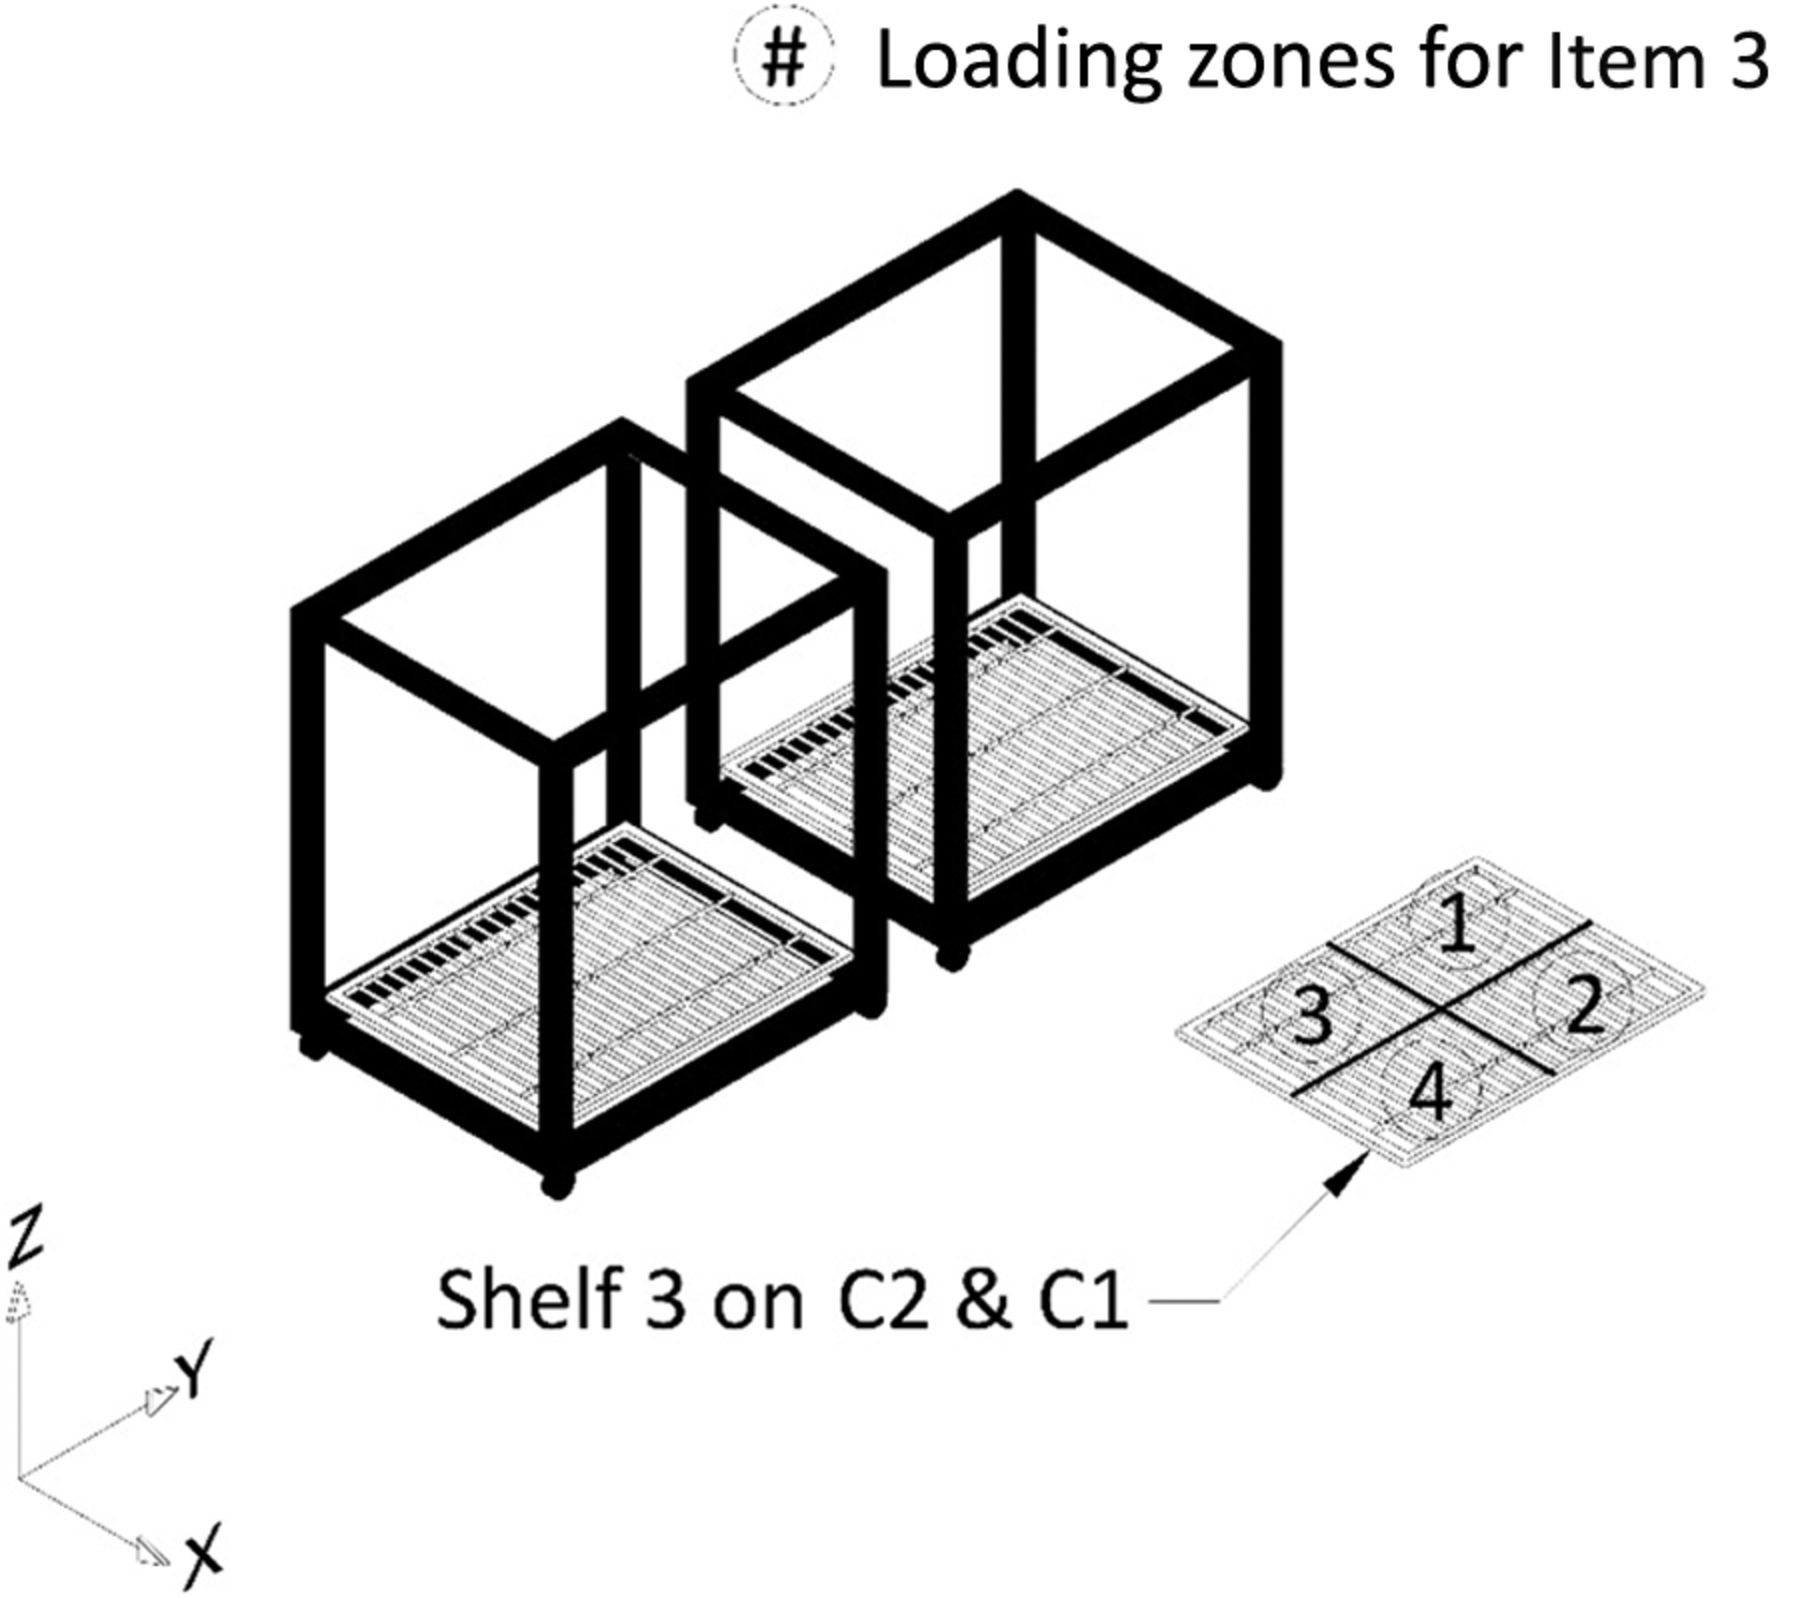
All potential item loading locations within the autoclave chamber, that is, Shelves 1, 2, and 3 of C1 and C2, were divided into multiple loading zones. For testing of Item 1, each of the three shelves on C1 and C2 was divided into six loading zones to give a total of 36 loading zones for loading Item 1. Refer to Figure 7 for details. Similarly, for testing of Item 2, each of the three shelves on C1 and C2 was divided into four loading zones to give a total of 24 loading zones for loading Item 2. Refer to Figure 8 for details. Finally, for testing of Item 3, one shelf on C1 and C2 was divided into four loading zones to give a total of eight loading zones for loading Item 3. Refer to Figure 9 for details.
Each loading zone was loaded with one dry goods load item. This loading pattern represents maximum loading of the autoclave chamber. The number of zones for C1 and C2 for tests of Items 1, 2, and 3 were decided based on the unique sizes of Items 1, 2, and 3.
Variable 4: Orientation of the dry goods load item inside the autoclave chamber.
The orientation of a dry goods load item placed inside the autoclave was expected to have an impact on its equilibration time. Hence, the impact of the orientation of the dry goods load item inside the autoclave chamber was studied during testing.
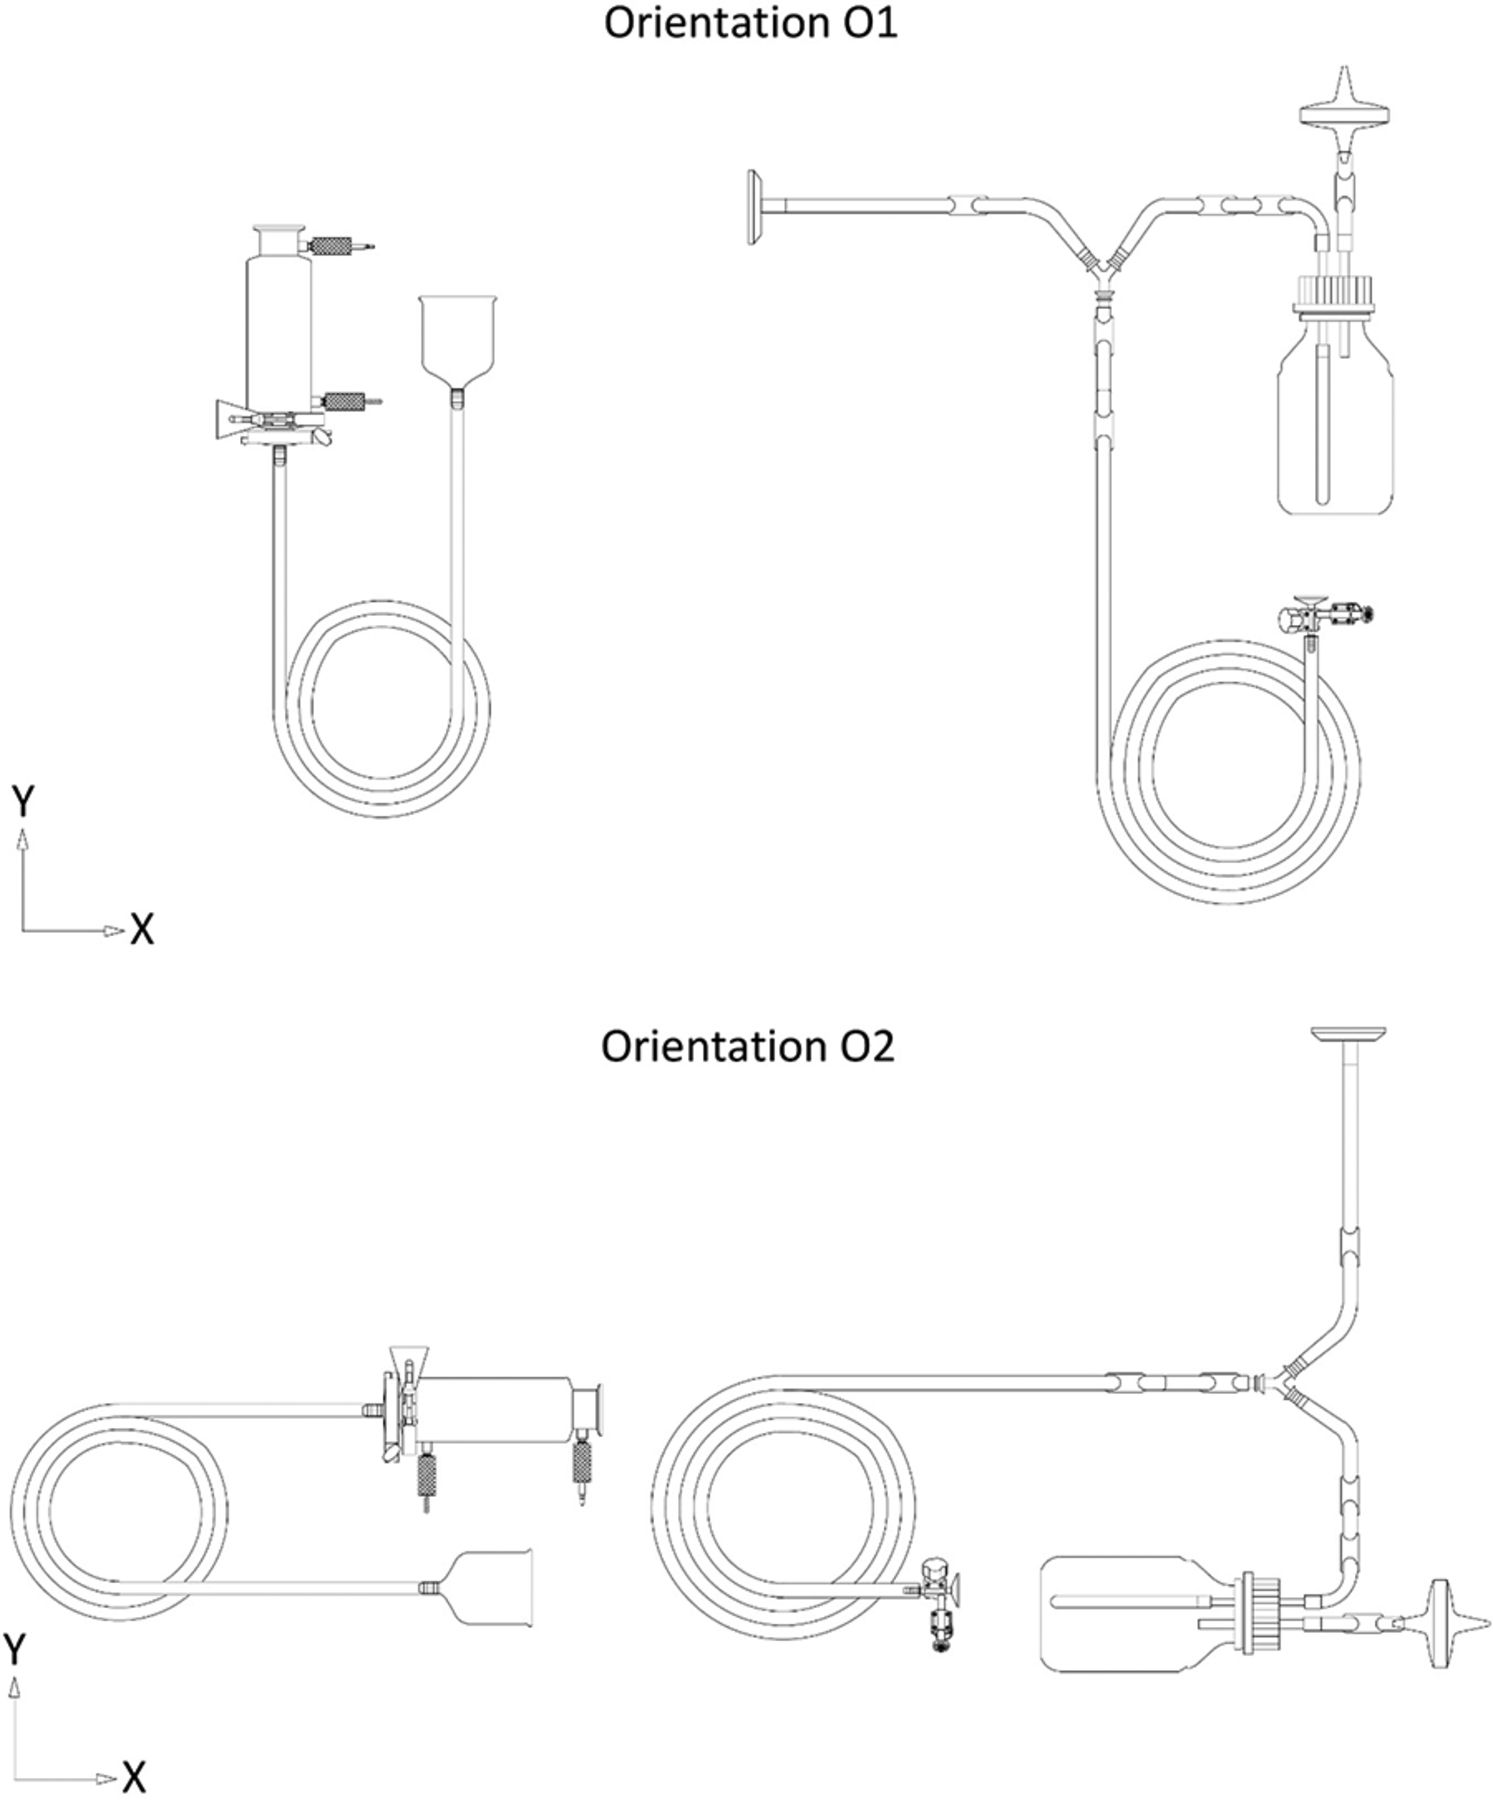
Items 1 and 2 were oriented horizontally along the XY plane in two orientations (referred to as O1 and O2 henceforth) that were designed to be at a 90° angle to each other (refer to Figure 10 for details on orientations of Items 1 and 2, respectively). Item 3 was not oriented horizontally along the XY plane, as it was symmetrical along the horizontal XY plane.
Variable 5: Number of coils of a tubing element.
For a dry goods load item with tubing elements, the number of times the tubing element was coiled was expected to have an impact on the equilibration time of the tubing element. Hence, the impact of the number of coils of a tubing element within a load item was studied during testing.
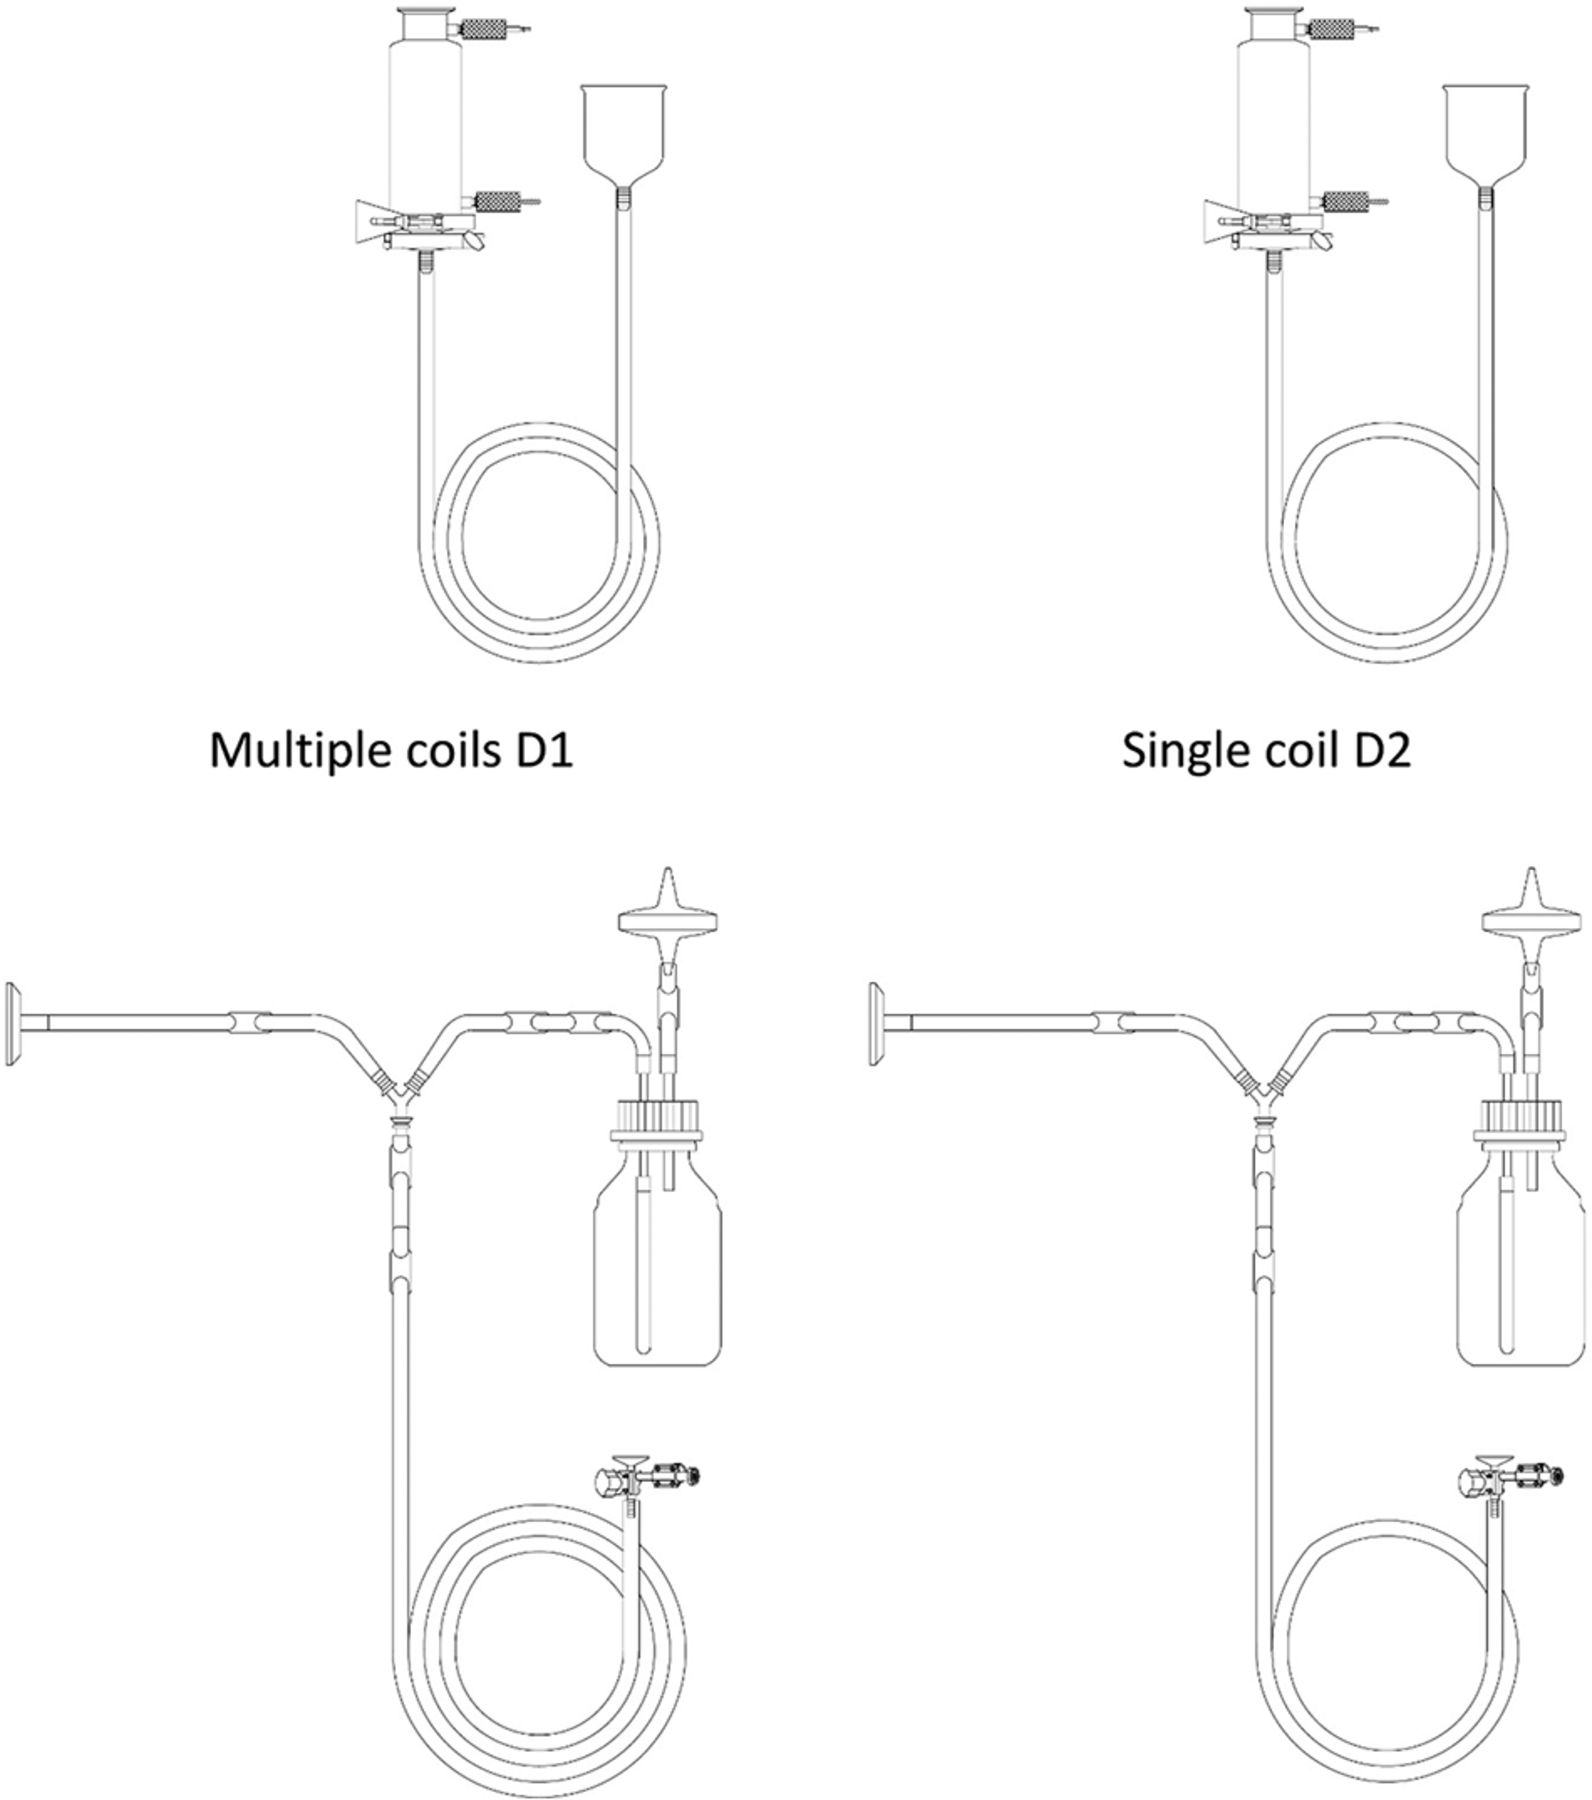
Tubing elements of Items 1 and 2 were coiled into two variations, that is, multiple coils (referred to as D1 henceforth) and a single coil (referred to as D2 henceforth) (refer to Figure 11 for details on coiling of Items 1 and 2, respectively). Item 3 was not considered for this variable as it did not have any major tubing elements.
Variable 6: Total thermal mass of the dry goods load items placed within the autoclave.
The number of dry goods load items placed inside the autoclave was expected to have an impact on their equilibration time. Hence, the impact of the total thermal mass of the dry goods load items placed within the autoclave was studied during testing.
The impact of the total thermal mass of the items loaded within the autoclave was tested by performing maximum versus minimum loading of the autoclave chamber. Maximum loading was performed for Item 1 by loading all 36 loading zones with multiple units of Item 1, for Item 2 by loading all 24 loading zones with multiple units of Item 2, and for Item 3 by loading all eight loading zones with multiple units of Item 3. Minimum loading was performed for Items 1, 2, and 3 by loading one randomly chosen loading zone with one item.
Variable 7: Temperature of the dry goods load items at the start of the sterilization cycle.
Autoclave chambers are equipped with an outer jacket that is filled with steam and maintained at a high temperature to reduce the formation of steam condensate along the inside walls of the autoclave chamber during a sterilization cycle. It should be noted that in most autoclaves this jacket is maintained at a high temperature not only during a sterilization cycle but also when the autoclave is idle and/or is being loaded for its next sterilization cycle. This hot autoclave jacket radiates heat into the autoclave chamber and tends to increase the temperature of the dry goods load items placed in the autoclave before the start of a sterilization cycle. Hence, the impact of the temperature of the dry goods load items at the start of the sterilization cycle was studied during testing.
This variable was not part of the initial test design and was first identified during testing of Item 1. Therefore, this variable was not actively controlled during testing of Item 1. This variable was monitored during testing of Item 1 and was included in the data analysis to further understand sources of variability.
This variable was actively controlled to be at room temperature and monitored during testing of Item 2, as testing of Item 2 was performed after completion of testing of Item 1. This variable was neither monitored nor actively controlled during testing of Item 3, as testing of Item 3 was performed before initiation of testing of Item 1.
Variable 8: Presence of moisture in the dry goods load items at the start of the sterilization cycle.
In the biopharmaceutical manufacturing processes, certain dry goods load items such as filters may be flushed and/or rinsed with water before being sterilized in an autoclave. Hence, the impact of the presence of moisture in the dry goods load items at the start of the sterilization cycle was studied during testing.
This variable was not a part of the initial test design and was first identified during preparation of Item 3. This variable was monitored during testing of Item 3 and was included in the data analysis to further understand sources of variability.
This variable was actively controlled by ensuring use of fresh dry filters during testing of Item 1 as testing of Item 1 was performed after completion of testing of Item 3.
Variable 9: Number of steam and vacuum pulses used for preconditioning in the autoclave recipe.
The number of steam and vacuum pulses used for preconditioning in the autoclave recipe was expected to have an impact on the autoclave's equilibration time. Hence, the impact of the number of steam and vacuum pulses used for preconditioning in the autoclave recipe was studied during testing by executing autoclave recipes with three alternating steam and vacuum pulses versus five alternating steam and vacuum pulses in their preconditioning phase. All tests pertaining to this variable were executed using Item 3. Refer to Table II for details of the number of steam and vacuum pulses in each recipe.
Variable 10: Depth of the steam and vacuum pulses used for preconditioning in the autoclave recipe.
The depth of the steam and vacuum pulses used for preconditioning in the autoclave recipe was expected to have an impact on the autoclave's equilibration time. The depth of the steam and vacuum pulses was altered by using different pressure set points for the steam and vacuum pulses. Hence, the impact of the depth of the steam and vacuum pulses used for preconditioning in the autoclave recipe was studied during testing by executing autoclave recipes with steam pulse pressures at 35.0 psi (maximum steam pressure on the system) versus 26.3 psi (75% of the maximum steam pressure on the system) and vacuum pulse pressures at 1.4 psi (90% lower than atmospheric pressure) versus 3.7 psi (75% lower than atmospheric pressure) and/or 15 psi (approximate atmospheric pressure). All tests pertaining to this variable were executed using Item 3 (refer to Table II for details of the depth of the steam and vacuum pulses in each recipe).
Variable 11: Hold time of the steam and vacuum pulses used for preconditioning in the autoclave recipe.
The hold time of the steam and vacuum pulses used for preconditioning in the autoclave recipe was expected to have an impact on the autoclave's equilibration time. Hence, the impact of the hold time of the steam and vacuum pulses used for preconditioning in the autoclave recipe was studied during testing by executing autoclave recipes with 5-min hold time for steam and vacuum pulses versus 0-min hold time for steam and vacuum pulses in their preconditioning phase. All tests pertaining to this variable were executed using Item 3. Refer to Table II for details of the pulse hold times of the steam and vacuum pulses in each recipe.
Details of TC Placement Locations

Depiction of division of shelves into loading zones for Item 1.

Depiction of division of shelves into loading zones for Item 2.

Depiction of division of shelves into loading zones for Item 3.

Depiction of Orientations O1 and O2 for Items 1 (left) and 2 (right).

Depiction of coils D1 and D2 for Items 1 (top) and 2 (bottom).
Details of Preconditioning Phases of the Recipes Tested for Optimization
Test Design
Of the total number of variables described above, the specific variables that impact the equilibration time of a given item are dependent on its design and geometrical complexity. For example, Variables 4 and 5 were expected to impact on Items 1 and 2 but not on Item 3.
Hence during Phase 1, tests for maximum loading of Items 1 and 2 were performed by using the concept of split plot design. Per this design, three consecutive tests were performed for four unique variable start conditions to give a total of 12 tests each for Items 1 and 2. Tests for maximum loading of Item 3 were performed by using the concept of complete randomized design (CRD). Per this design, three consecutive tests (triplicates) were performed for Item 3.
Following the maximum loading tests, three consecutive tests were performed with Items 1, 2, and 3 with minimum loading where only one load item was placed in a random zone within the autoclave.
During Phase 2, tests for maximum loading of Item 3 were performed by using the concept of CRD. Per this design, three consecutive tests (triplicates) were performed for Item 3.
Test Recipe
The preconditioning phase of the autoclave recipe comprises multiple steam and vacuum pulses that remove air from the autoclave chamber and in turn remove air from the dry goods load items placed within the autoclave chamber (Figure 1). This phase is expected to play a significant role in equilibrating the dry goods load items placed within the autoclave chamber to sterilization temperatures.
During Phase 1, a standard recipe with a preconditioning phase consisting of alternating vacuum and pressure pulses was used. This recipe consisted of five alternating steam and vacuum pulses at a pressure of 26.0 psi and 3.7 psi, respectively, without any hold. The sterilization temperature was set at 121°C in this recipe.
During Phase 2, six different recipes with different set points were tested. Each of these six recipes consisted of alternating vacuum and pressure pulses. The number of pulses, the depth of the pulses, and the hold time of the pulses varied across these six recipes. Refer to Table II for details of the preconditioning phases of the recipes.
Results and Observations
The first test performed was an empty chamber heat distribution test to map the presence of cold spots within the Finn-Aqua autoclave, model 121,225-D. TCs were placed at different locations along the X, Y, and Z coordinates of the autoclave chamber for this test. During this test, the autoclave chamber did not show the presence of any cold spots during the exposure periods of the sterilization cycle. Based on this, the Finn-Aqua autoclave, model 121,225-D, was deemed appropriate for the study.
Raw temperature data from each TC placed within each item during testing were analyzed to calculate the time taken to equilibrate each TC. The temperature cutoff used for this analysis was ≥119.5°C, that is, TCs were considered to be equilibrated once they attained a stable temperature that was ≥119.5°C. This temperature was chosen as it is at the lower end of the generally accepted sterilization temperature range of 121 ± 1.5°C.
During testing, some TCs in test items equilibrated faster than the TC placed in the autoclave drain. Therefore, the calculated equilibration time for these TCs was a negative number.
During Phase 1, 46 tests were performed for Items 1, 2, and 3 for the identification of key recipe-independent variables that impact equilibration time measurements.
During Phase 2, 18 tests were performed with Item 3 for optimization of the autoclave recipe to achieve shorter equilibration time while controlling the key recipe-independent variables identified earlier.
Test results from Phase 1 tests are provided in Figures 12 to 26 and Tables 3 to 5 along with relevant observations. Test results from Phase 2 tests are provided in Table 6 along with relevant observations.
Type of Dry Goods Load Item Placed inside the Autoclave (Variable 1)
Items 1, 2, and 3 used in this study are very distinct from one another in design and geometry. However, Items 1 and 2 have some commonalities between their core components, for example, both Items 1 and 2 contain a tubing element of identical construction material. Therefore, the impact of Variable 1 is studied in conjunction with that of Variable 2 by comparing the data generated for Variable 2 across the commonalities between Items 1 and 2.
Location of the TC Placed within the Dry Goods Load Item (Variable 2)
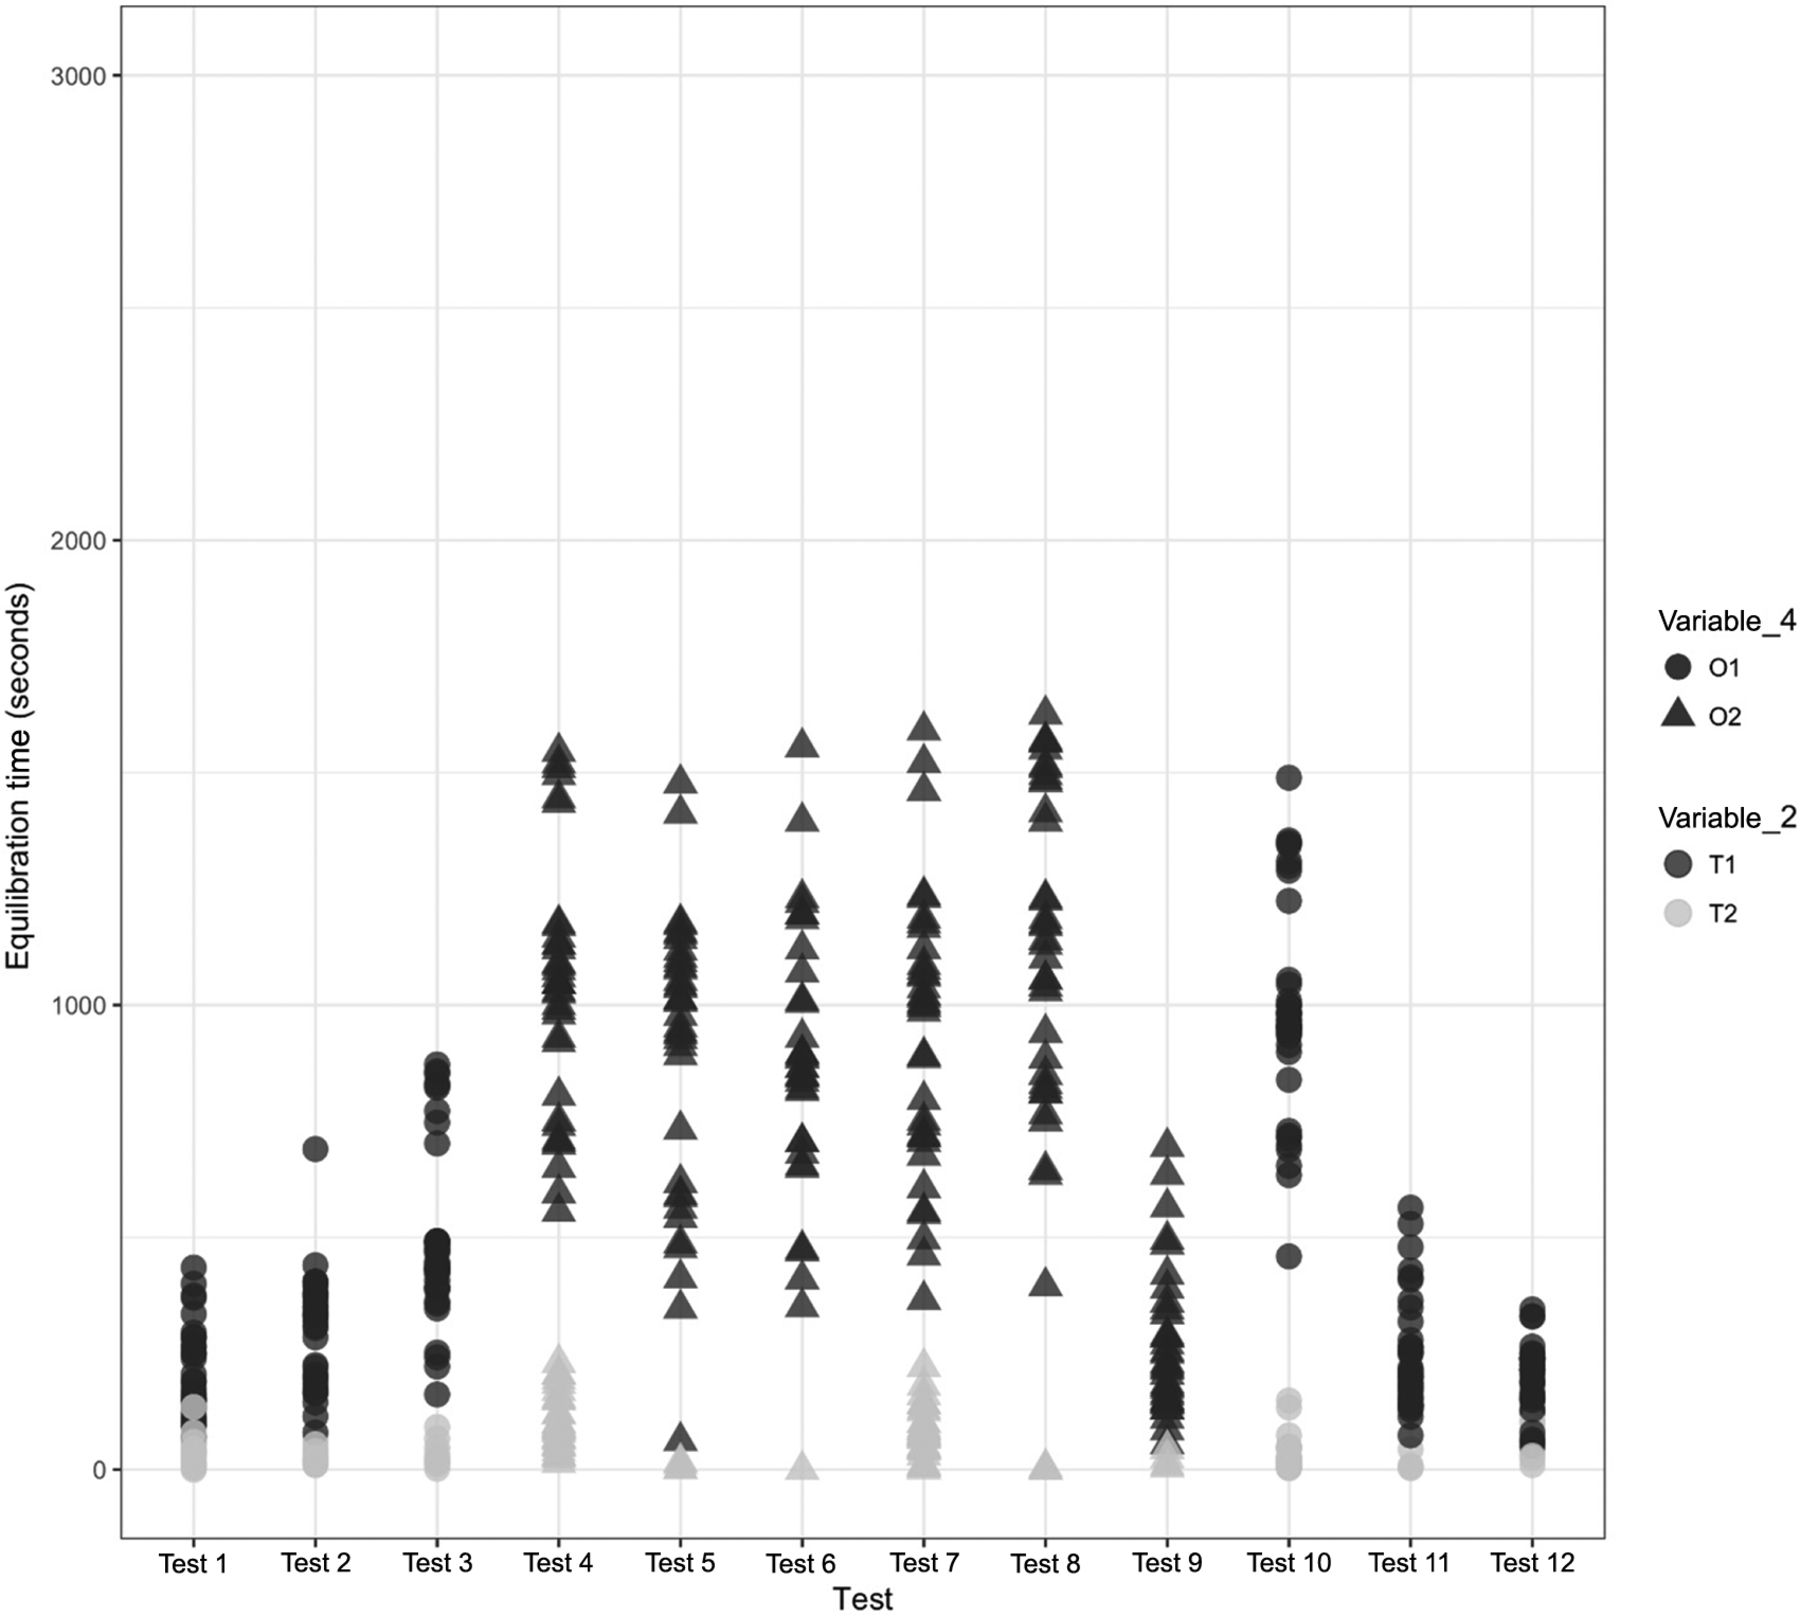
A comparison was performed to understand the impact of Variable 2 on the equilibration of Items 1, 2, and 3. The results of the same are depicted in Figures 12, 13, and 14 for Items 1, 2, and 3, respectively.

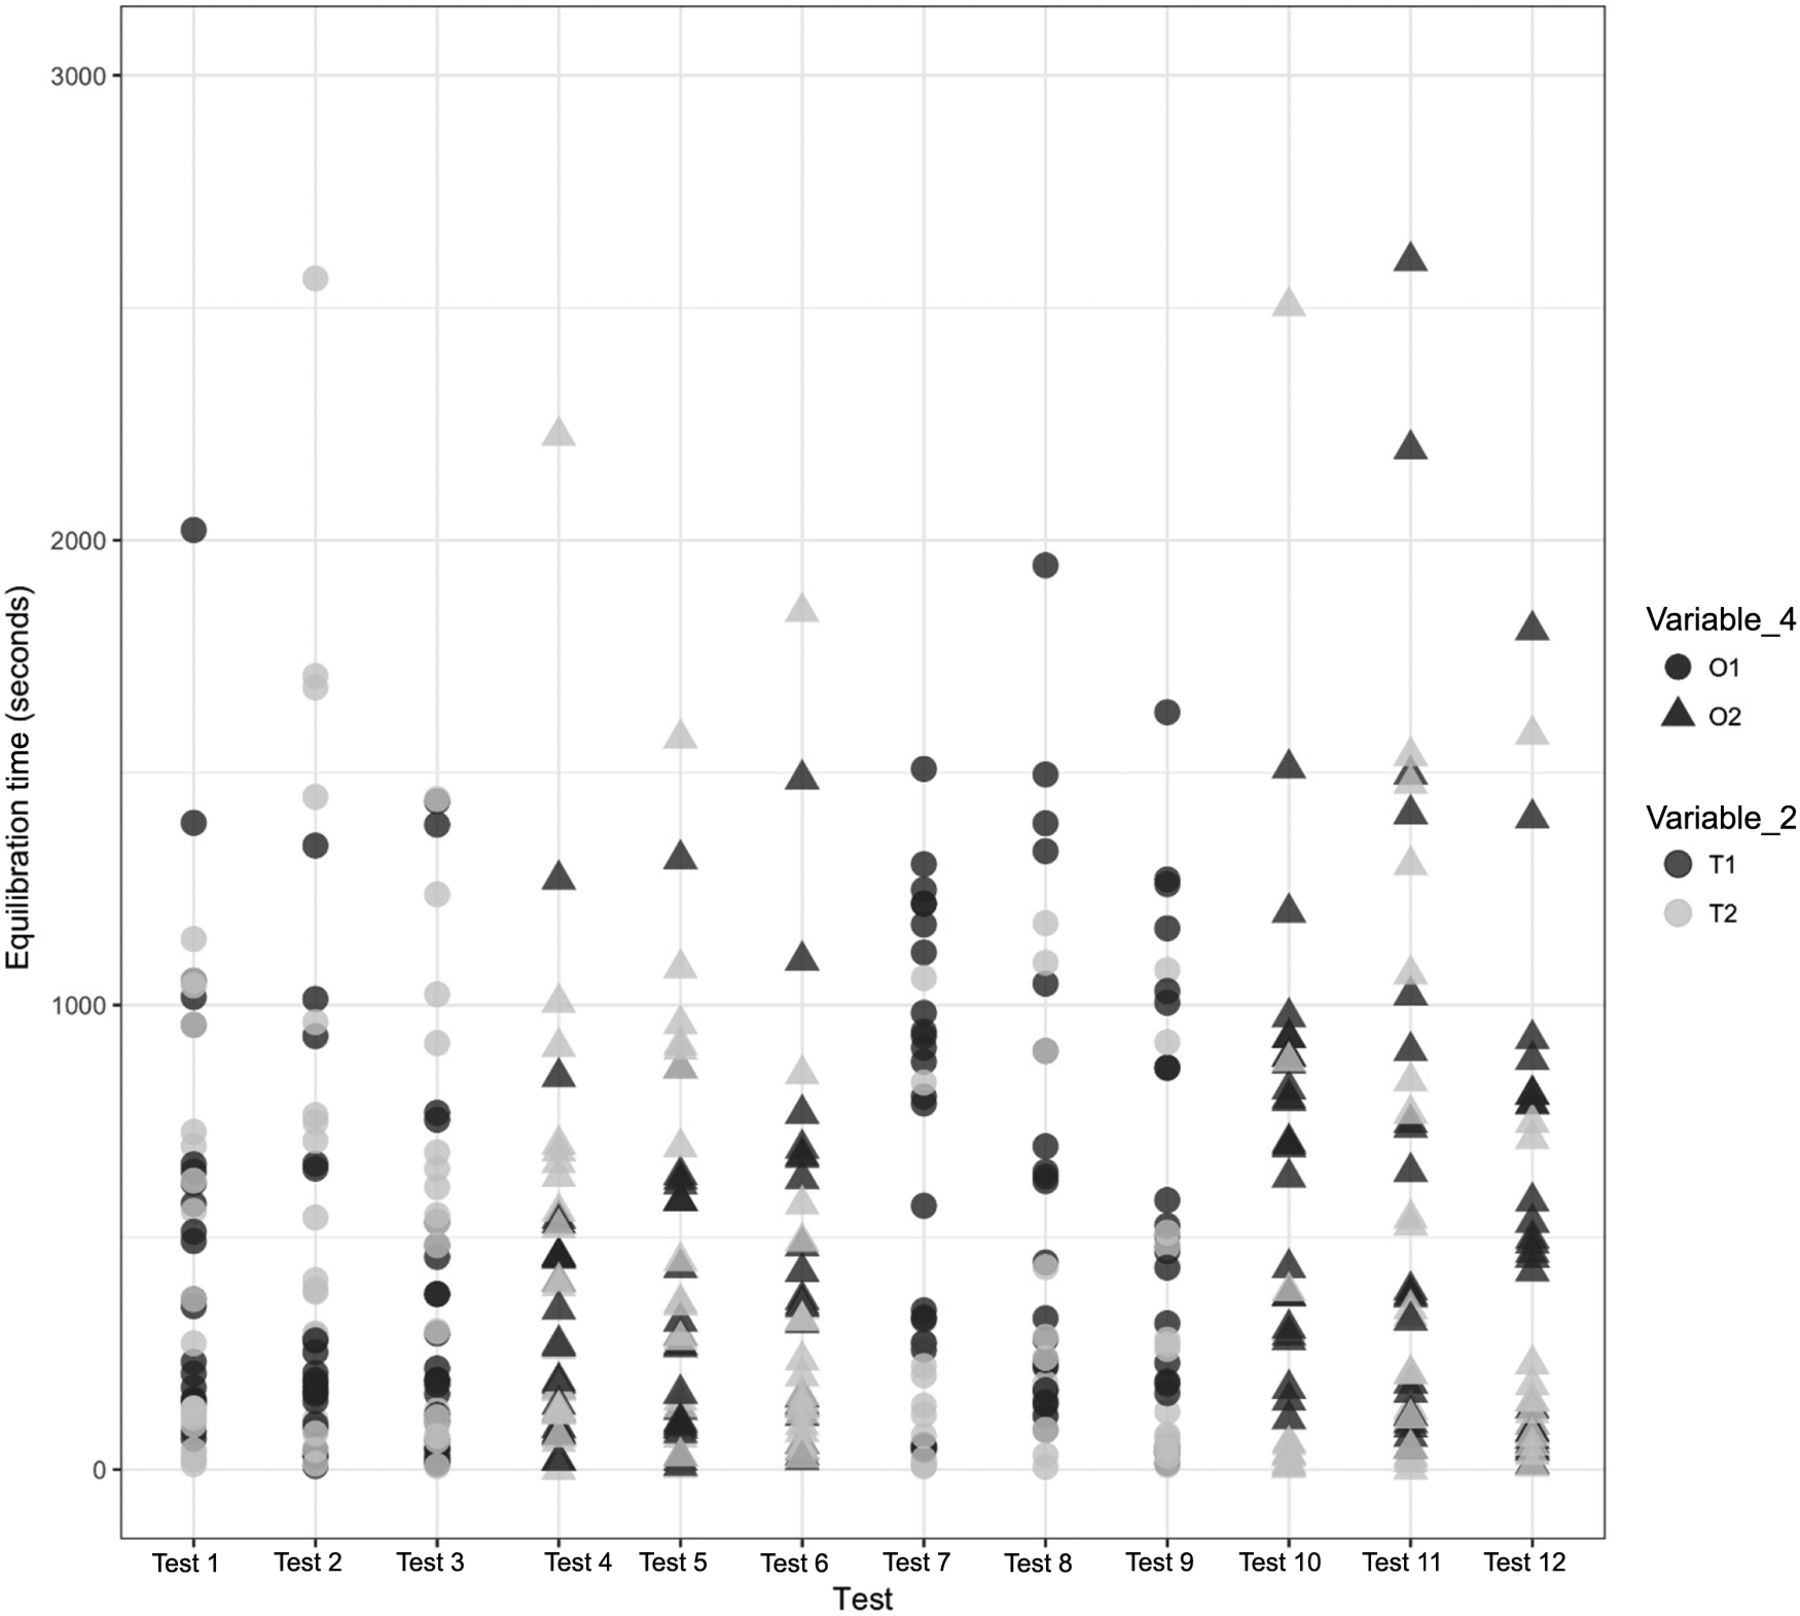
Effects of Variable 2 and Variable 4 on the equilibration of Item 1.

Effects of Variable 2 and Variable 4 on the equilibration of Item 2.

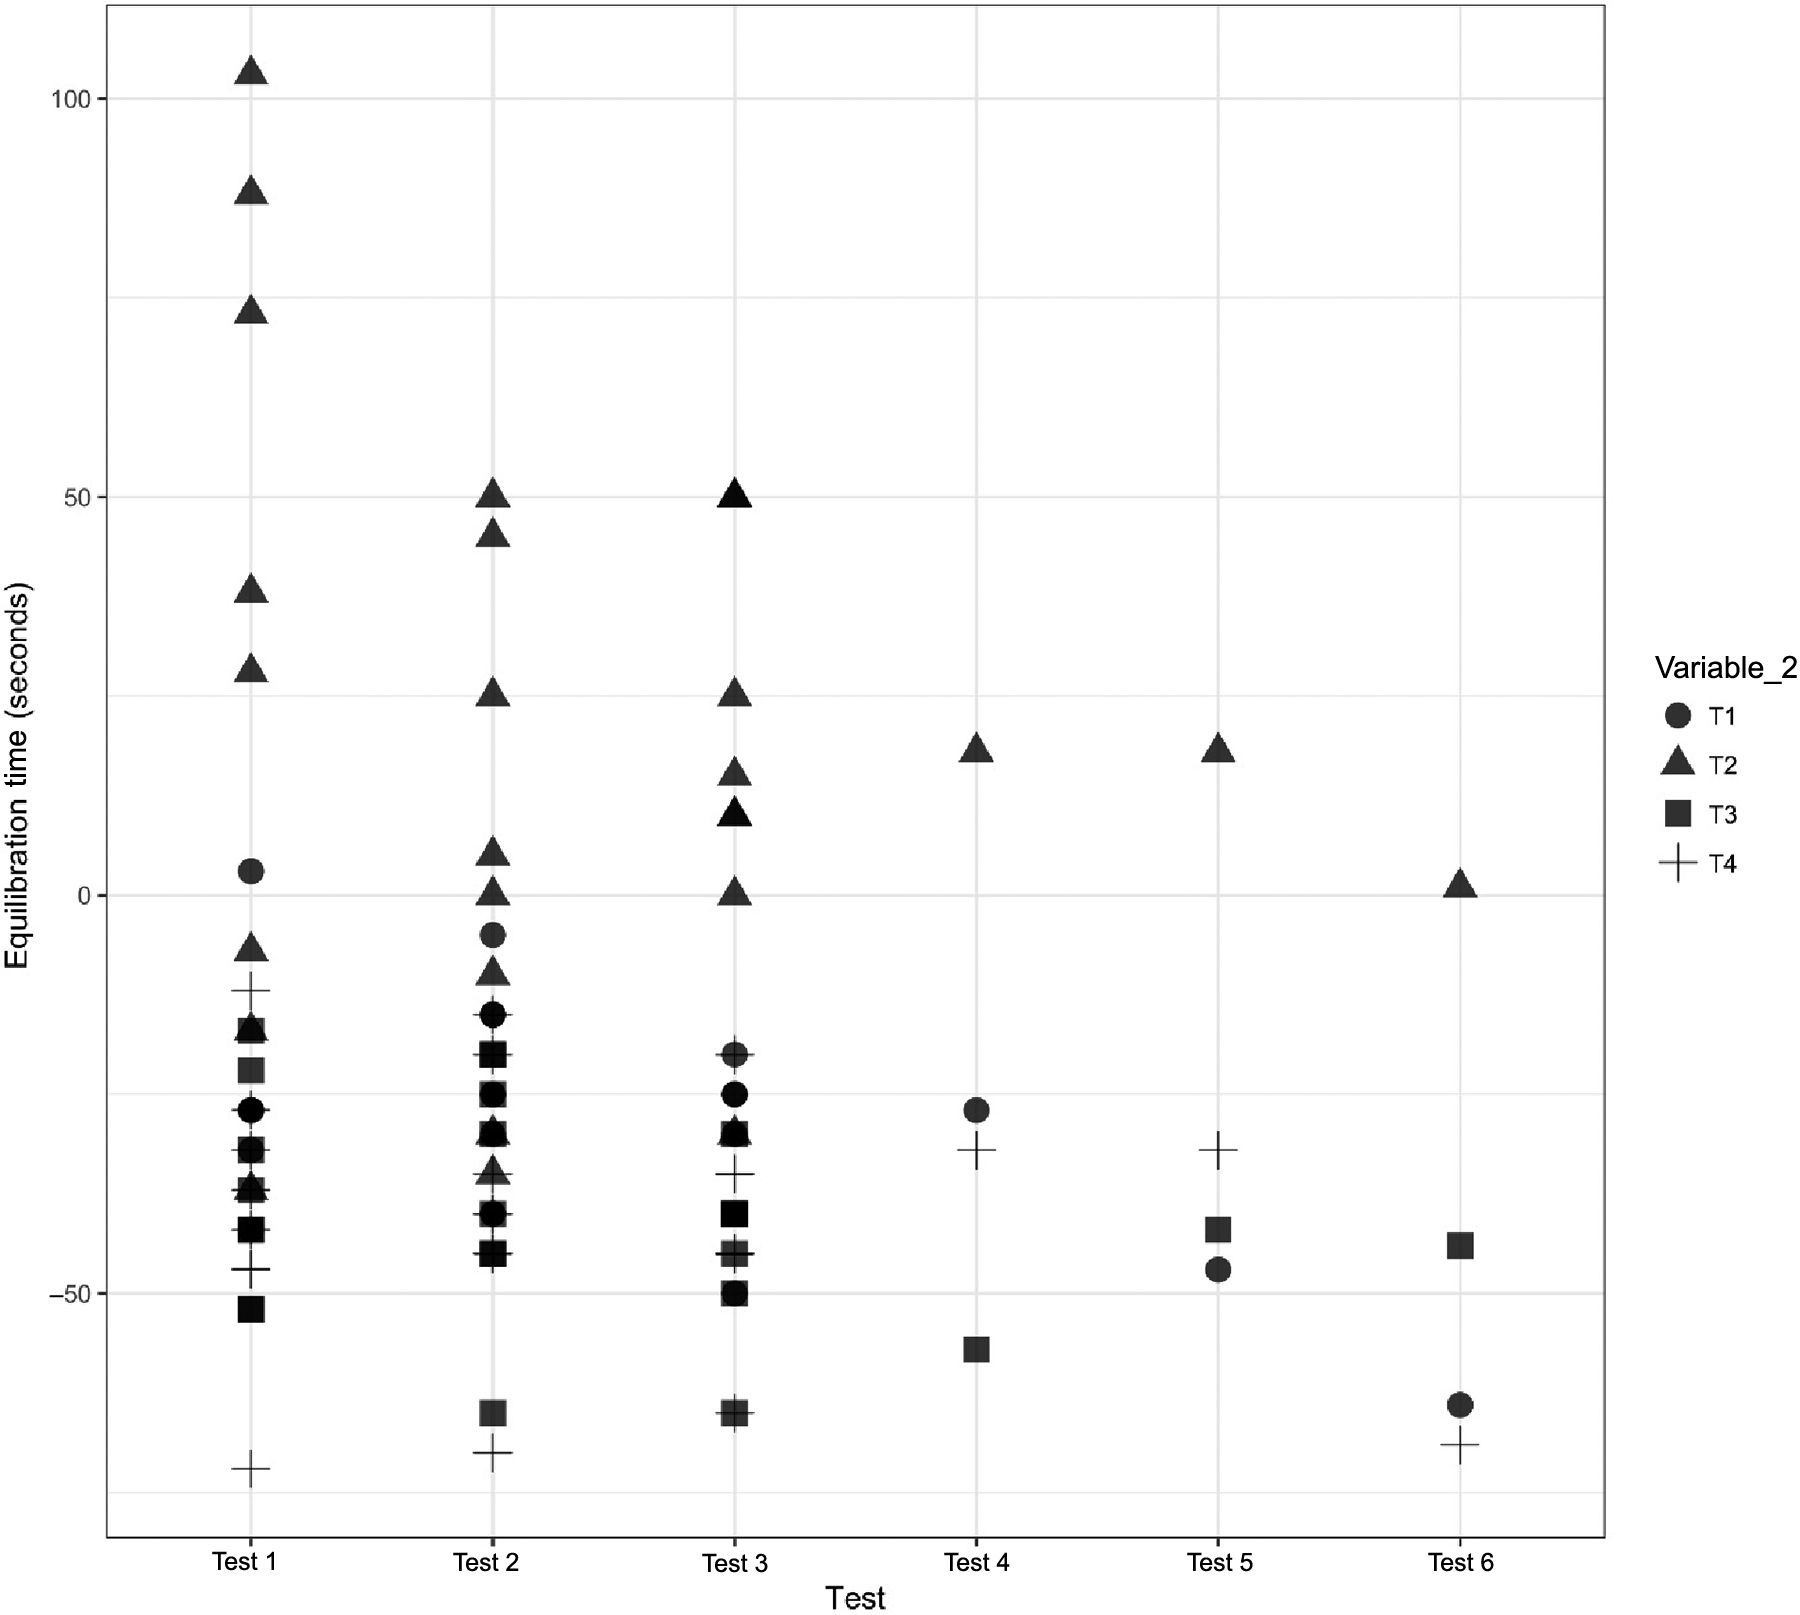
Effects of Variable 2 and Variable 8 on Item 3.
In Figures 12 and 13, the X-axis represents the 12 maximum loading tests performed for Items 1 and 2 and the Y-axis represents the equilibration time data. Variable 2 is represented by different colors. For Item 1, each test consists of 36 test items that are represented by 72 individual data points, and for Item 2, each test consists of 24 test items that are represented by 48 individual data points.
In Figure 14, the X-axis represents the three maximum loading and three minimum loading tests performed for Item 3 and the Y-axis represents the equilibration time data. Variable 2 is represented by different shapes. For Item 3, each maximum loading test consisted of test items that are represented by 32 data points, while each minimum loading test consisted of one test item represented by four data points. The following observations are made from these figures:
Observation 1: The TCs placed within the filter element of Item 1 (i.e., T1) consistently require longer to equilibrate than the TCs placed within the 6 ft in length tubing element of Item 1 (i.e., T2). Compare T1 with T2 in Figure 12.
Observation 2: No significant distinction is observed between the TCs placed within the glass bottle of Item 2 (i.e., T1) and the TCs placed within the 9 ft in length tubing element of Item 2 (i.e., T2). Compare T1 with T2 in Figure 13. This is hypothesized to be because there is no extra layer of insulation to steam penetration on the glass bottle and the tubing element.
Observation 3: The 6 ft in length tubing element of Item 1 has a lower level of geometrical complexity than the 9 ft in length tubing element with “Y” connector of Item 2. Compare the geometries of the type of dry goods items loaded inside the autoclave chamber (Variable 1), that is, Items 1 and 2, in Figures 4 and 5, respectively. The TCs placed within the tubing element of Item 1 (i.e., T2) have lower variability than the TCs placed within the tubing element of Item 2 (i.e., T2). Compare T2 in Figure 12 with T2 in Figure 13.
Observation 4: The TCs placed within the filter element of Item 3 (i.e., T2) consistently require longer to equilibrate than the TCs placed in the glass bottle and can of Item 3 (i.e., T1, T3, and T4). Compare T2 with T1, T3, and T4 in Figure 14.
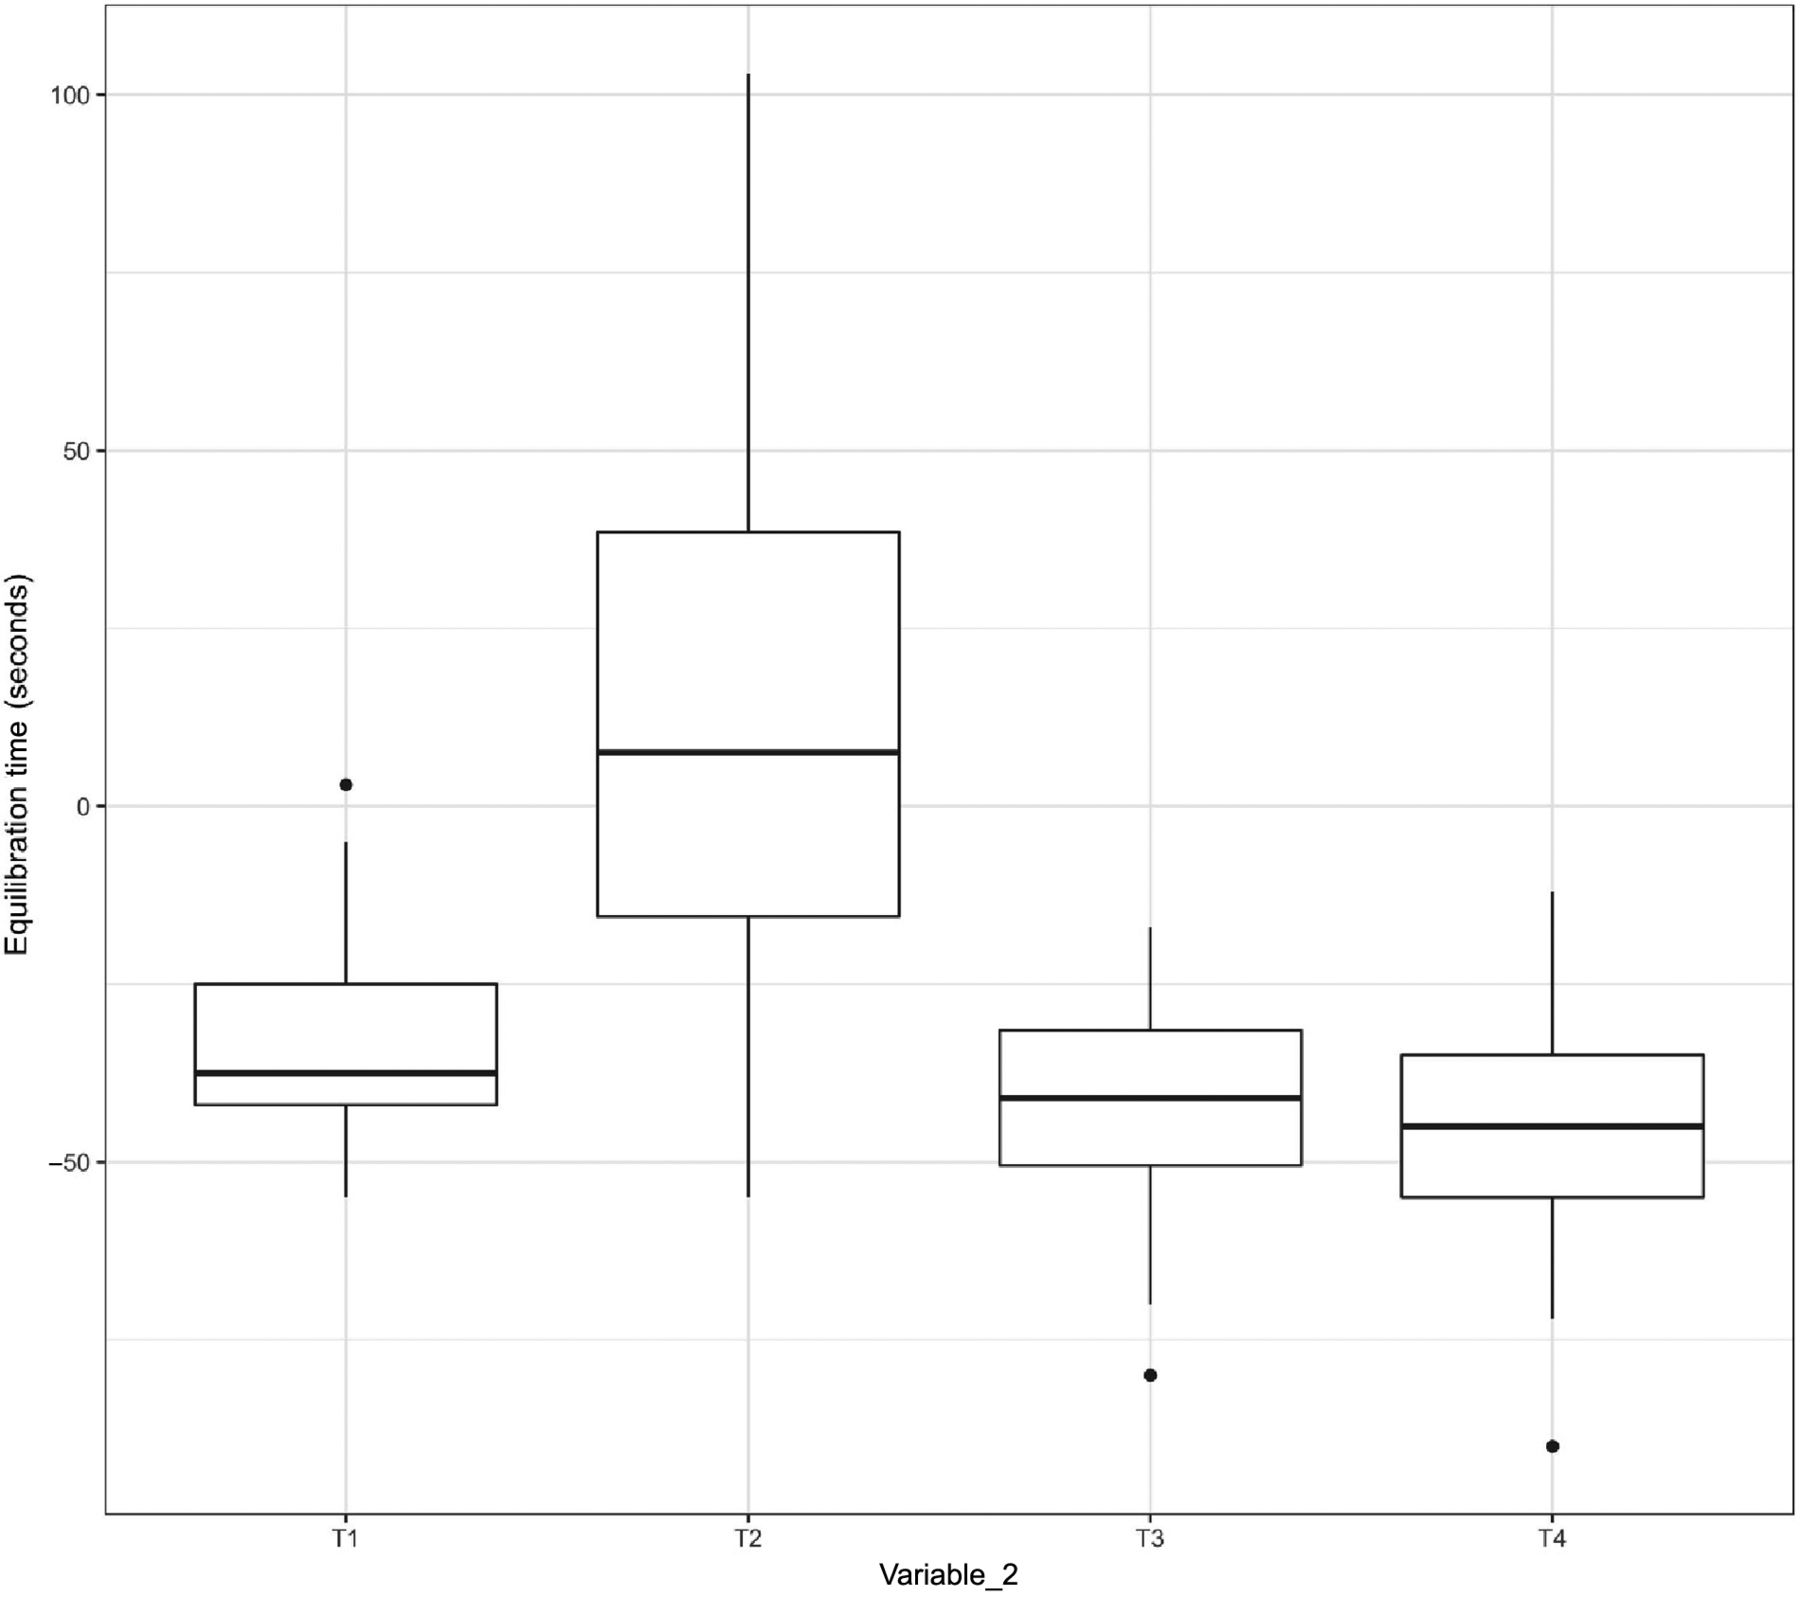
In addition, the data of Variable 2 from Items 1, 2, and 3 were assessed through a box plot used to understand the relationship between the length of the equilibration time and the variability in the equilibration time. The results are depicted in Figures 15, 16, and 17.

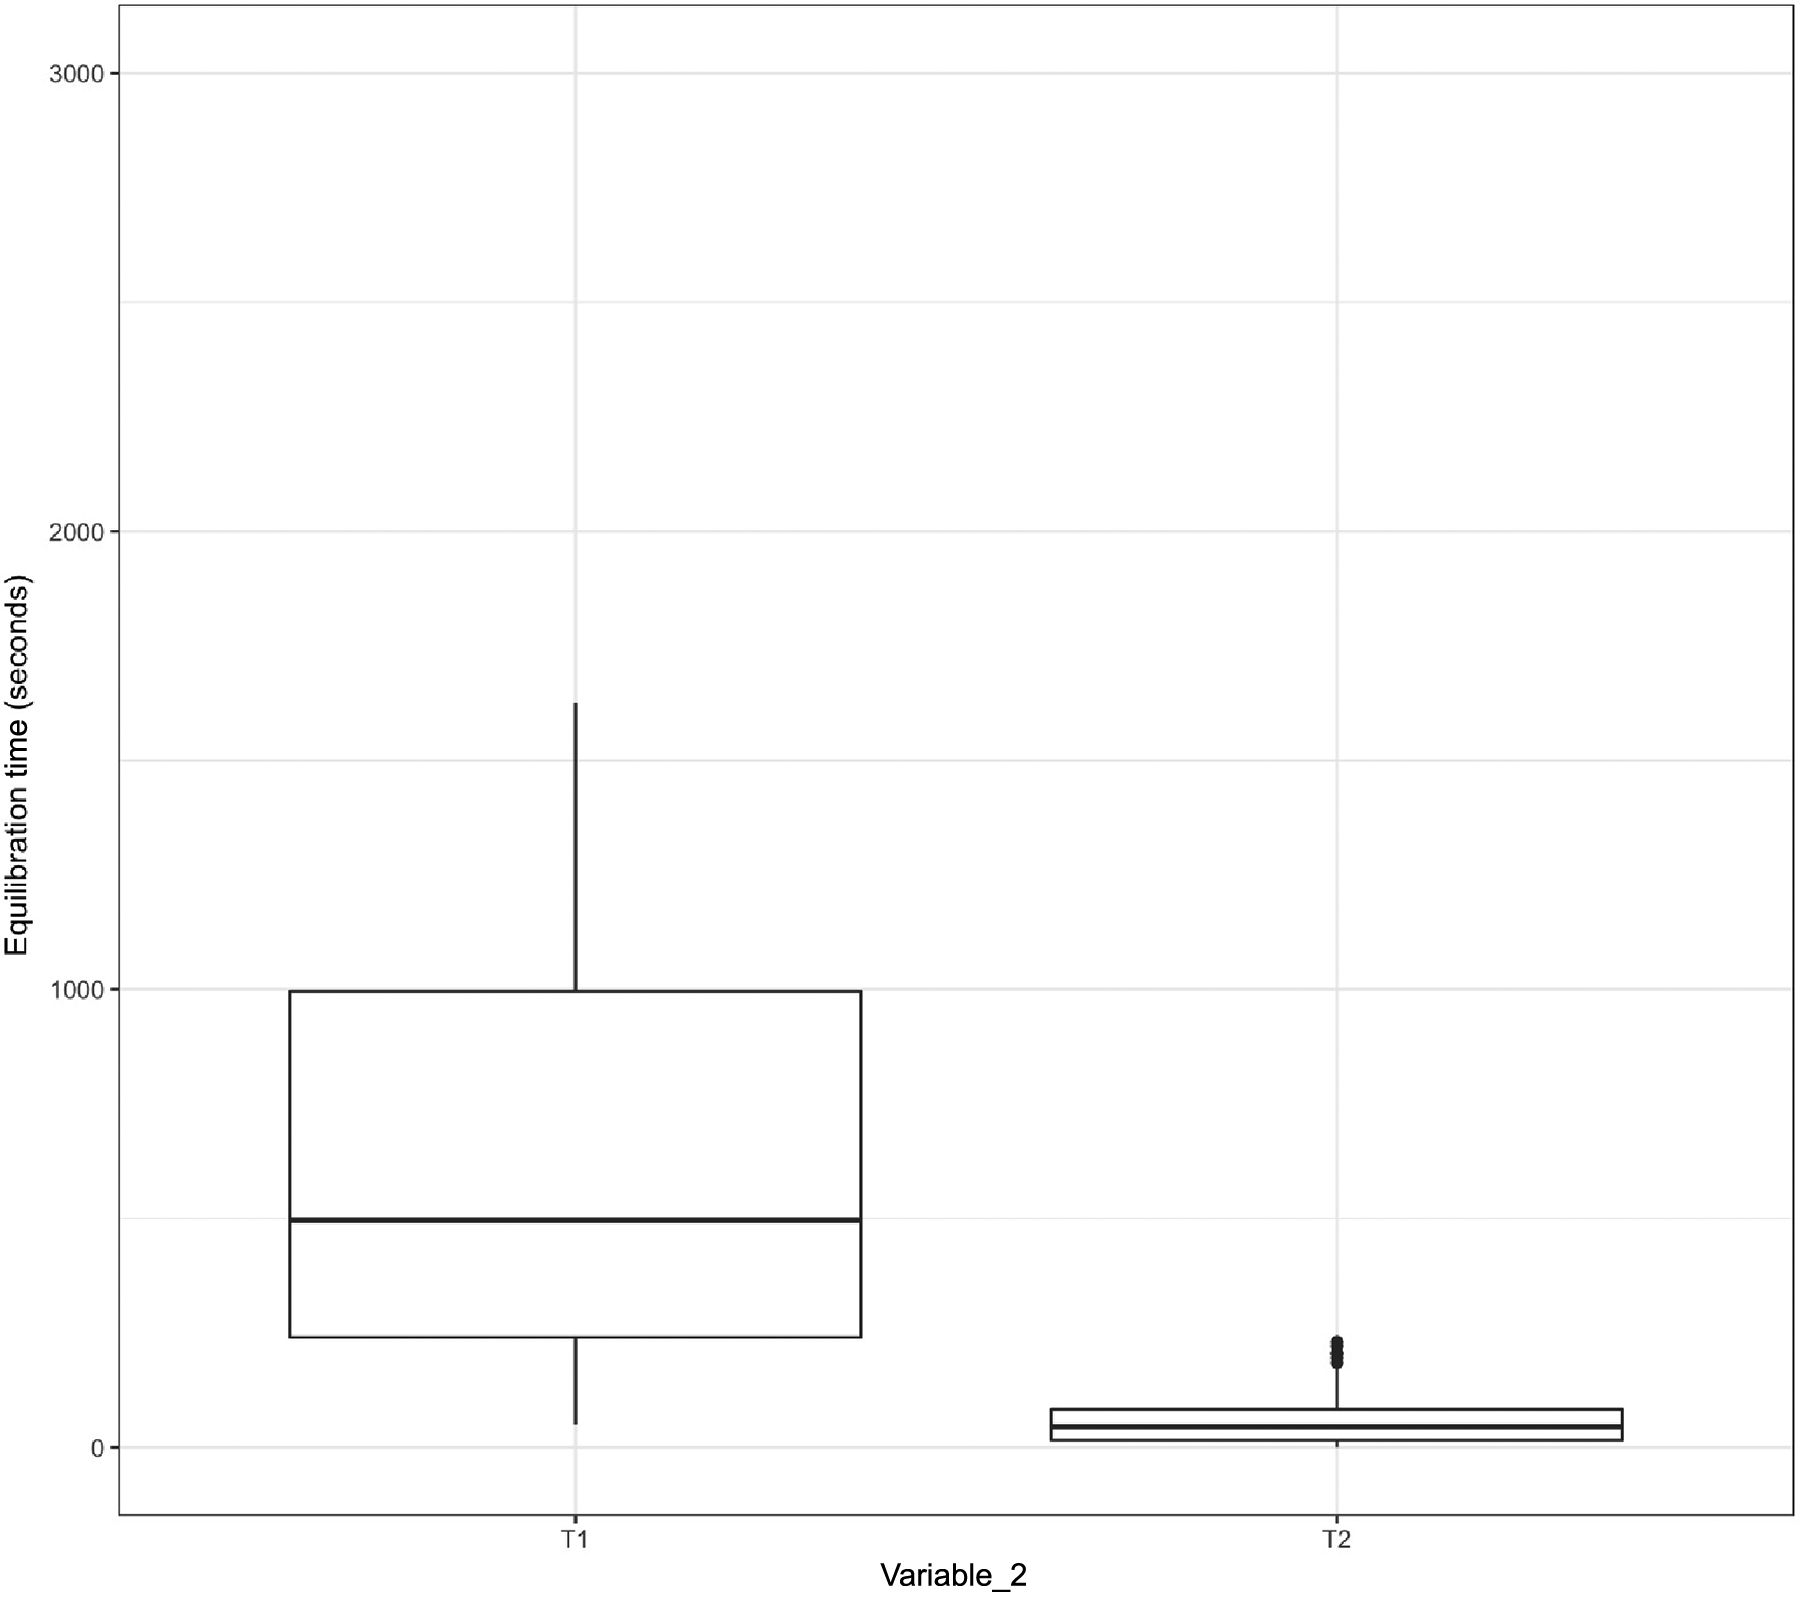
Relationship between the length and the variability of the equilibration time of Item 1.

Relationship between the length and the variability of the equilibration time of Item 2.

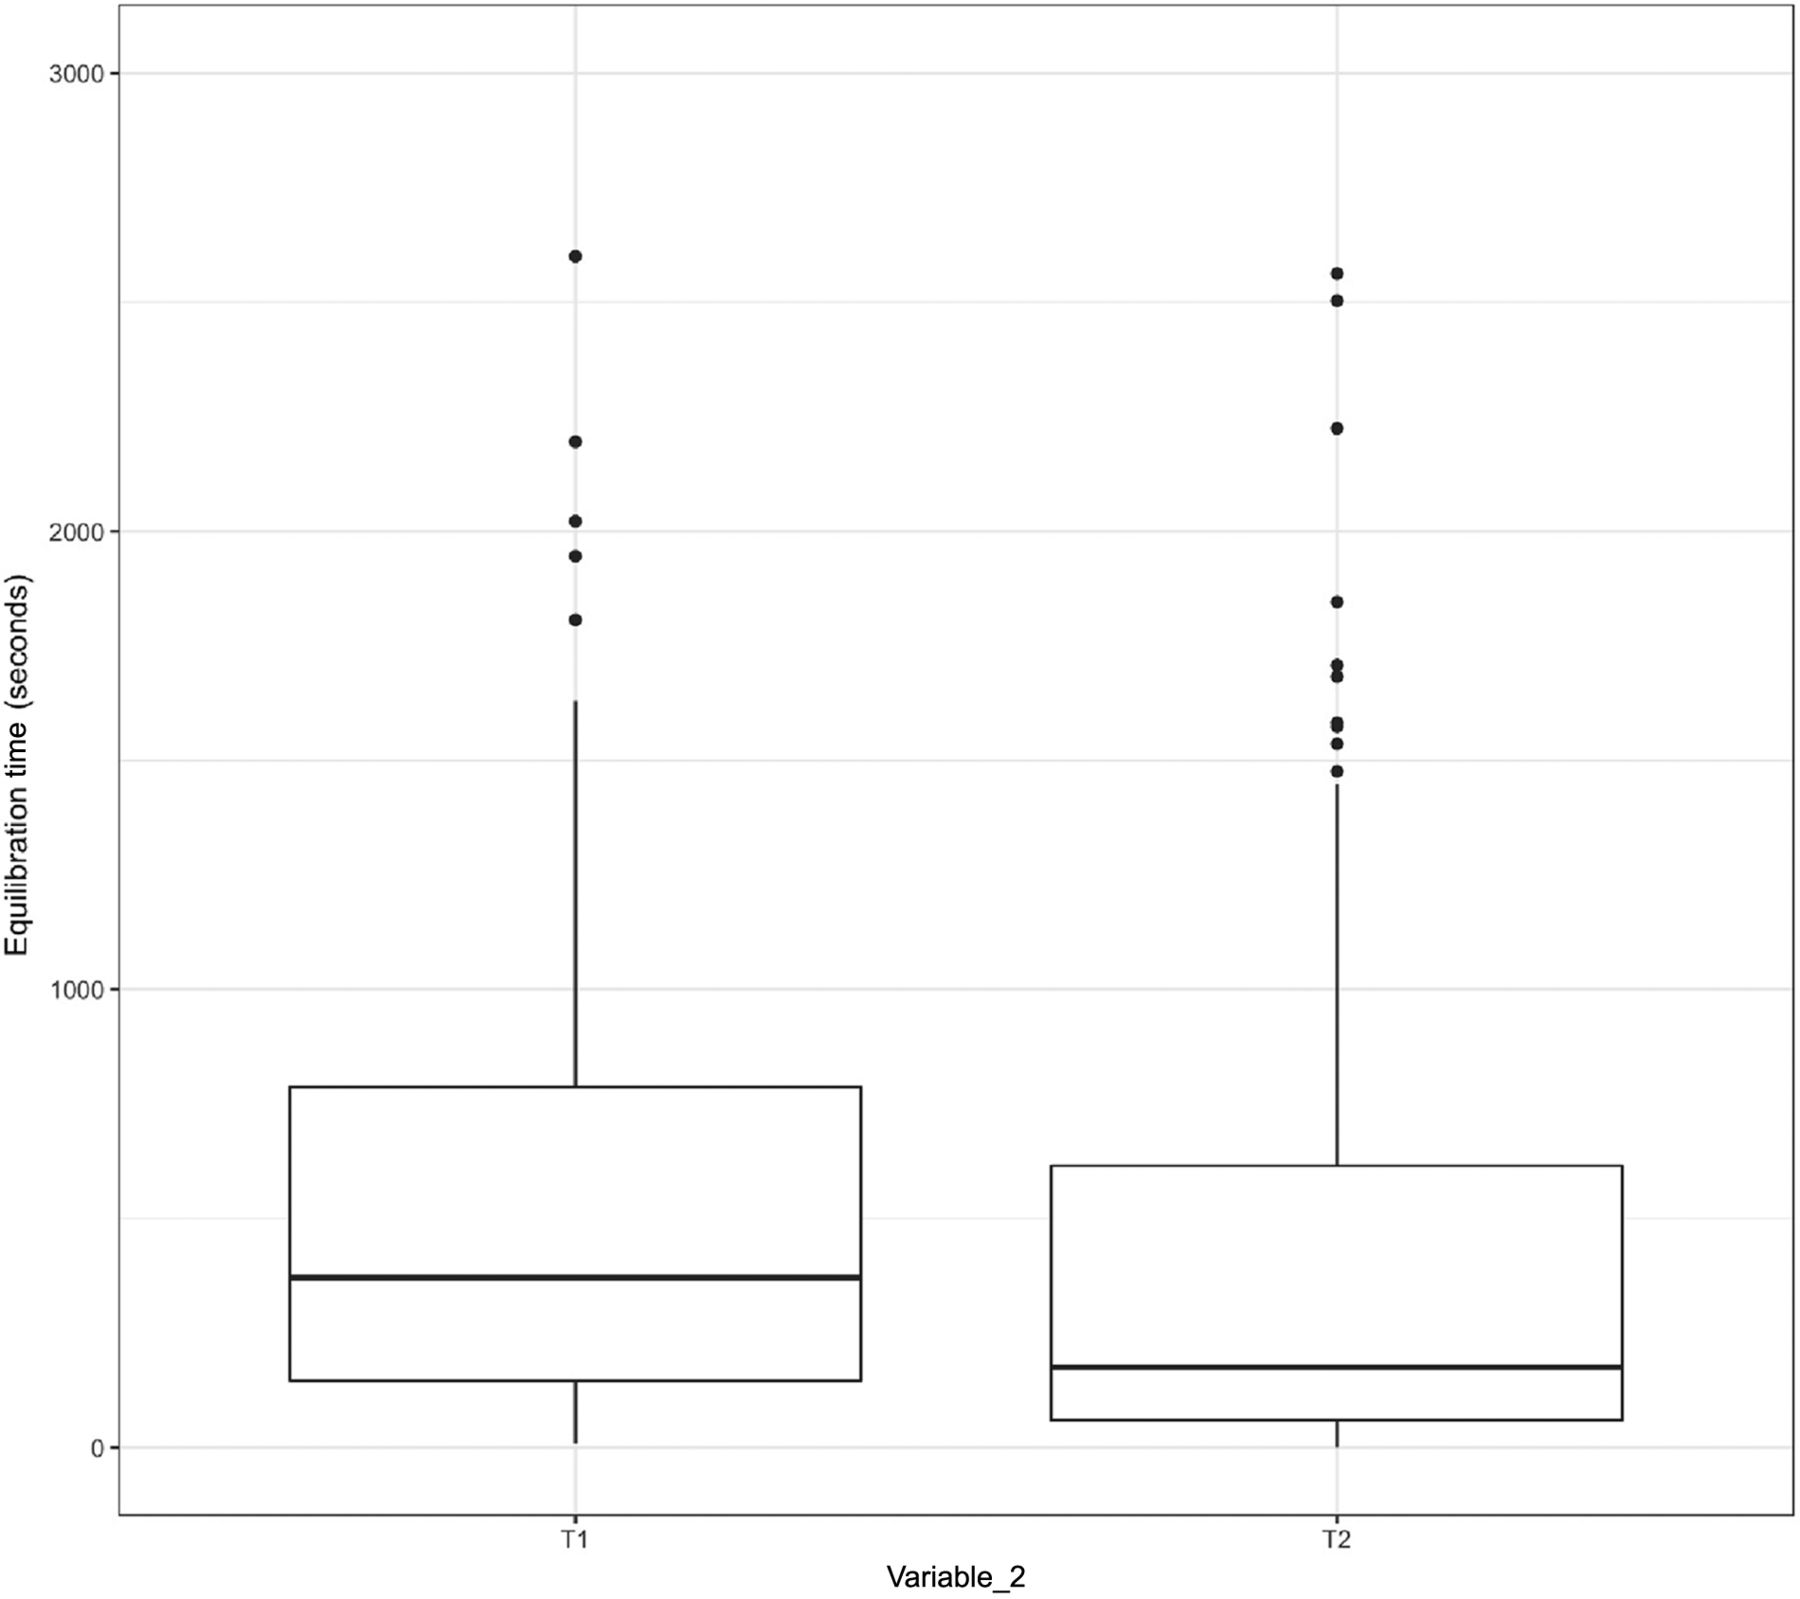
Relationship between the length and the variability of the equilibration time of Item 3.
In Figures 15 and 16, the X-axis represents T1 and T2 of Variable 2 for Items 1 and 2, respectively, and the Y-axis represents the equilibration time. In Figure 17, the X-axis represents T1, T2, T3, and T4 of Variable 2 for Item 3 and the Y-axis represents the equilibration time. The following observations are made from these figures:
Observation 5: For the TCs placed within the filter element of Item 1 (i.e., T1 of Variable 2) that consistently require longer time to equilibrate than the TCs placed within the tubing element of Item 1 (i.e., T2 of Variable 2), the distribution of data points for the adjusted equilibration around the mean is greater.
Observation 6: For the TCs placed within the glass bottle of Item 2 (i.e., T1 of Variable 2) that equilibrate at a comparable rate compared with the TCs placed within the tubing element of Item 2 (i.e., T2 of Variable 2), the distribution of data points for the adjusted equilibration around the mean is also comparable.
Observation 7: For the TCs placed within the filter element of Item 3 (i.e., T2 of Variable 2) that consistently require longer time to equilibrate than the TCs placed in the glass bottle and the can of Item 3 (i.e., T1, T3, and T4 of Variable 2), the distribution of data points for the adjusted equilibration around the mean is greater.
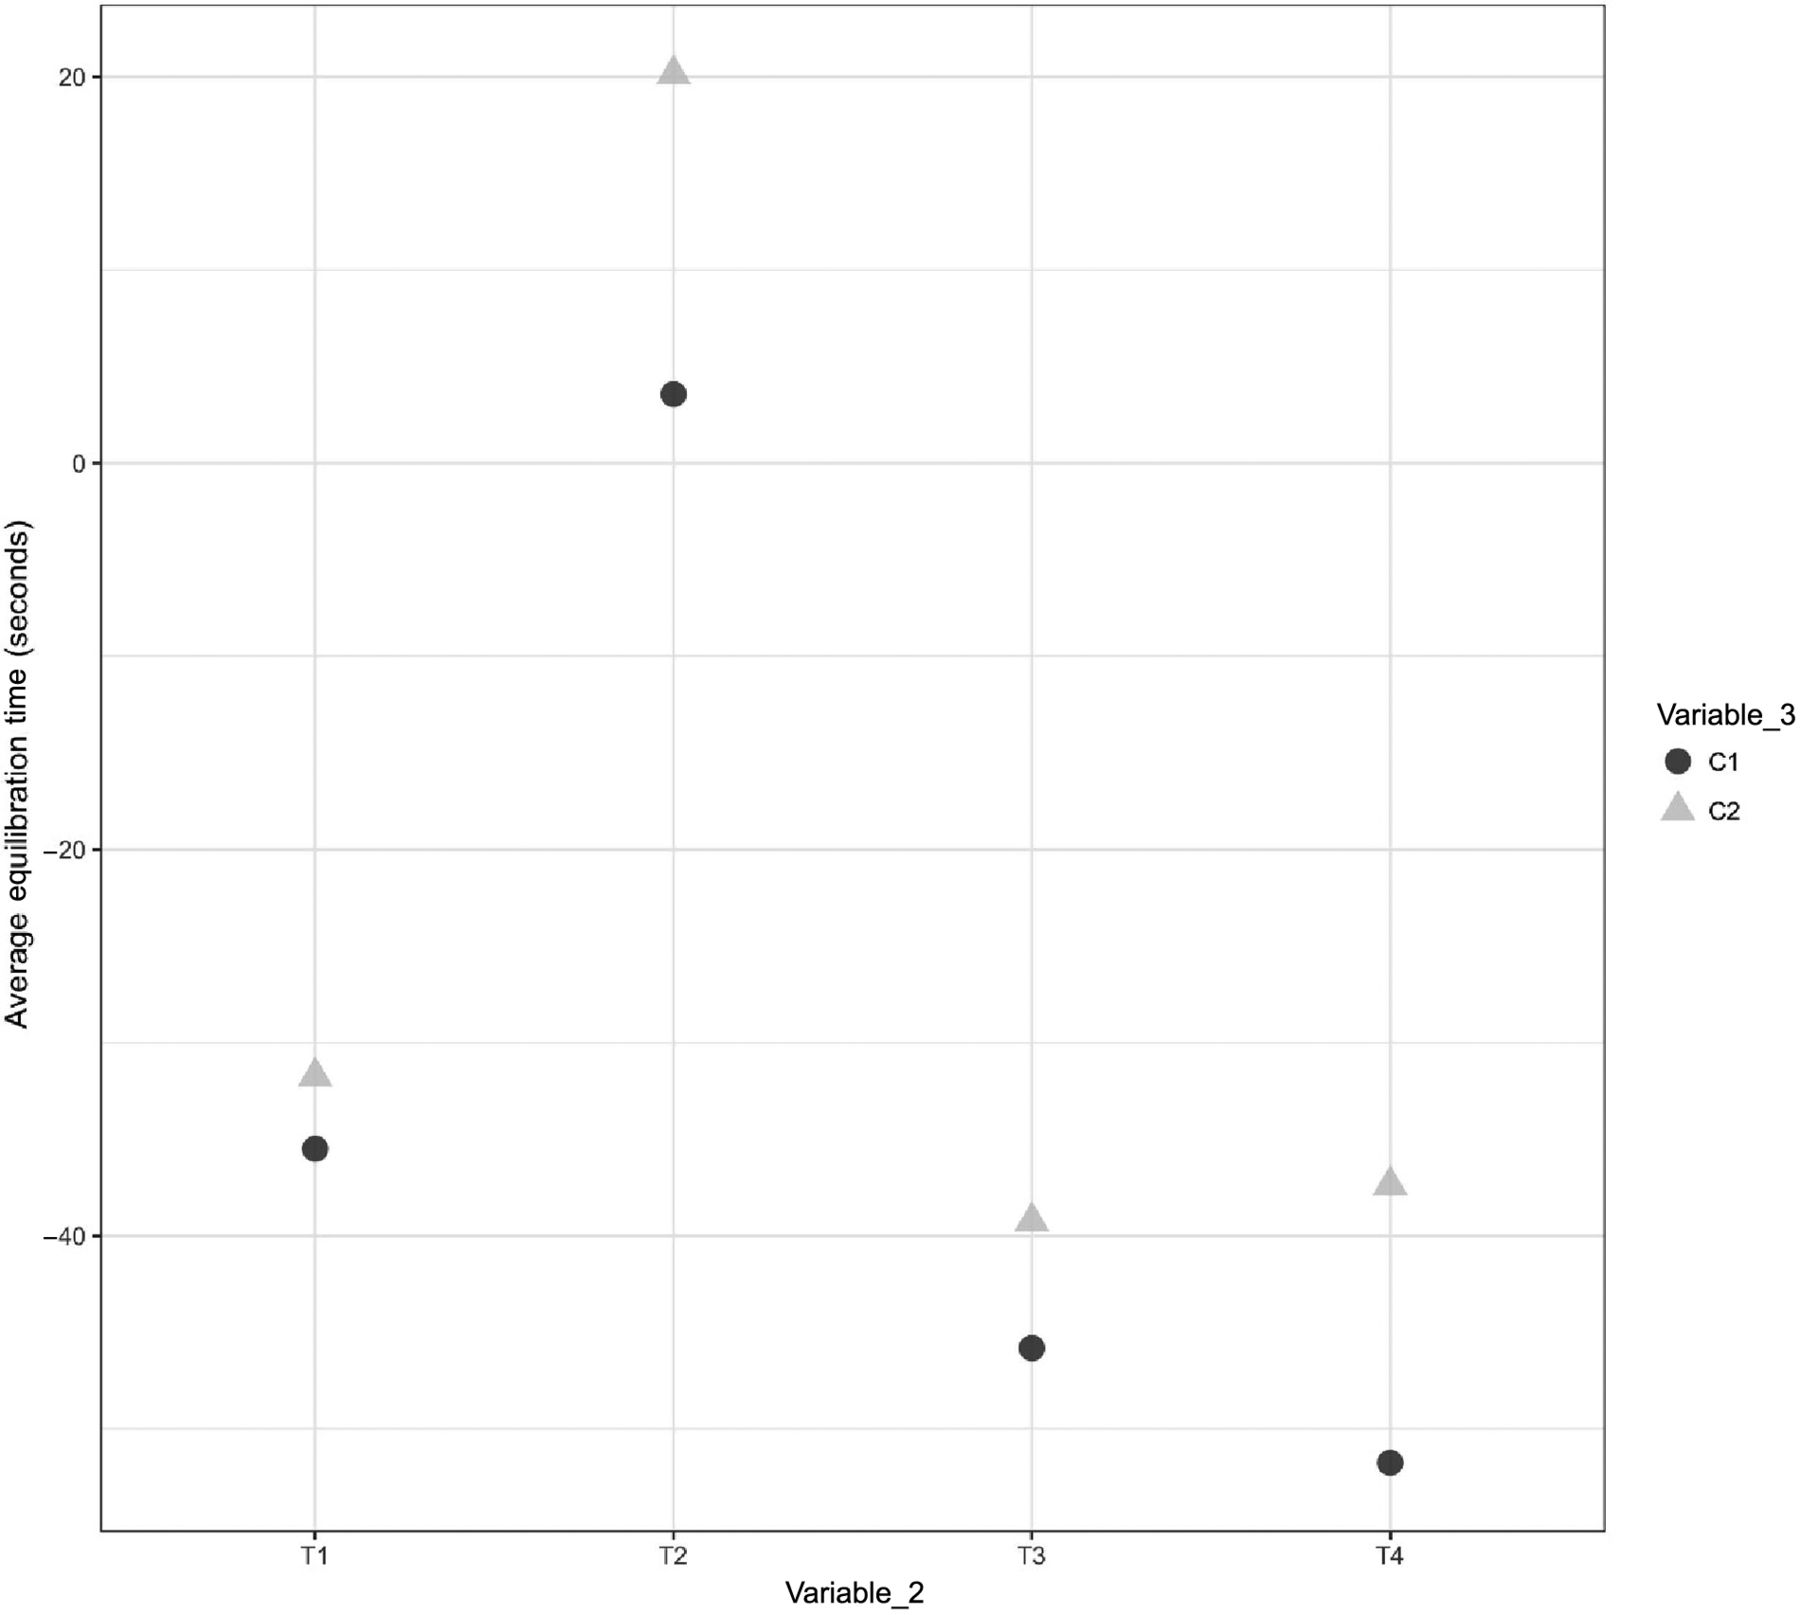
Location of the Dry Goods Load Item inside the Autoclave (Variable 3)
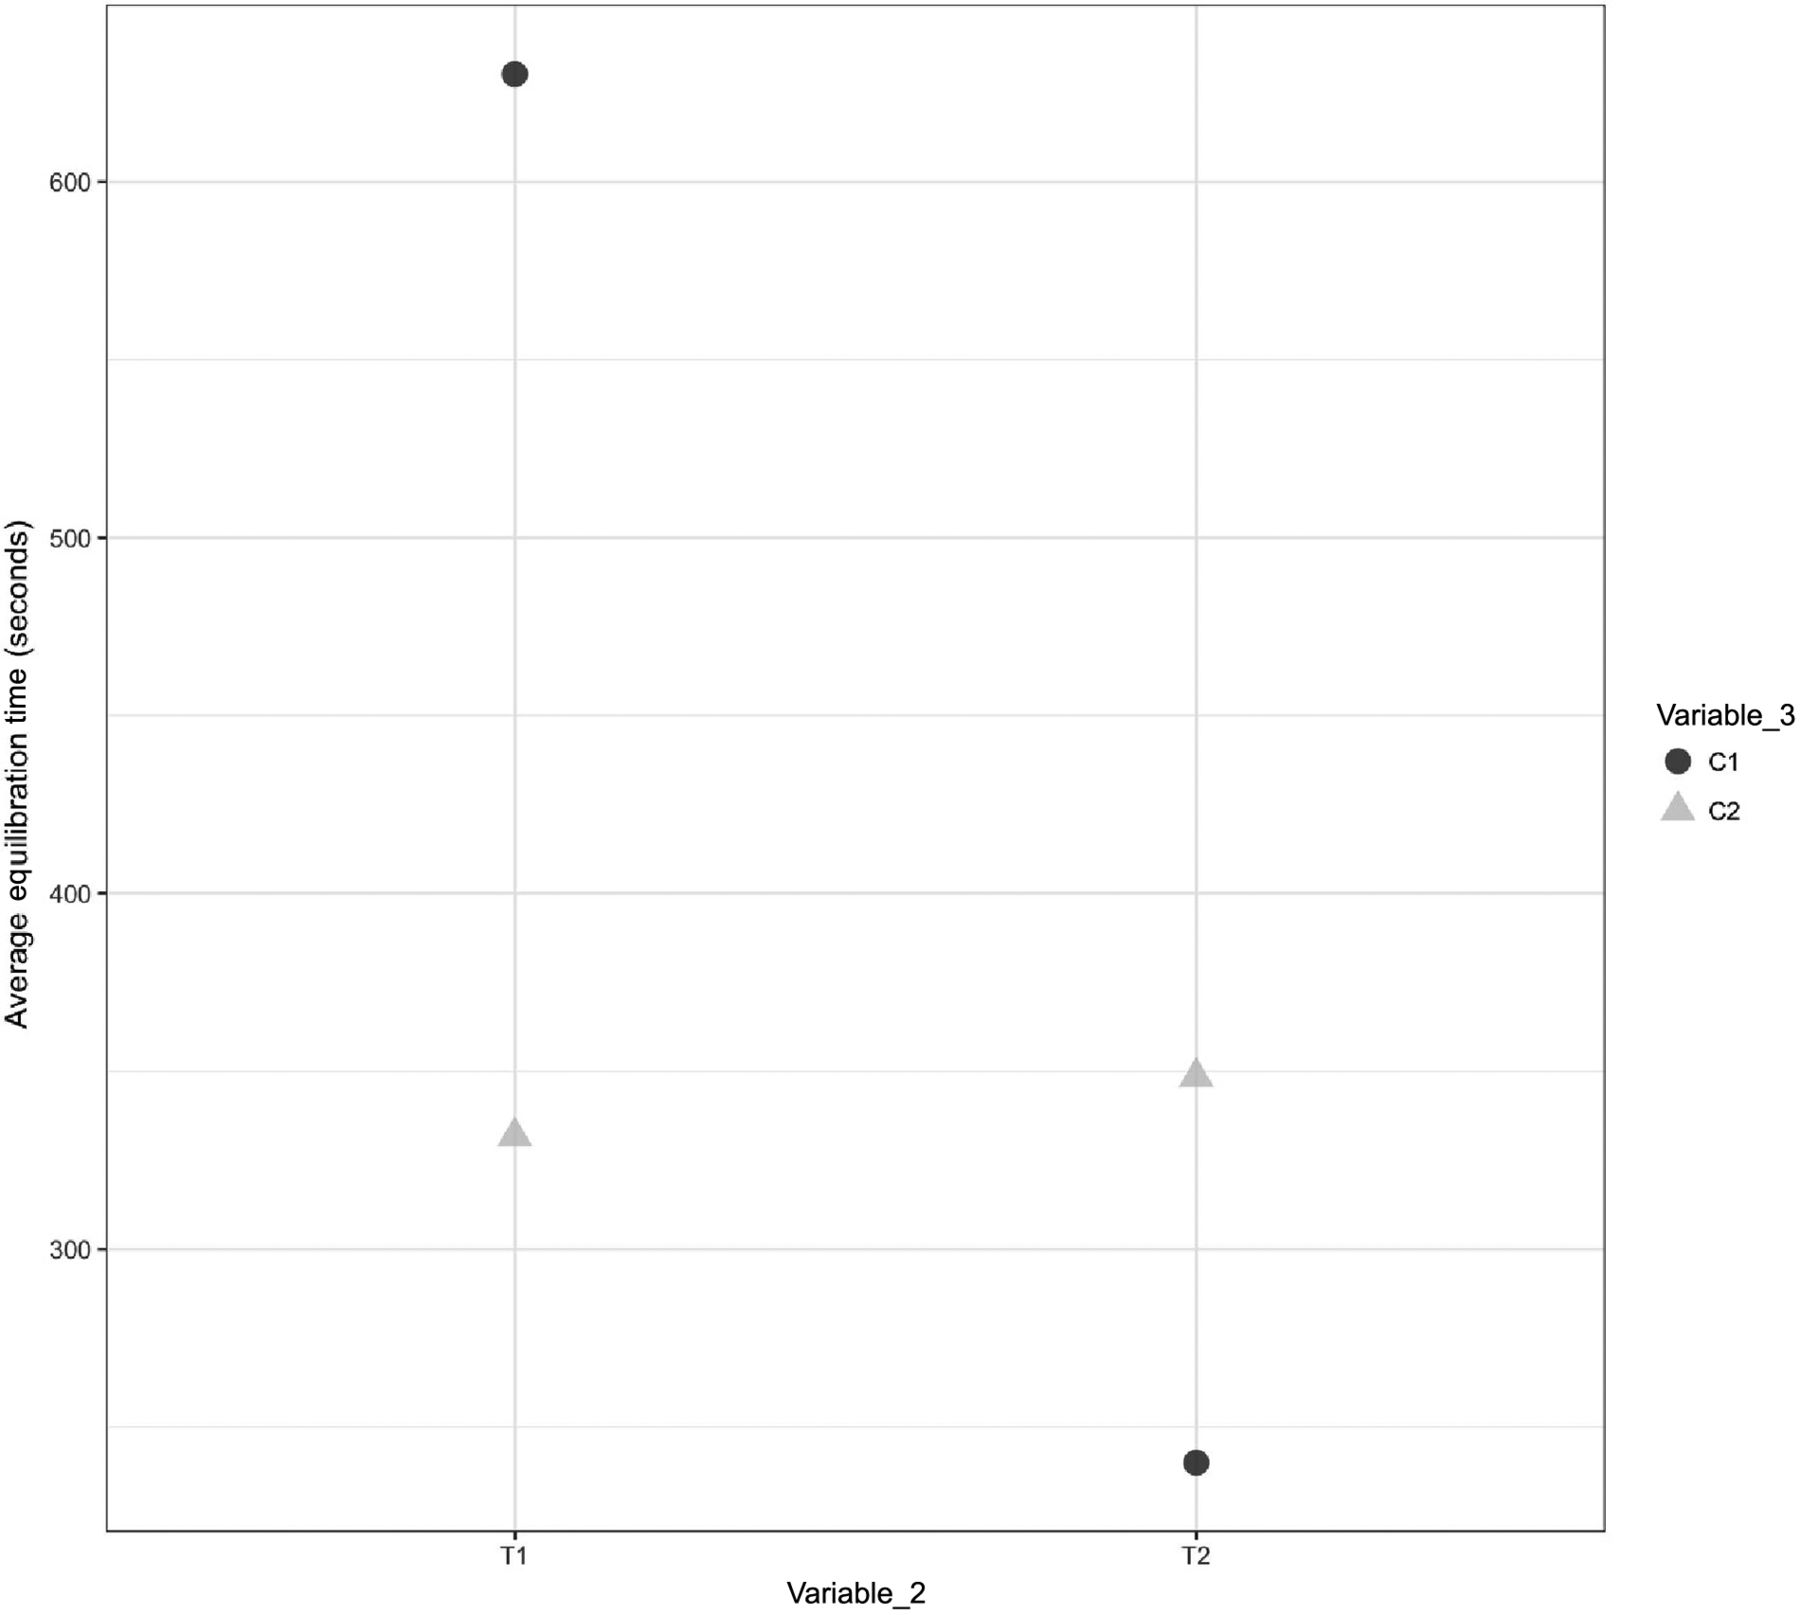
A comparison was performed to understand the impact of Variable 3 on the equilibration of Items 1, 2, and 3. The results are depicted in Figures 18, 19, and 20 for Items 1, 2, and 3, respectively.

Effects of Variable 3 on the equilibration of Item 1.

Effects of Variable 3 on the equilibration of Item 2.

Effects of Variable 3 on the equilibration of Item 3.
In Figures 18, 19, and 20, the X-axis represents T1 and T2 of Variable 2 and the Y-axis represents the average values of the equilibration time. Variable 3 is represented by different shapes and colors. For Items 1 and 2, each data point represents the average values of the equilibration time observed at TC placement locations T1 and T2 (Variable 2) across all maximum loading tests. For Item 3, each data point represents the average values of the equilibration time observed at TC placement locations T1, T2, T3, and T4 (Variable 2) across all maximum loading tests. The following observations are made from these figures:
Observation 8: Minor distinction is observed between Item 1 placed on Cart 1 (i.e., C1) compared with Item 1 placed on Cart 2 (i.e., C2). This distinction is consistent across TC placement locations T1 and T2 (Variable 2) for Item 1. Compare C1 and C2 in Figure 18.
Observation 9: Minor distinction is observed between Item 2 placed on Cart 1 (i.e., C1) compared with Item 2 placed on Cart 2 (i.e., C2). However, this distinction is not consistent across TC placement locations T1 and T2 (Variable 2) for Item 2. Compare C1 and C2 in Figure 19.
Observation 10: No significant distinction is observed between Item 3 placed on Cart 1 (i.e., C1) compared with Item 3 placed on Cart 2 (i.e., C2). Compare C1 and C2 in Figure 20.
Orientation of the Dry Goods Item inside the Autoclave Chamber (Variable 4)
A comparison was performed to understand the impact of Variable 4 on the equilibration of Items 1 and 2. The results are depicted in Figures 12 and 13 for Items 1 and 2, respectively.
In Figures 12 and 13, the X-axis represents the 12 maximum loading tests performed for Items 1 and 2 and the Y-axis represents the equilibration time data. Variable 3 is represented by different shapes. For Item 1, each test consists of 36 test items that are represented by 72 individual data points, and for Item 2, each test consists of 24 test items that are represented by 48 individual data points. The following observations are made from these figures:
Observation 11: Item 1 in Orientation 1 (i.e., O1) seems to take longer to equilibrate than Item 1 in Orientation 2 (i.e., O2). Compare O1 and O2 in Figure 12. However, from the data provided in Table III, it is observed that the majority of the tests performed for Item 1 in Orientation O1 had higher average values of Variable 7 than the tests performed for Item 1 in Orientation O2. Based on this, clearly the effect of Variable 4 was confounded by the effect of Variable 7 during tests performed for Item 1.
Observation 12: No significant distinction is observed between Item 2 in Orientation 1 (i.e., O1) compared with Item 2 in Orientation 2 (i.e., O2). Compare O1 and O2 in Figure 13. Based on Observation 11, to mask the effect of Variable 7 on Variable 4, the temperature of Item 2 at the start of the sterilization cycle (Variable 7) was actively controlled to be at room temperature for all tests of Item 2. This is evident from the data of average values of Variable 7 for Item 2 tests provided in Table IV.
Start Conditions of Tests Performed for Item 1
Start Conditions of Tests Performed for Item 2
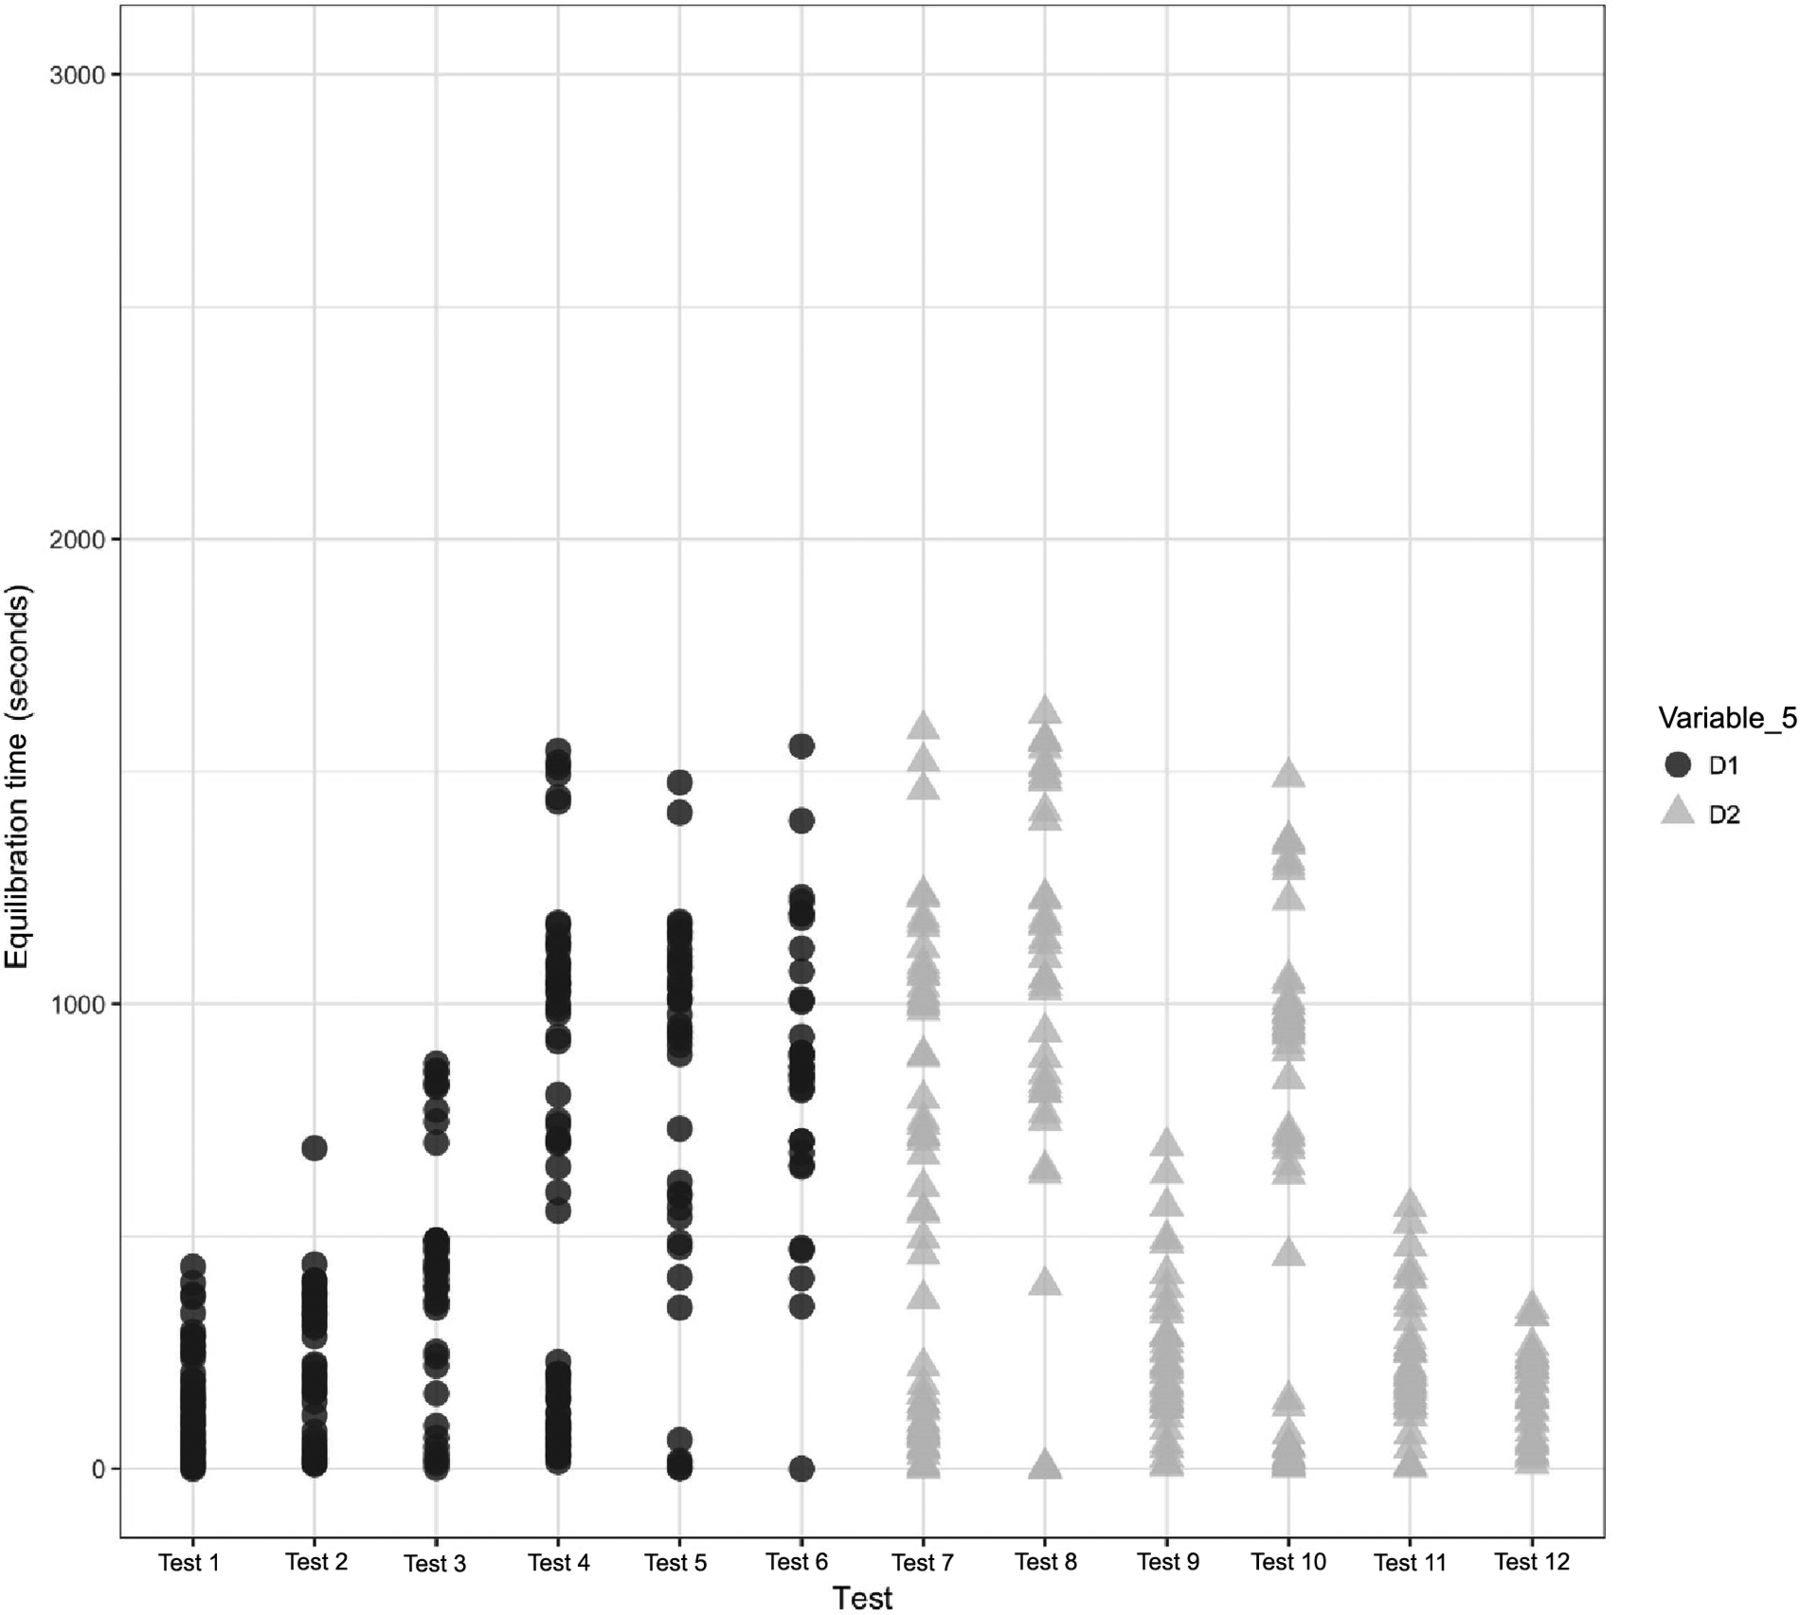
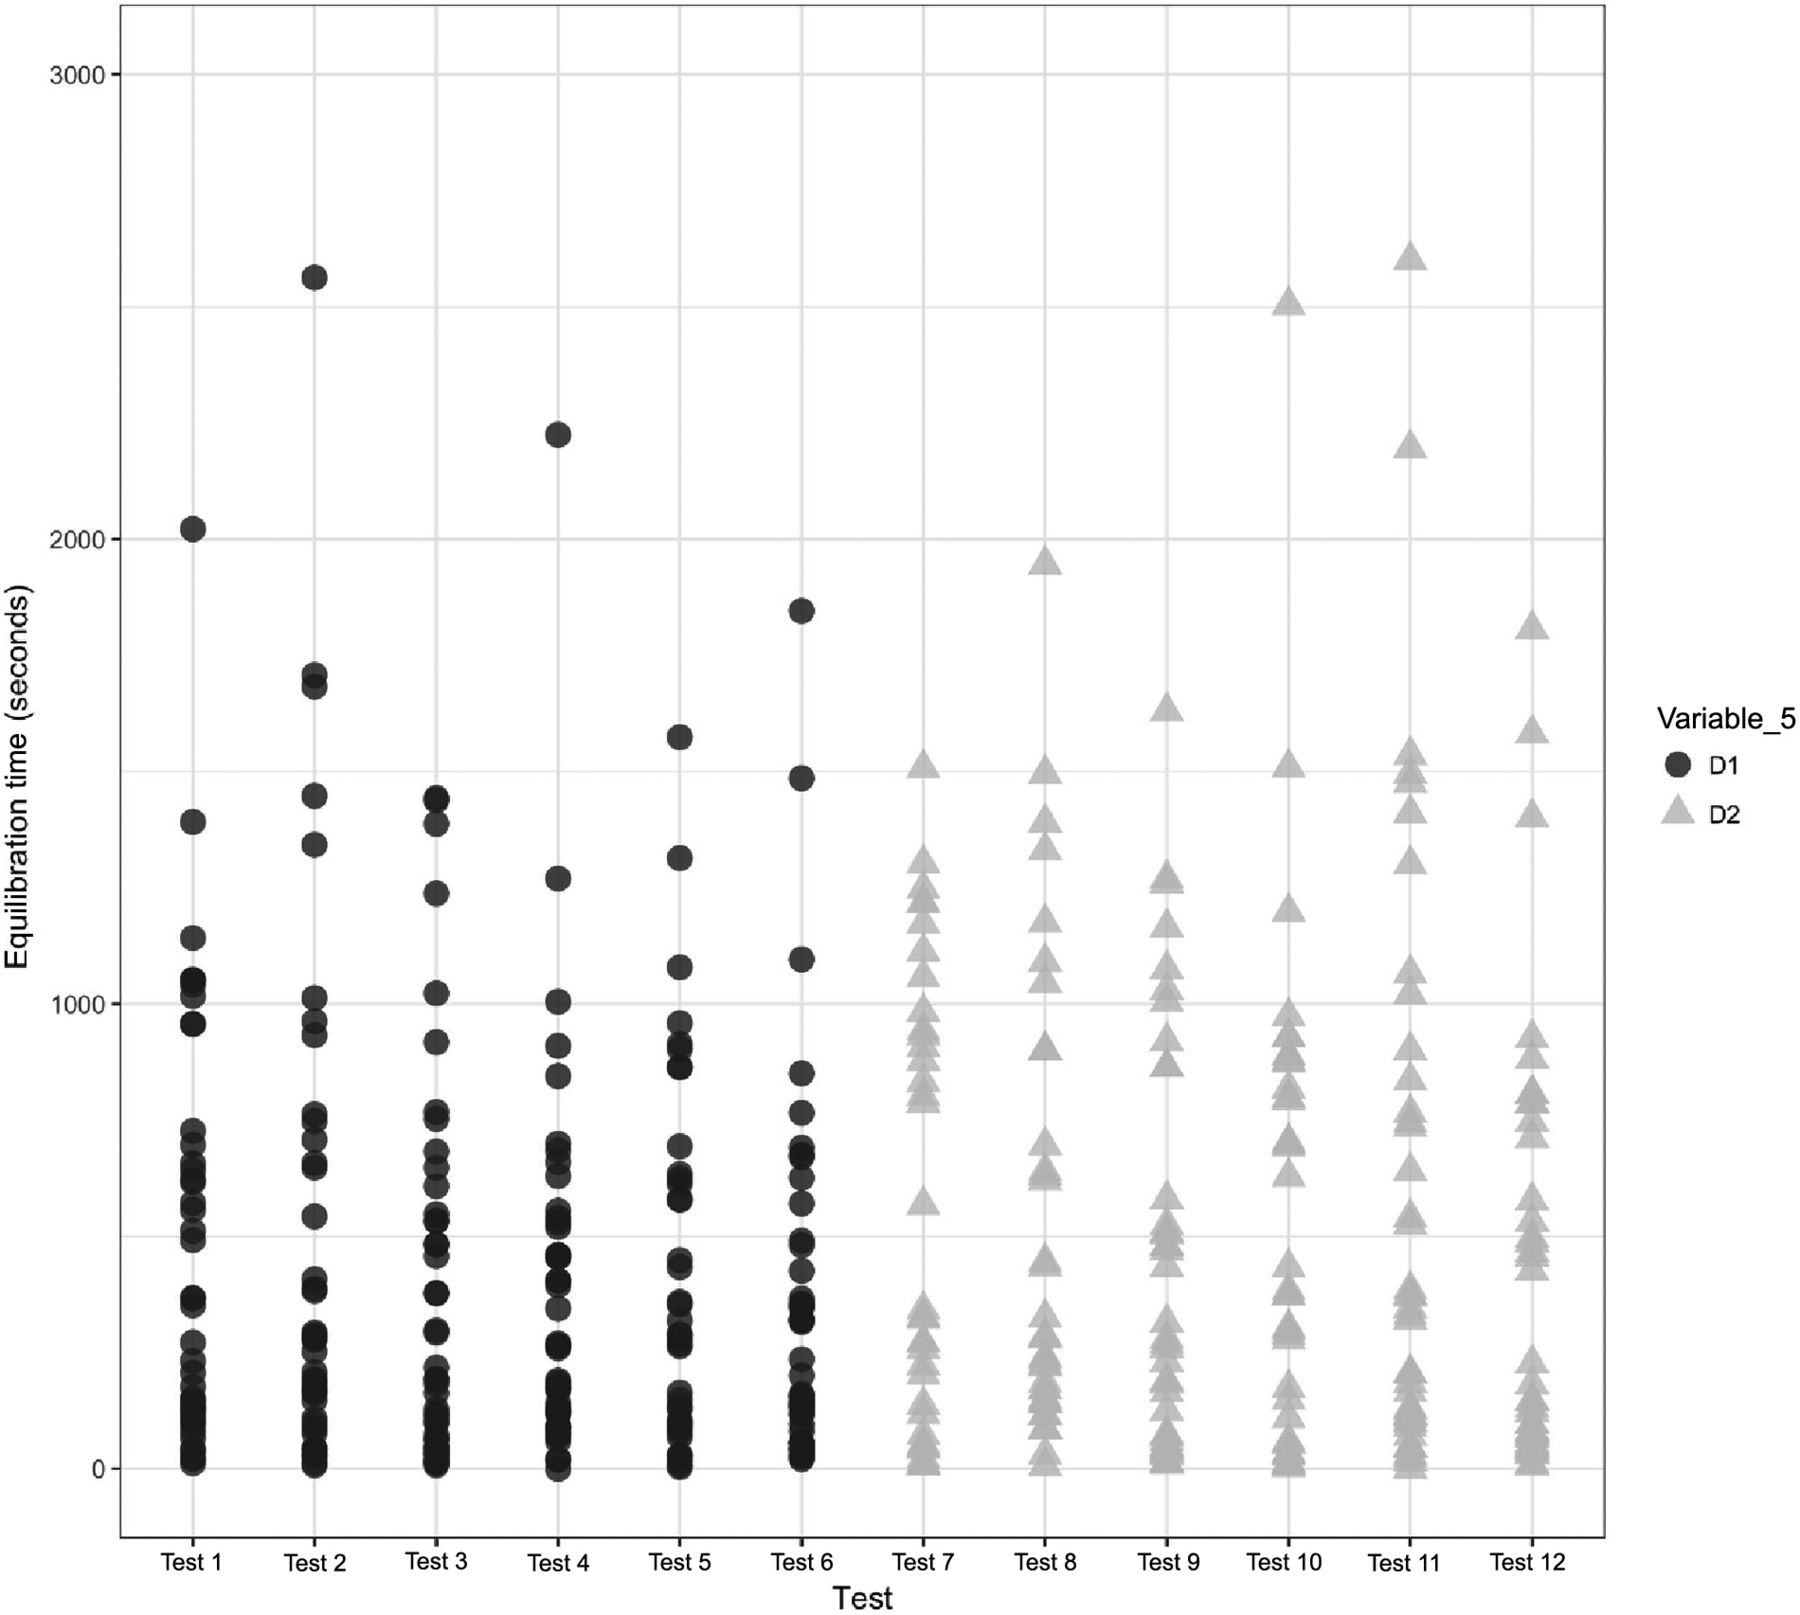
Number of Coils of a Tubing Element (Variable 5)
A comparison was performed to understand the impact of Variable 5 on the equilibration of Items 1 and 2. The results of the same are depicted in Figures 21 and 22 for Items 1 and 2, respectively.

Effects of Variable 5 on the equilibration of Item 1.

Effects of Variable 5 on the equilibration of Item 2.
In Figures 21 and 22, the X-axis represents the 12 maximum loading tests performed for Items 1 and 2 and the Y-axis represents the equilibration time data. Variable 5 is represented by different colors. For Item 1, each test consists of 36 test items that are represented by 72 individual data points, and for Item 2, each test consists of 24 test items that are represented by 48 individual data points. The following observations are made from these figures:
Observation 13: No significant distinction is observed between Item 1 with multiple coils of tubing element (i.e., D1) compared with Item 1 with a single coil of tubing element (i.e., D2). Compare D1 and D2 in Figure 21.
Observation 14: No significant distinction is observed between Item 2 with multiple coils of tubing element (i.e., D1) compared with Item 2 with a single coil of tubing element (i.e., D2). Compare D1 and D2 in Figure 22.
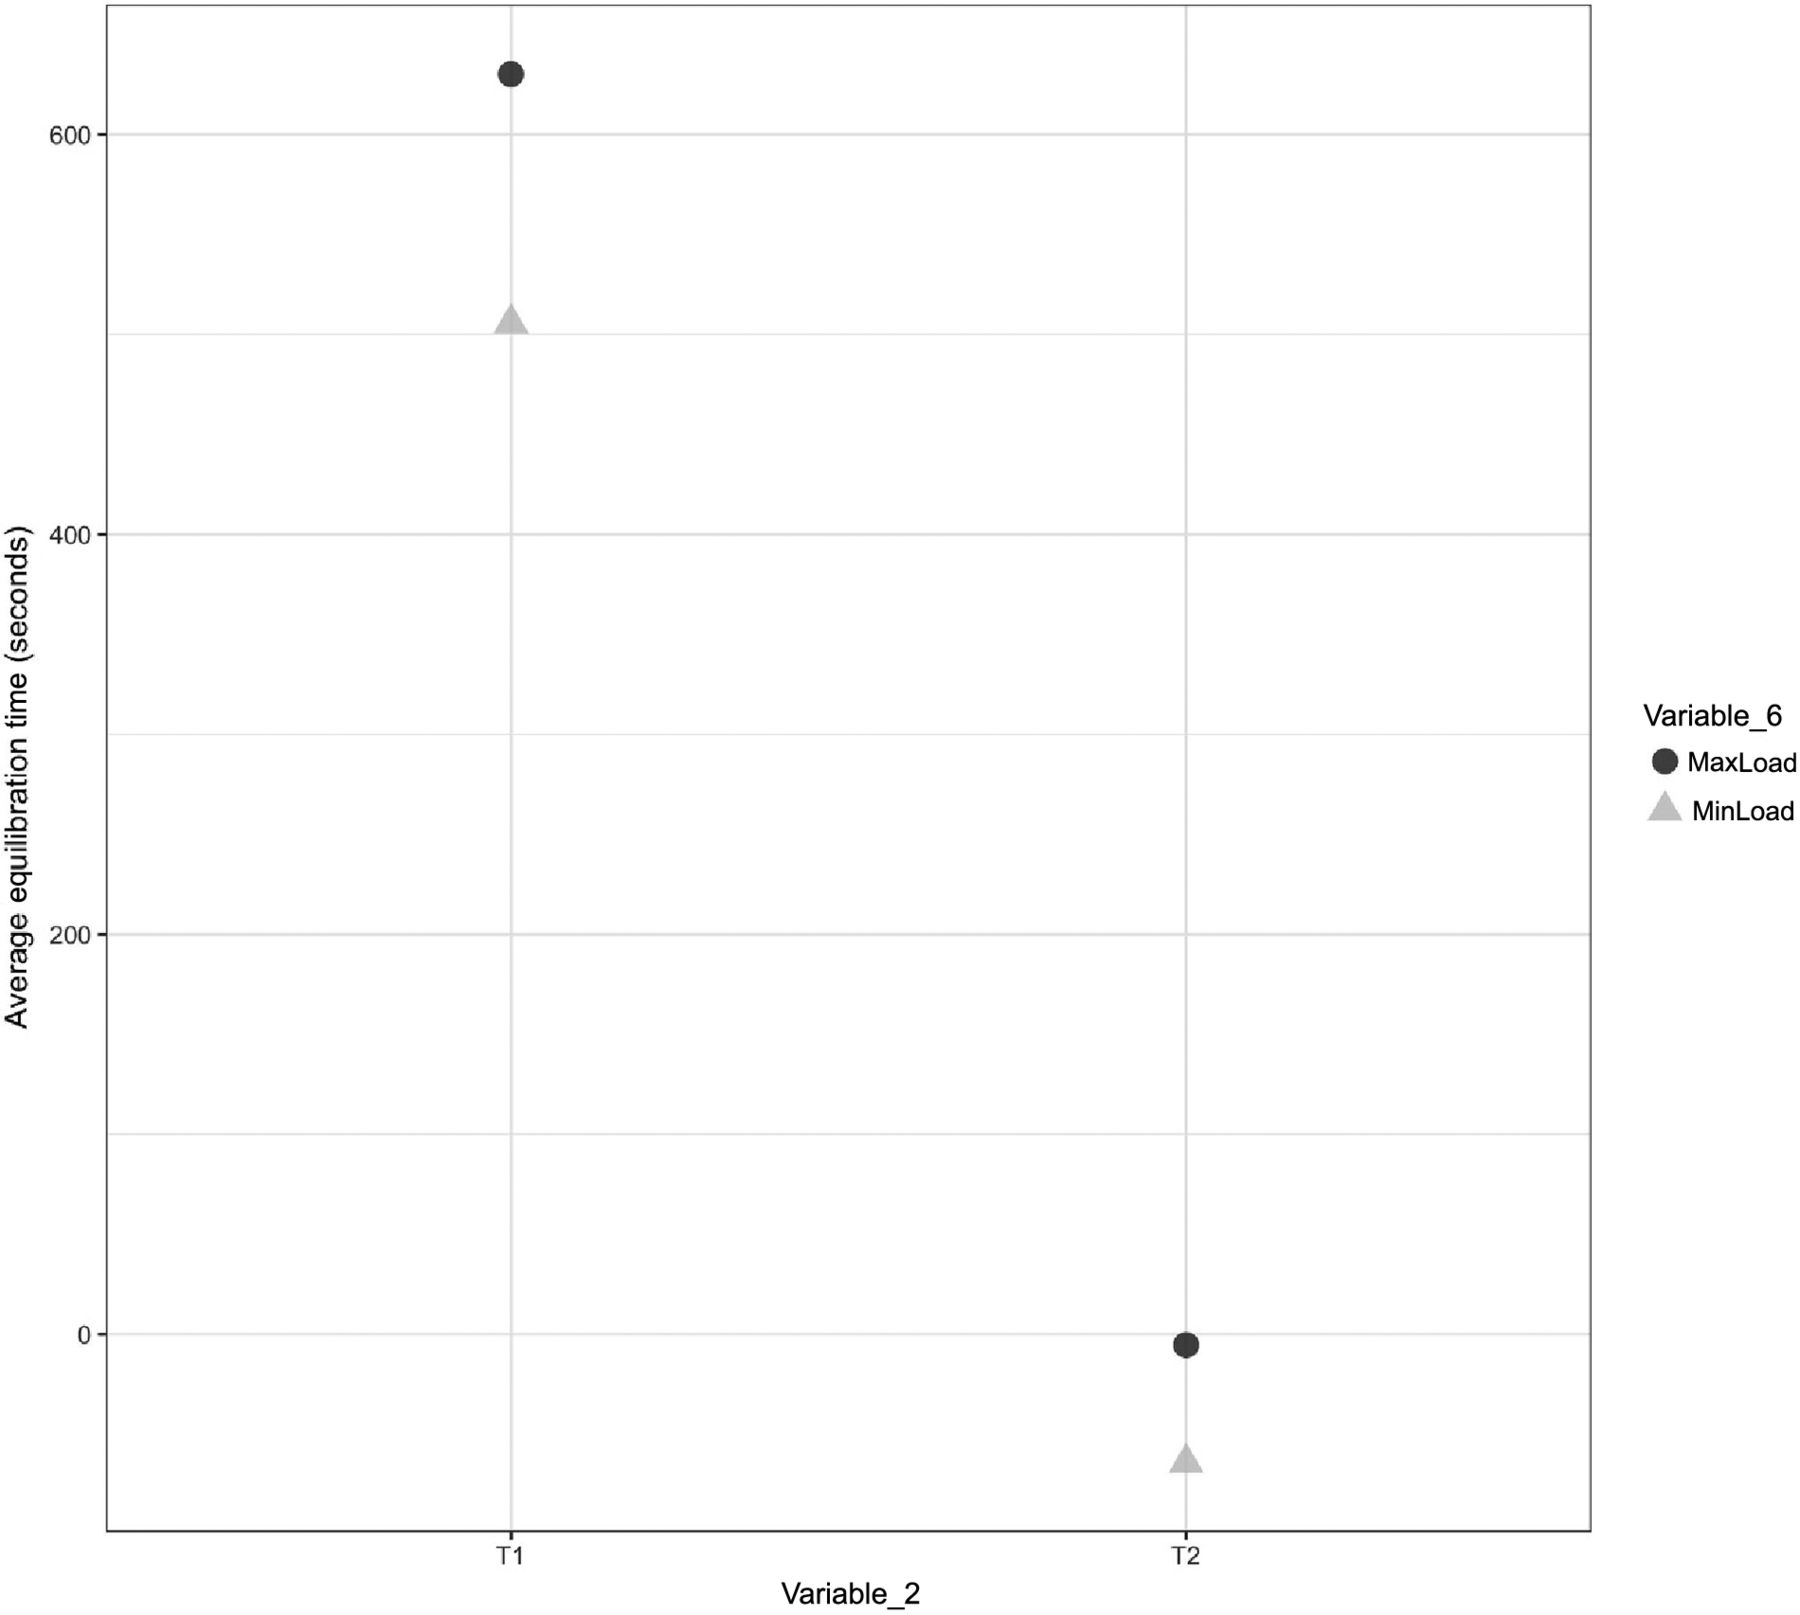
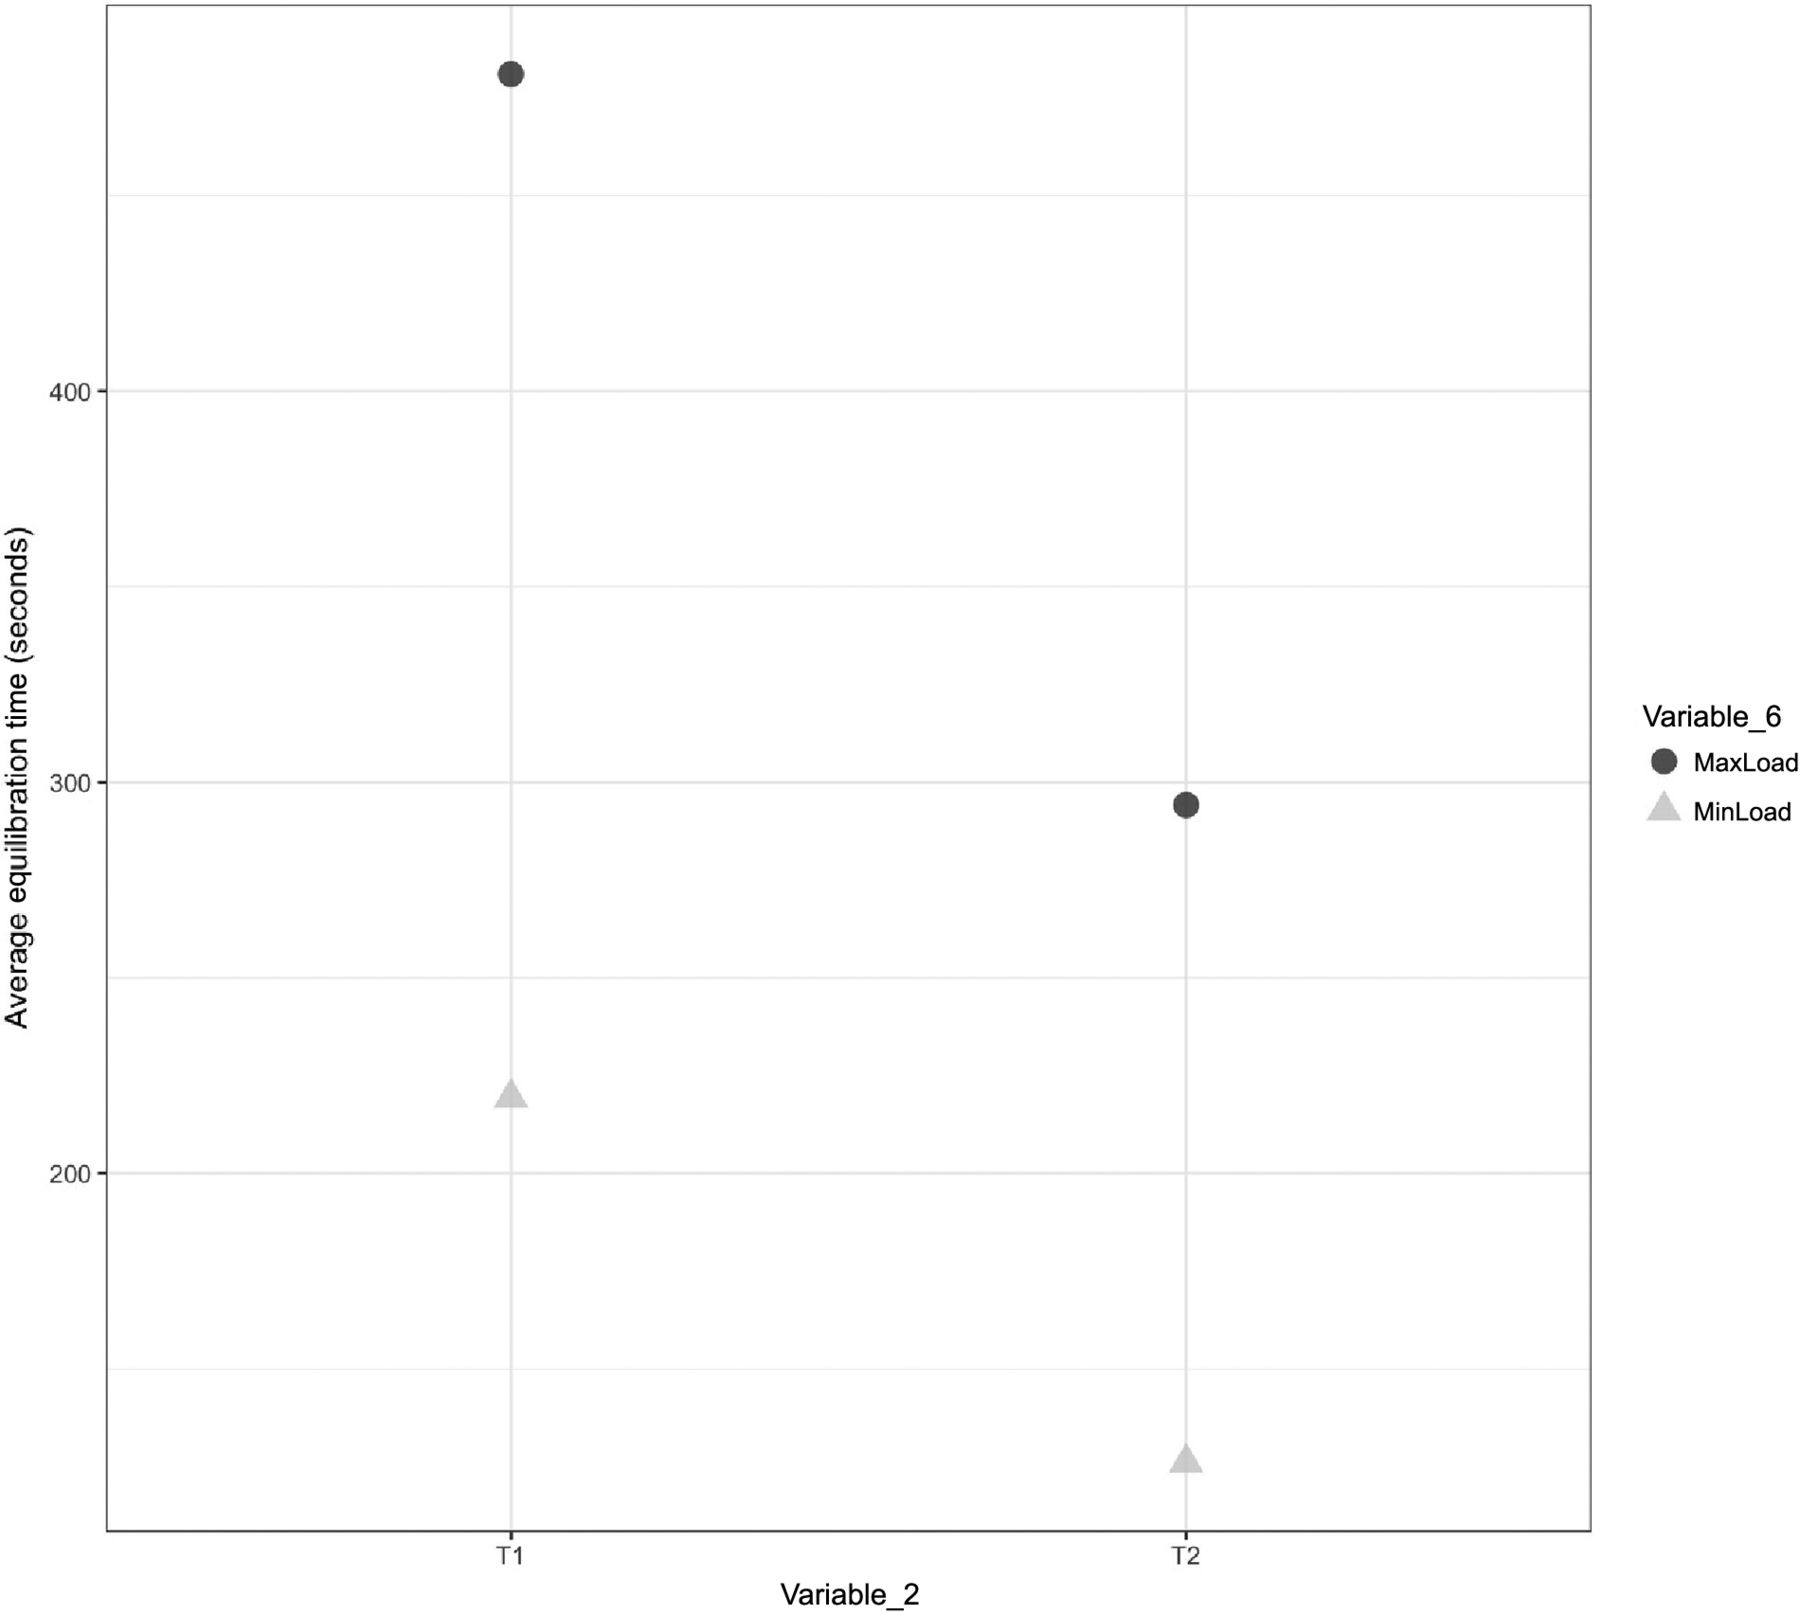
Total Thermal Mass of the Dry Goods Load Item Placed within the Autoclave (Variable 6)
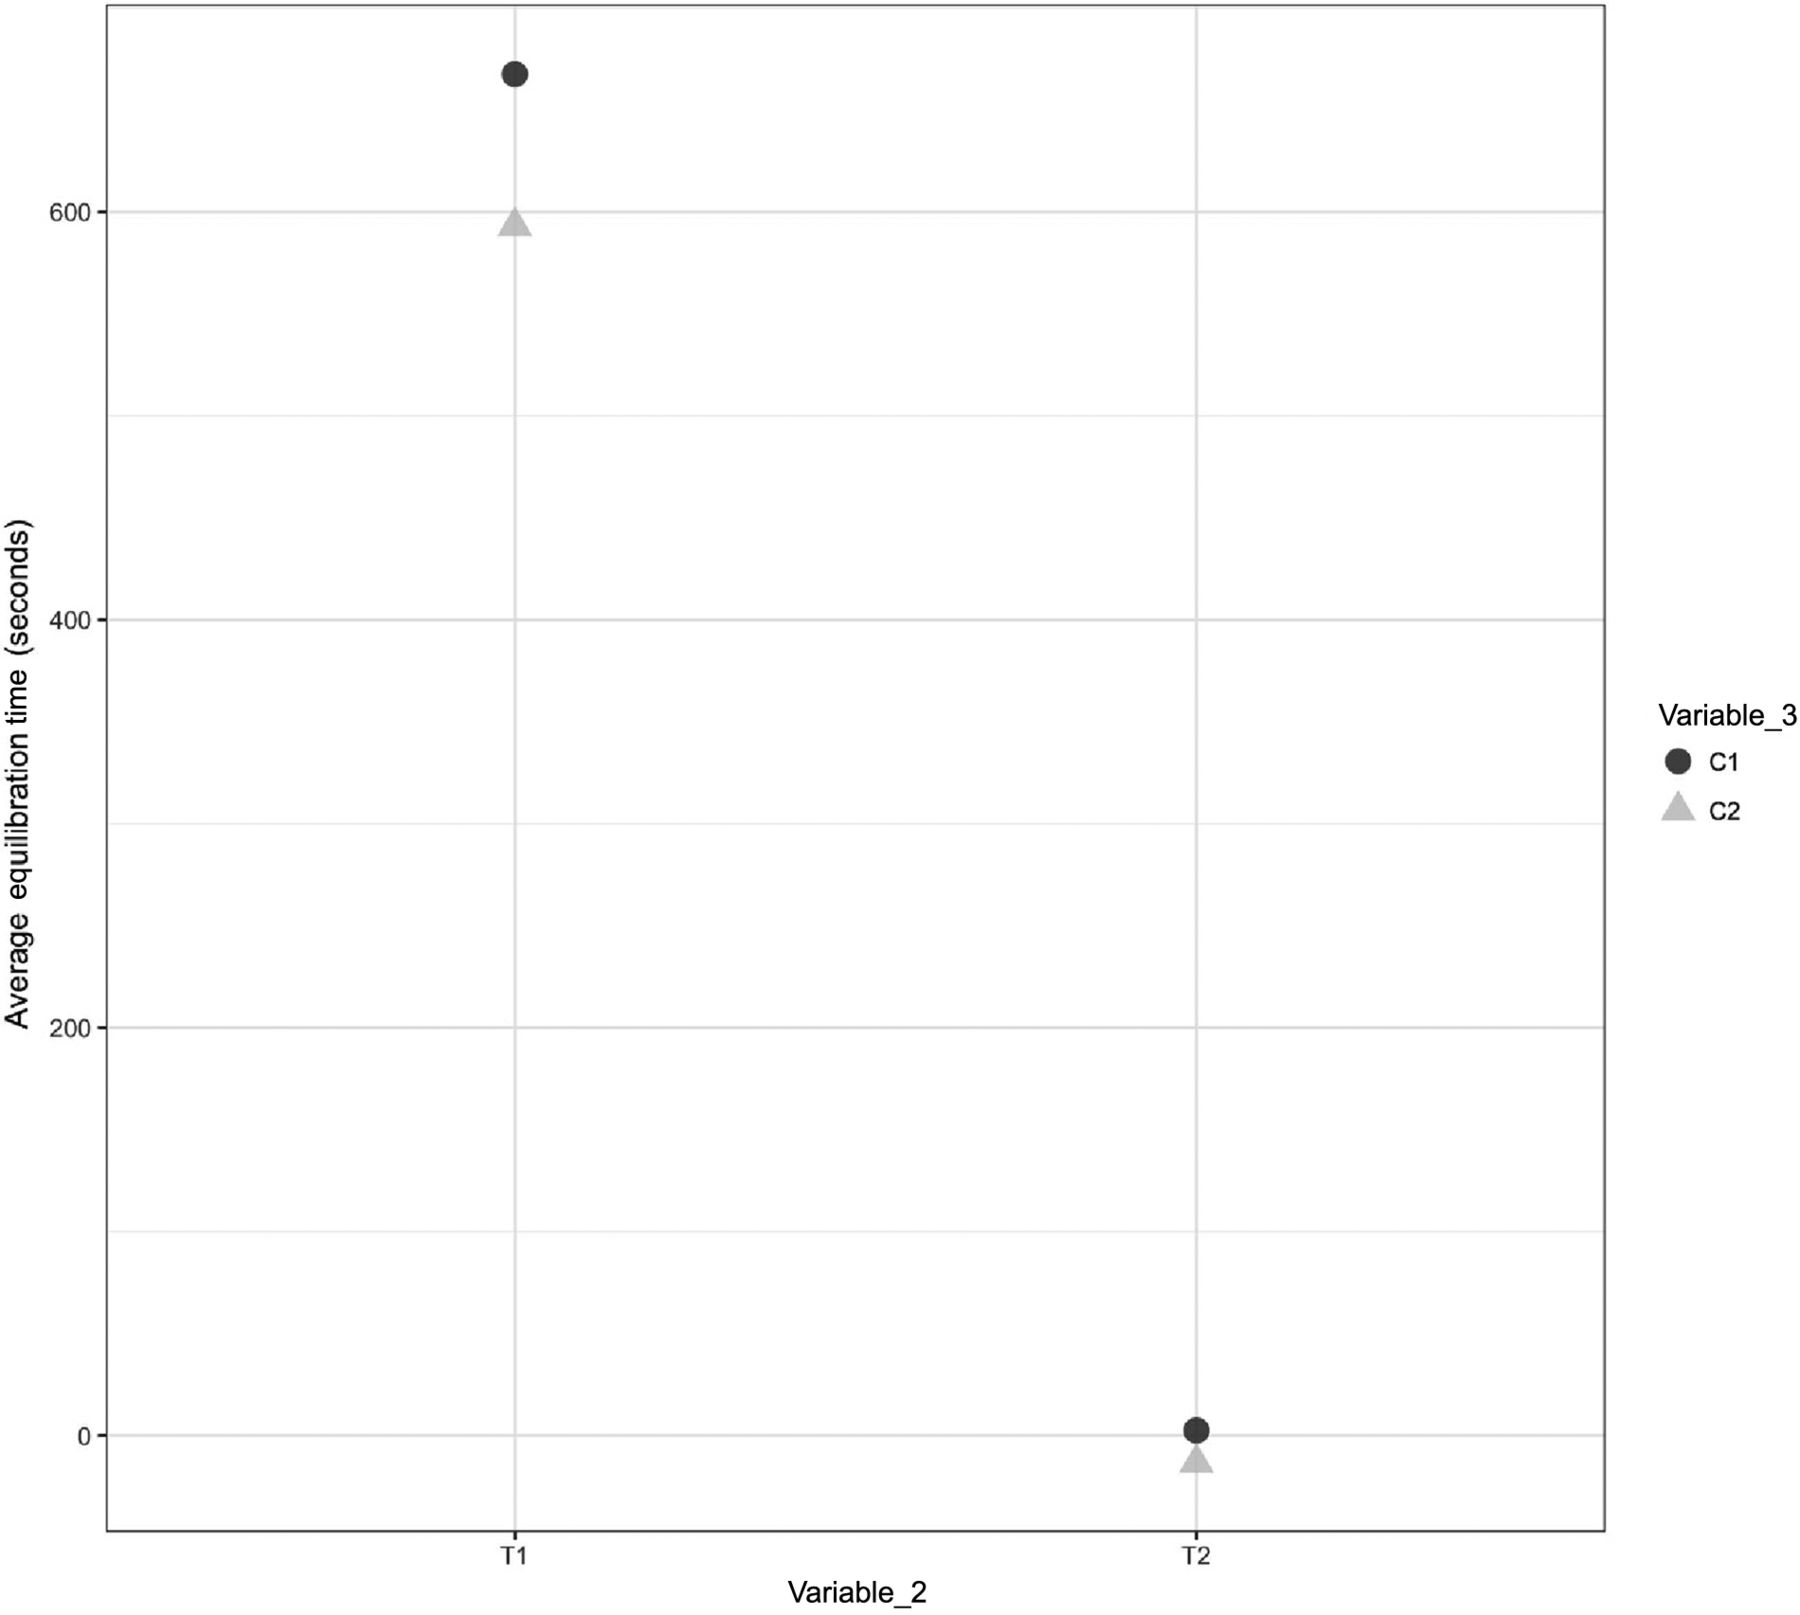
A comparison was performed to understand the impact of Variable 6 on the equilibration of Items 1, 2, and 3. The results of the same are depicted in Figures 23, 24, and 25 for Items 1, 2, and 3, respectively.

Effects of Variable 6 on the equilibration of Item 1.

Effects of Variable 6 on the equilibration of Item 2.

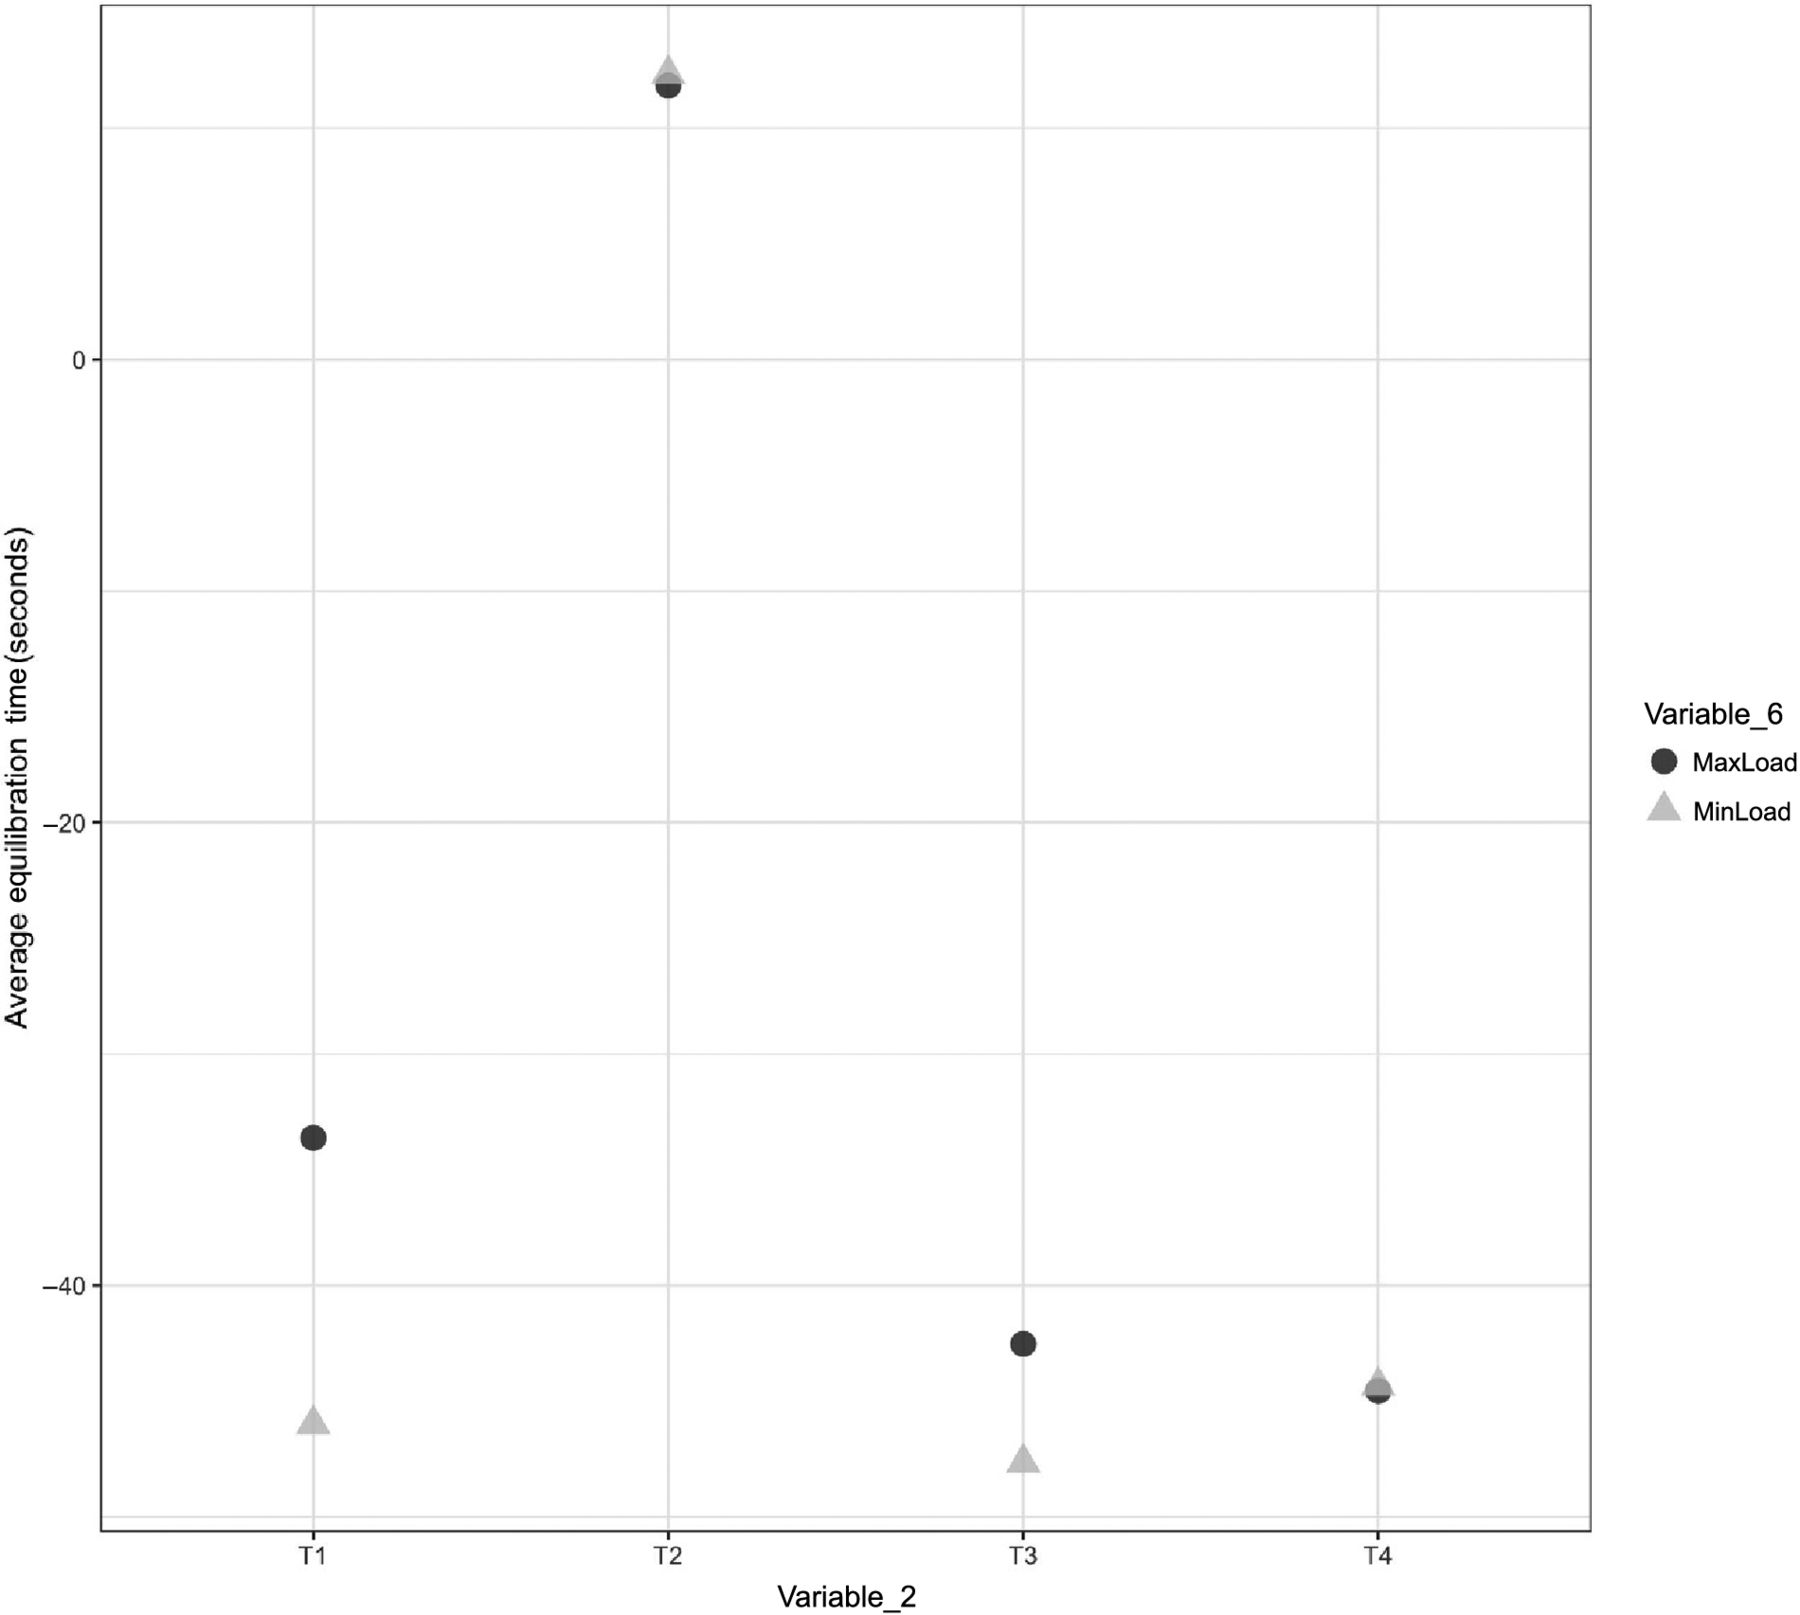
Effects of Variable 6 on the equilibration of Item 3.
In Figures 23, 24, and 25, the X-axis represents T1 and T2 of Variable 2 and the Y-axis represents the average values of the equilibration time. Variable 6 is represented by different shapes and colors. For Items 1 and 2, each maximum load data point represents the average values of the equilibration time observed at TC placement locations T1 and T2 (Variable 2) across all maximum loading tests, and each minimum load data point represents the average values of the equilibration time observed at TC placement locations T1 and T2 (Variable 2) across all minimum loading tests. For Item 3, each maximum load data point represents the average values of the equilibration time observed at TC placement locations T1, T2, T3, and T4 (Variable 2) across all maximum loading tests, and each minimum load data point represents the average values of the equilibration time observed at TC placement locations T1, T2, T3, and T4 (Variable 2) across all minimum loading tests. The following observations are made from these figures:
Observation 15: Minor distinction is observed between Item 1 in maximum loading tests compared with Item 1 in minimum loading tests. This distinction is consistent across TC placement locations T1 and T2 (Variable 2) for Item 1. Compare maximum load and minimum load in Figure 23.
Observation 16: Minor distinction is observed be-tween Item 2 in maximum loading tests compared with Item 2 in minimum loading tests. This distinction is consistent across TC placement locations T1 and T2 (Variable 2) for Item 2. Compare maximum load and minimum load in Figure 24.
Observation 17: No significant distinction is observed between Item 3 in maximum loading tests compared with Item 3 in minimum loading tests. Compare maximum load and minimum load in Figure 25.
Temperature of the Dry Goods Load Items at the Start of the Sterilization Cycle (Variable 7)
A comparison was performed to understand the impact of Variable 7 on the equilibration of Item 1. The results are depicted in Figure 26.

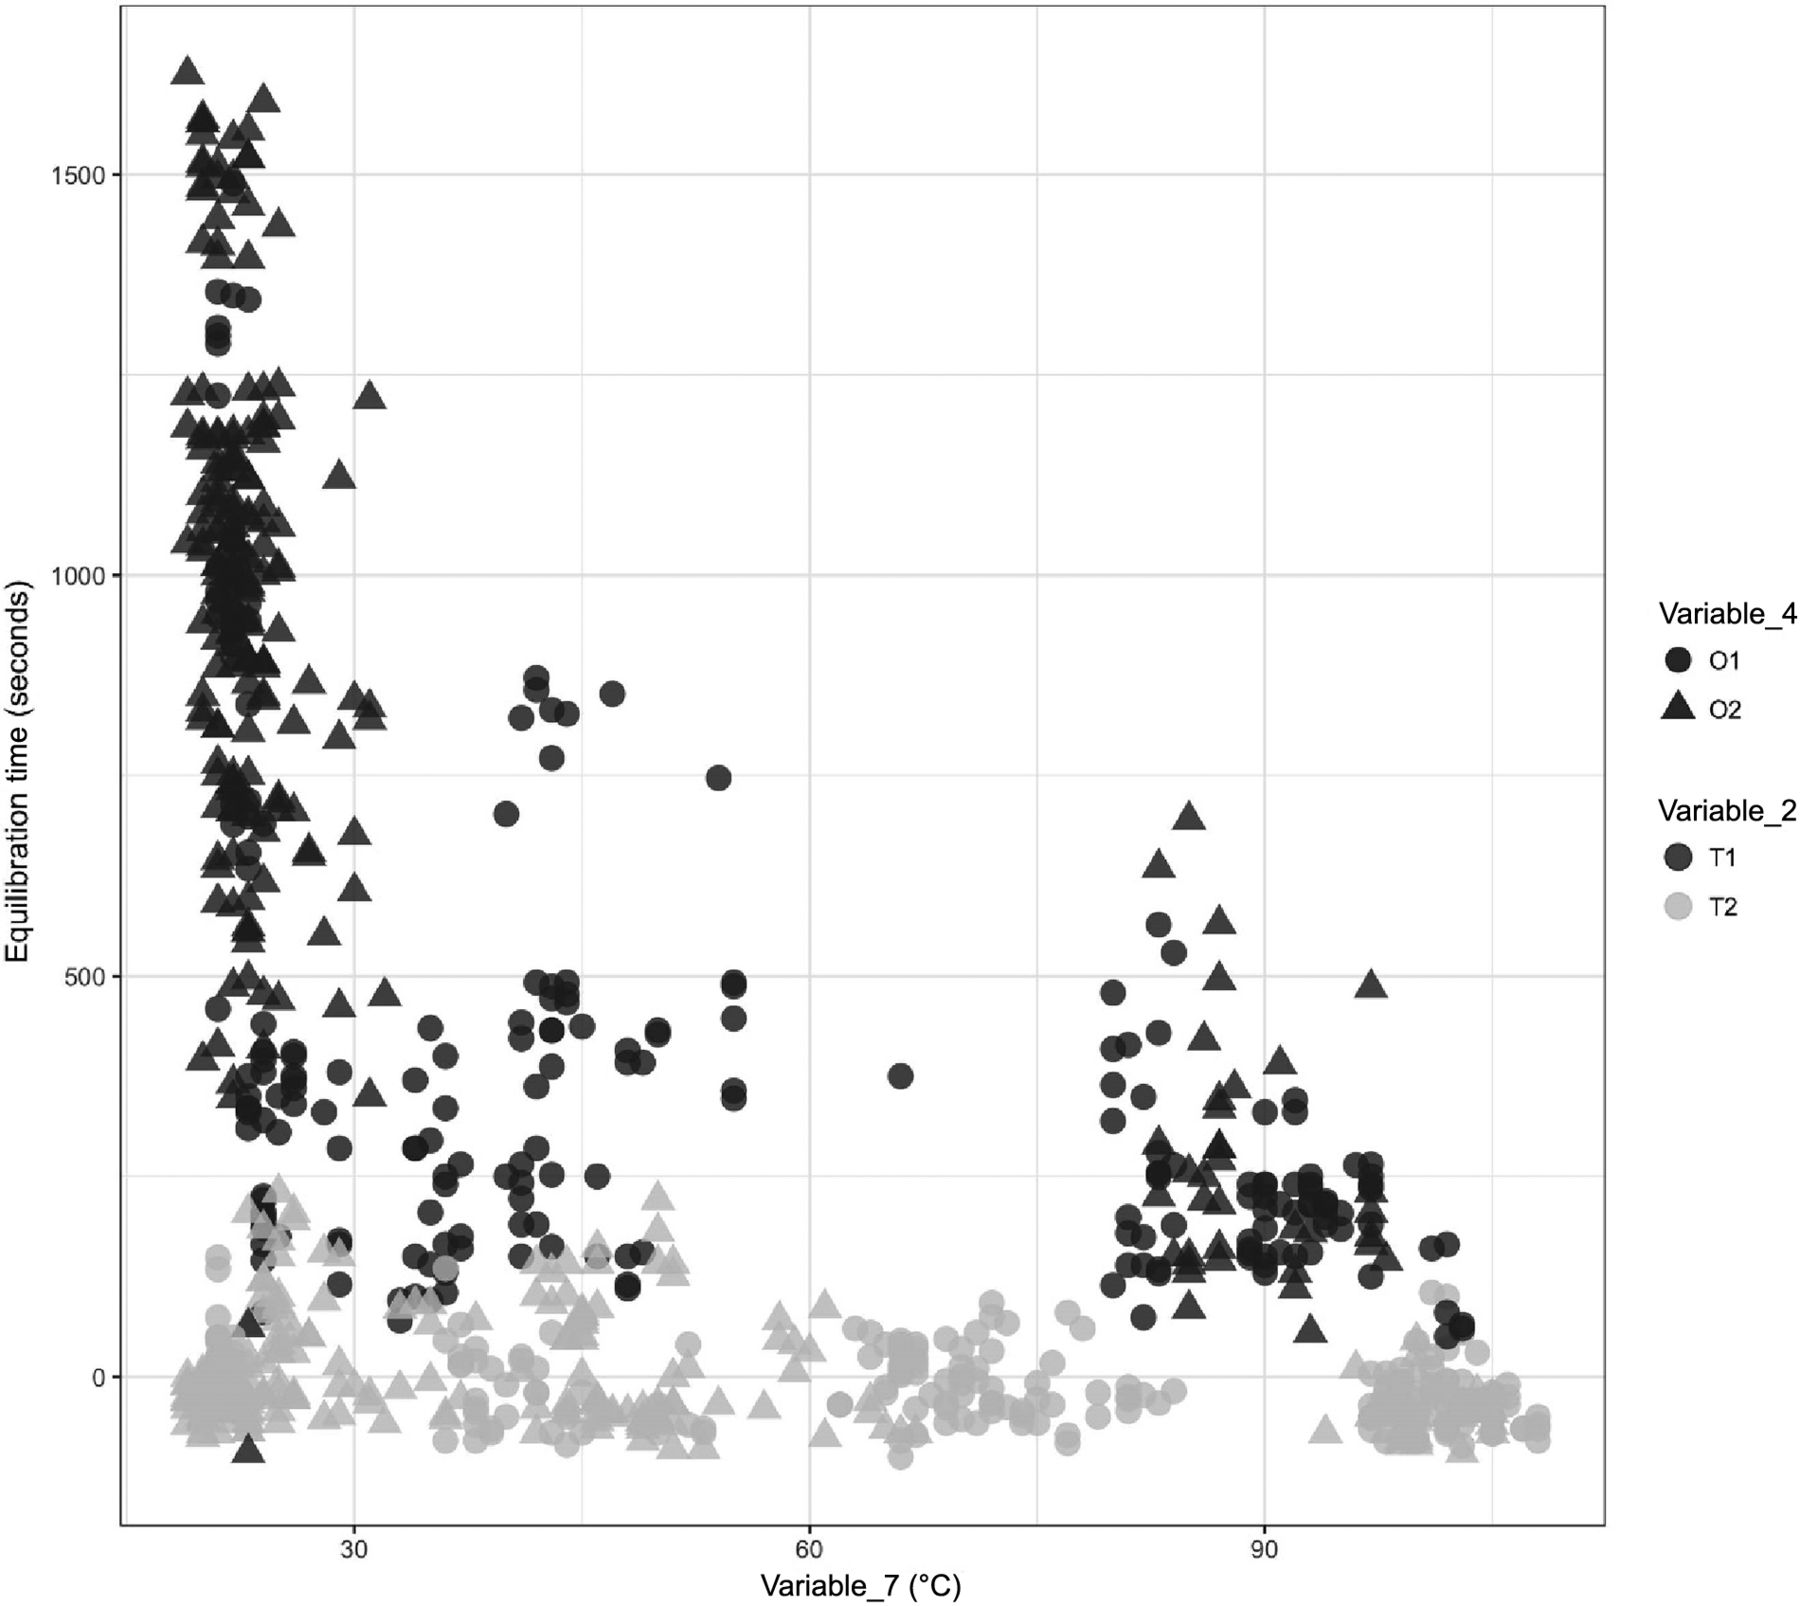
Effects of Variable 7 on the equilibration of Item 1.
In Figure 26, the X-axis represents Variable 7 during the 12 maximum loading tests performed for Item 1 and the Y-axis represents the equilibration time data. Variable 2 is represented by different shapes and Variable 4 is represented by different colors. There are 864 data points from the 12 maximum loading tests of Item 1 in Figure 26, where each data point represents the start temperature of the dry goods load item at the start of the sterilization cycle. The following observations are made from these figures:
Observation 18: Higher temperatures of the dry goods load items at the start of the sterilization cycle lead to significantly lower equilibration times for TCs placed within the filter element of Item 1 (i.e., T1 of Variable 2). Compare T1 with Variable 7 in Figure 26.
Observation 19: No clear difference is observed in the equilibration times measured for different temperatures of the dry goods load items at the start of the sterilization cycle for TCs placed within the tubing element of Item 1 (i.e., T2 of Variable 2). Compare T2 with Variable 7 in Figure 26.
Presence of Moisture in Dry Goods Load Items at the Start of the Sterilization Cycle (Variable 8)
During preparation of Item 3 for maximum loading Test 1, the eight filter elements used for testing were flushed with water before the test. However, during preparation of Item 3 for maximum loading Tests 2 and 3, the eight filter elements used for testing were not flushed with water before these tests. This is evident from the values of Variable 8 in Table V.
Start Conditions of Tests Performed for Item 3
A comparison was performed to understand the impact of Variable 8 on the equilibration in the filter element of Item 3. The results of the same are depicted in Figure 14. The following observation is made from this Figure:
Observation 20: The equilibration time for TCs placed within the filter element of Item 3 (i.e., T2 of Variable 2) in maximum loading Test 1 is longer and more Variable than the equilibration time for TCs placed in T2 in maximum loading Tests 2 and 3.
Number of Steam and Vacuum Pulses Used for Preconditioning in the Autoclave Recipe (Variable 9)
A comparison was performed between Recipes 1, 2, 3, and 4 to understand the impact of Variable 9 on the equilibration of Item 3. The equilibration time data obtained from Recipes 1, 2, 3, and 4 are tabulated in Table VI (refer to Table II for details on parameters of Recipes 1, 2, 3, and 4). The following observations are made from the data in Table VI:
Observation 21: The average equilibration time of Item 3 is significantly lower in Recipes 2 and 4 that have five steam and vacuum pulses than in Recipes 1 and 3 that have three steam and vacuum pulses.
Observation 22: The standard deviation of equilibration times around the average equilibration time of Item 3 is lower in Recipe 2 that has five steam and vacuum pulses than in Recipe 1 that has three steam and vacuum pulses.
Observation 23: The standard deviation of equilibration times around the average equilibration time of Item 3 is marginally higher in Recipe 4 that has five steam and vacuum pulses than in Recipe 3 that has three steam and vacuum pulses.
Comparison of the Equilibration Times Obtained from Recipes 1, 2, 3, 4, 5, and 6
Depth of the Steam and Vacuum Pulses Used for Preconditioning in the Autoclave Recipe (Variable 10)
A comparison was performed between Recipes 1, 2, 3, 4, and 5 to understand the impact of Variable 10 on the equilibration of Item 3. The equilibration time data obtained from Recipes 1, 2, 3, 4, and 5 are tabulated in Table VI (refer to Table II for details on parameters of Recipes 1, 2, 3, 4, and 5). The following observations are made from the data in Table VI:
Observation 24: The average equilibration time of Item 3 is significantly lower in Recipe 3 that has deeper steam and vacuum pulses than in Recipe 1. Similarly, the average equilibration time of Item 3 is significantly lower in Recipe 4 that has deeper steam and vacuum pulses than in Recipe 2.
Observation 25: The average equilibration time of Item 3 is significantly lower in Recipe 5 that has its final three vacuum pulses at approximate atmospheric pressure (i.e., 15 psi) than in Recipes 1, 2, 3, and 4 that have their final three vacuum pulses at lower than atmospheric pressure (i.e., 1.4 psi or 3.7 psi).
Hold Time of the Steam and Vacuum Pulses Used for Preconditioning in the Autoclave Recipe (Variable 11)
A comparison was performed between Recipes 1, 2, 3, 4, 5, and 6 to understand the impact of Variable 11 on the equilibration of Item 3. The equilibration time data obtained from Recipes 1, 2, 3, 4, 5, and 6 are tabulated in Table VI (refer to Table II for details on parameters of Recipes 1, 2, 3, 4, 5, and 6). The following observations are made from the data in Table VI:
Observation 26: The average equilibration time of Item 3 is significantly lower in Recipe 6 that has a 5-min hold time for its steam and vacuum pulses than in Recipes 1, 2, and 3 that do not have hold times for their steam and vacuum pulses.
Observation 27: The average equilibration time of Item 3 is higher in Recipe 6 that has a 5-min hold time for its steam and vacuum pulses than in Recipes 4 and 5 that do not have hold times for their steam and vacuum pulses.
Observation 28: The standard deviation of equilibration times around the average equilibration time of Item 3 is the lowest in Recipe 6 that has a 5-min hold time for its steam and vacuum pulses than in Recipes 1, 2, 3, 4, and 5 that do not have hold times for their steam and vacuum pulses.
Conclusions
Based on Observations 1 to 13, the following general conclusions are drawn:
Conclusion 1: From Observations 1 and 4, TCs located in dry goods load items with a layer of insulation to steam penetration will take longer to equilibrate than TCs located in dry goods load items without a layer of insulation. From Observation 2, TCs located in dry goods load items without a layer of insulation to steam penetration equilibrate in comparable times. Therefore, it is concluded that in general the location where the TCs are placed within the load item (Variable 2) has an impact on the equilibration time of the TCs within the load items.
Conclusion 2: From Observation 3, TCs located in dry goods load items that have a lower geometrical complexity tend to have lower variations in the measurements of equilibration times during repeated tests. Therefore, it is concluded that in general the type of dry goods load item placed inside the autoclave (Variable 1) has an impact on the equilibration time of the TCs within the load items.
Conclusion 3: From Observations 5, 6, and 7, longer equilibration times are bound to have higher variations in the measurements of equilibration times during repeated tests, that is, the longer the equilibration time of a TC in an item, the higher the variation in measurement of that equilibration time of the TC in that item.
Conclusion 4: From Observations 8, 9, and 10, the equilibration time of dry goods load items is slightly impacted by their location within the autoclave. However, this impact is hypothesized to be also dependent on the type of dry goods load item being tested and the steam dissipation profile within the loaded autoclave chamber. Therefore, it is concluded that in general the location of the dry goods load item inside the autoclave (Variable 3) has a small impact on the equilibration time of the TCs within the load items.
Conclusion 5: From Observation 12, the equilibration time of dry goods load items is not significantly impacted by the horizontal orientation of the dry goods load item. Therefore, it is concluded that in general the horizontal orientation of the load item within the autoclave chamber (Variable 4) does not have a significant impact on the equilibration time of TCs within that load item.
Conclusion 6: From Observations 13 and 14, the equilibration time of dry goods load items is not significantly impacted by the number of coils of a tubing element of the item. Therefore, it is concluded that in general the number of coils of a tubing element (Variable 5) does not have a significant impact on the equilibration time of TCs within the tubing element.
Conclusion 7: From Observations 15, 16, and 17, the equilibration time of dry goods load items is slightly impacted by the thermal mass of the dry goods load item placed within the autoclave. However, this impact is hypothesized to also be dependent on the type of dry goods load item being tested and the steam dissipation profile within the loaded autoclave chamber. Therefore, it is concluded that in general the thermal mass of the dry goods load item placed within the autoclave (Variable 6) has a small impact on the equilibration time of the TCs within the load items.
Conclusion 8: From Observations 18 and 19, the equilibration time of dry goods load items is impacted by the temperature of the dry goods load items at the start of the sterilization cycle. This impact seems to be more pronounced for difficult-to-equilibrate dry goods load items that take a longer time to equilibrate than for dry goods load items that take a shorter time to equilibrate. Therefore, it is concluded that in general temperature of the dry goods load items at the start of the sterilization cycle (Variable 7) has an impact on the equilibration time of the TCs within the load items, especially for dry goods load items that have inherently high values for the equilibration time.
Conclusion 9: From Observation 20, moisture within the filter membrane impacts the equilibration time of the TCs placed in the filter's elements. Therefore, it is concluded that in general the presence of moisture in dry goods load items at the start of the sterilization cycle (Variable 8) has an impact on the equilibration time of TCs placed within the filter membrane.
Conclusion 10: From Observations 21, 22, and 23, the equilibration time and the variability of the equilibration time of dry goods load items are impacted by the number of alternating steam and vacuum pulses used during the preconditioning phase of the autoclave cycle. It is concluded that increasing the number of steam and vacuum pulses used for preconditioning in the autoclave recipe (Variable 9) reduces the equilibration time of the TCs within the load items.
Conclusion 11: From Observations 24 and 25, the equilibration time and the variability of the equilibration time of dry goods load items are impacted by the depth of the alternating steam and vacuum pulses used during the preconditioning phase of the autoclave cycle. It is concluded that increasing the depth of the steam and vacuum pulses used for preconditioning in the autoclave recipe (Variable 10) reduces the equilibration time of the TCs within the load items but may increase the variability of the equilibration time.
Conclusion 12: From Observations 26, 27, and 28, the equilibration time of dry goods load items is impacted by the hold time of the alternating steam and vacuum pulses used during the preconditioning phase of the autoclave cycle. It is concluded that increasing the hold time of the steam and vacuum pulses used for preconditioning in the autoclave recipe (Variable 11) reduces the variability of the equilibration time of the TCs within the load items.
Recommendations
Based on Conclusions 1 through 12, the following general recommendations are made:
Recommendation 1: Ensure that the temperatures of the TCs that are placed in the test items are consistently maintained within the same temperature ranges during the start of the autoclave cycles in repeated tests.
Recommendation 2: Ensure that the TCs are consistently placed in the same locations within the same test items used during repeated tests. Measure and fix a constant depth to which the TCs are probed inside a specific test item during repeated tests.
Recommendation 3: Ensure that the equilibration time is consistently measured using the same thermal mass within the autoclave with either maximum loading or minimum loading.
Recommendation 4: Ensure that the moisture levels within the test items are consistently maintained within specific ranges across repeated tests. Maintain moisture levels as low as possible.
Recommendation 5: Ensure that the locations of the test items within the autoclave chamber are identical across repeated tests.
Recommendation 6: Ensure that the autoclave recipe is optimized to achieve low values of equilibration time by either increasing the number or the depth or both the number and the depth of the alternating steam and vacuum pulses used during the preconditioning phase of the autoclave cycle.
Recommendation 7: Once the autoclave recipe is optimized to achieve low values of equilibration time, add hold times to the alternating steam and vacuum pulses used during the preconditioning phase of the autoclave cycle to reduce the variability of the equilibration time.
Conflict of Interest Declaration
All authors of this manuscript certify that they have read and approved this manuscript. All authors of this manuscript do not have any conflict to declare.
Acknowledgements
The authors thank James Academia, Manufacturing Technical Specialist, Genentech, for his support in execution of the testing that generated the raw test data that are analyzed and discussed in this paper. The authors also thank Fikre Asgedom (Manufacturing Technical Specialist, Genentech), Chan Lam (Quality Manager, Genentech), and Marcus Lee (Quality Engineer, Genentech) for reviewing the raw test data that are analyzed and discussed in this paper. Finally, the authors thank Ken Fresquez, Associate Designer, Genentech, for rendering all the figures for this paper.
- © PDA, Inc. 2019


