
Abstract
Previous studies have shown that parenteral formulation excipients can interact with the silicone oil in prefilled syringes, thereby causing variations in glide force that affect the performance of autoinjectors. Thus, it is crucial to control the glide force of the prefilled syringes to mitigate the potential risk of dose inaccuracies. This study provided a systematic understanding of the chemical interactions between the excipients, physical interactions between the excipients and the container, as well as their impact on the functional performance of prefilled syringes. The design of experiment approach used in this study generated statistically meaningful data, which confirmed that different excipients caused varying increase in glide force in siliconized prefilled syringes. The data indicated that poloxamer 188 can more effectively maintain stable glide forces during accelerated storage conditions compared with polysorbate 80. This finding was further enhanced using Hansen solubility parameters theory, which provided a fundamental understanding of the mechanisms behind the physical interactions. Chemical stability analysis of the surfactants suggested that degradation of excipients also impacts syringe functionality. In summary, the results revealed the unique interactions between parenteral pharmaceutical excipients and primary packaging systems and the physicochemical foundation behind them.
- Prefilled syringe
- Autoinjector
- Glide force
- Silicone oil
- Surfactant
- Polysorbate
- Poloxamer
- Hansen solubility parameters
Introduction
Subcutaneous delivery of biological drug products is widely used in therapeutic areas such as diabetes, autoimmune/immunodeficiency, and oncology (1–2). Compared with intravenous delivery, subcutaneous injection has significantly lower direct and indirect costs and is more convenient for self-administration (2–3). Prefilled syringes (PFSs) and autoinjectors are most commonly used for subcutaneous delivery of biopharmaceuticals as they reduce the manipulation by patients and improve dosing accuracy (4⇓⇓–7).
Silicone oil is sprayed on the inside of glass syringes to decrease friction and aid in smooth plunger movement. As parenteral drug formulations directly contact the silicone oil layer, the formulation excipients may impact the silicone oil distribution while under storage conditions. In a manual syringe, such changes in distribution would increase the break loose force and glide force (GF). In autoinjectors, these changes may result in prolonged or inconsistent injection time as well as dosage inaccuracies (8⇓⇓⇓–12). A recent publication by Shi et al. (1) indicated that formulation factors (buffers, pH, surfactant concentration, and tonicity agents) in PFSs affected the structure and distribution of silicone oil, leading to an increase in plunger GF at accelerated storage temperature conditions. Two other recent publications (13, 14) clearly demonstrated the critical role of surfactants on syringe functionality. Water for injection (WFI) only or buffer only systems have very minimum GF increase, whereas including a low concentration of polysorbate 80 (PS80) significantly boosts the GF increase under thermal stress. In addition, different types of surfactants lead to different levels of GF increase, based on the hydrophobicity and surface activity of surfactants.
To thoroughly understand the excipient–silicone oil and excipient–excipient interactions and their impact on the functional performance of the syringe, a full factorial design of experiment (DOE) approach was applied. This approach expanded the list of excipients studied in the previous report by Shi et al. (1) to include poloxamer 188 (P188) as an alternative surfactant. This approach was advantageous because (a) it considered the impact of buffers, tonicity agents, and surfactants at different time points, revealing the thermodynamics and kinetics of the excipient–silicone oil and excipient–excipient interactions; and (b) it compared the relative significance of individual and combined factors at different time points.
In addition to making drug formulators aware of the potential undesired drug and packaging interactions, this DOE study also presents a fundamental grasp on the physicochemical factors governing excipient–silicone oil and excipient–excipient interactions. Furthermore, a deeper insight into the physical and chemical factors governing such interactions is reported. In this work, we first explored the physical interactions between the excipient and silicone oil through a DOE stability study; then the results were further elucidated using Hansen Solubility Parameters (HSP) theory. In the end, the chemical interactions between excipients and their impact on the GF of the PFSs were assessed as well.
Materials and Methods
Chemicals
The USP grade WFI was purchased from VWR (Catalog #10,837-190, Rocky Mountain Biologics, West Jordon, UT). All the other reagents were purchased from Sigma Aldrich Inc. in St. Louis, MO. Solutions of PS80 (Catalog # 59,924) and P188 (Catalog # 15,759) were freshly prepared and used immediately. PS80 standard (Catalog # 1547,969) and standard of 10% poloxamer 188 (Catalog # P5556) were used for high-performance liquid chromatography (HPLC) tests only. Other excipients were purchased from Sigma Aldrich with a purity equal to or higher than ACS grade, such as D-mannitol (Catalog # M9647, ACS reagent), sodium chloride (Catalog # 567,440, ACS reagent), acetic acid, (Catalog # 695,092, glacial, ACS reagent, ≥99.7%), L-histidine (Catalog # H8000, ReagentPlus, ≥99.0%), and citric acid monohydrate (Catalog # C1909, ACS reagent, ≥99.0%).
Primary Packaging
All testing solutions were prepared at ambient conditions, filtered by 0.2 µm size polytetrafluoroethylene filters, and stored at 5°C before filling. The syringes were siliconized glass, EZ-fill 1 mL long syringes with 27-gauge needles manufactured by Ompi Pharma Division of the Stevanato Group (Product Code P76002.5867). Each syringe was manually filled in ambient conditions with 1.0 mL of testing solution. The plungers were 1 mL long NovaPure 4023/50 plungers with B2 coating (Product number 11402,010) manufactured by West Pharmaceutical Services. After the syringes were filled, the plungers were manually inserted using a plunger rod, air bubbles were expelled from the needle end, and the filled syringes were then stored in a plastic nest inside a tub with the needle pointed downward.
Hansen Solubility Parameters Determination
HSPs for each molecule exist as a set, or multiple sets, of 3-dimensional coordinates (δd, δp, δh) described as the cohesive energy components of nonpolar dispersion, polarity, and hydrogen-bonding, respectively. Small molecules, like acetic acid and histidine, were sufficiently described with one set of parameters, whereas large amphipathic molecules, like silicone oil, PS80, and P188, required multiple sets to describe their hydrophilic and hydrophobic parts. As listed in Table I, silicone oil can be described using two sets of HSP values because of the easy rotation of the Si-O-Si σ bonds in the polydimethylsiloxane polymer chains (15), whereas PS80 and P188 require three sets for the hydrophobic, hydrophilic, and combined hydrophobic–hydrophilic parts (16–17).
Hansen Solubility Parameters for Key Excipients, Silicone Oil, Water, and Borosilicate Glass
The HSPs for water, acetic acid, histidine, citric acid, and PS80 were taken from the HSPiP software (version 5.0.04) database (16–17). The HSPs for mannitol and P188 were measured by Agfa-Gevaert N.V. The HSPs for silicone oil and borosilicate glass were taken from the literature (16⇓–18). HSP distances between chemical species were calculated using every HSP set for that molecule, and the shortest distance (indicating a stronger interaction) was taken as the result.
As the HSP theory typically does not apply for ions, the HSPs of acetate and citrate ions, as well as sodium chloride, were not considered in this study.
Design of Experiments to Explore Excipient Effects
Prior work by Shi et al. (1) elaborated on the substantial impact of formulation matrices on syringe GF under accelerated stability testing. This DOE study aimed to further explore three aspects related to the initial findings: (a) to statistically confirm the previously observed trend; (b) to reveal potential hidden combination effects between different excipient categories (e.g., effects between surfactant and buffer or surfactant and tonicity agent); and (c) to identify ways to leverage the formulation toward improvement in syringe functionality.
The following full factorial DOE factor sets (Table II) were created in a MINITAB software to study the effects of buffers, pH levels, surfactants, and tonicity agents on the GF of siliconized glass PFSs. Acetate, histidine, and citrate buffers were tested at 20 mM solution concentrations at both low and high pH. Acetate buffers were prepared at a pH of 4.5 and 5.5. Histidine and citrate buffers were prepared at a pH of 5.5 and 6.5. Two surfactants, PS80 and P188, were tested using 0.06% (w/w) testing solution concentration. Lastly, two tonicity agents, mannitol and NaCl, were tested with a concentration of 5.0% (w/w) and 150 mM, respectively.
Design of Experiment Sets to Study the Impact of Excipients on Syringe Functional Performances
The placebo formulation solutions were filled into 1 mL long siliconized glass syringes under ambient conditions and stored either at room temperature (23°C) or at 40°C (75% relative humidity [RH]) for 1 and 3 months. The samples were tested under ambient conditions at first filling (T = 0) and then pulled from the stability chamber and tested at each subsequent time point. The accelerated storage conditions at 40°C and 75% RH for 3 months were an exaggerated stress test for the typical parental drug formulations. It was of less practical relevance in predicting shelf-life performance when compared with the 40°C for 1 month storage condition. Nevertheless, it still offered important insights on the interactions between the drug excipients and packaging materials and was included in the discussion.
Syringe Glide Force Measurement
At each time point of storage, the PFSs were pulled out of the stability chamber and tested in ambient conditions after first equilibrating to room temperature. The PFSs were evaluated for GF by using an Instron test system with a typical test speed of 100 mm/min. The PFSs were emptied by pushing the liquid through the distal end by using a plunger rod. The exerted force was measured with a calibrated 50 N load cell. After the initiation of plunger motion, the maximum point of the remaining dosing stroke (the GF) was measured and recorded. Each sample was then averaged over 10 replicates.
Contact Angle Measurement
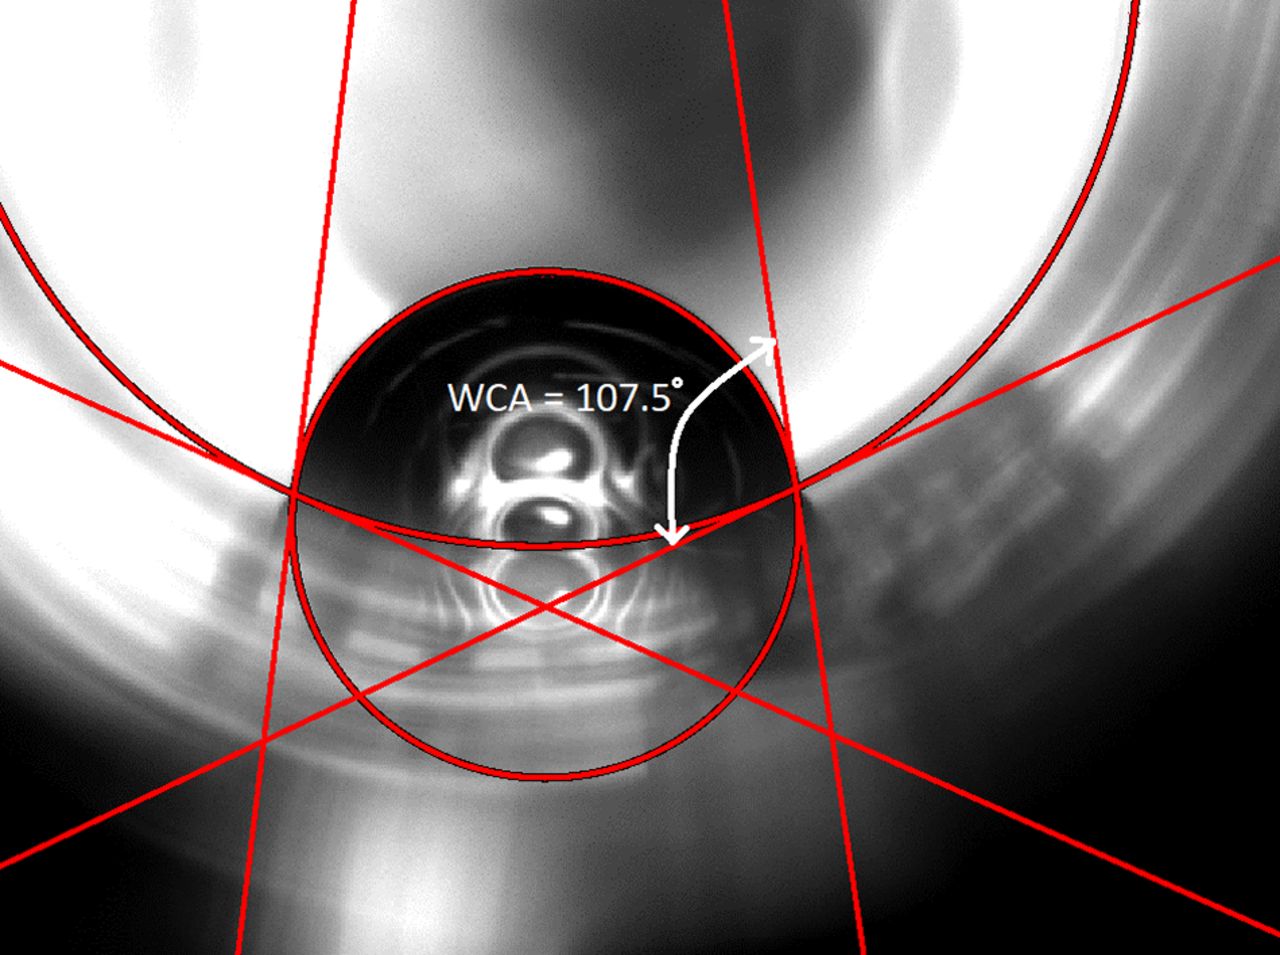
An in situ method was developed to measure the static water contact angle (WCA) of the interior wall of the intact siliconized glass syringes. WCA was a direct method to assess the intactness of the silicone oil layer on the inside of the glass syringe barrel. Intact silicone oil is very hydrophobic with a typical WCA of approximately 109°, whereas the clean glass surface is very hydrophilic and has a typical WCA of approximately 15°. When the silicone oil layer is disrupted by solutions, a lower WCA will be observed (1). The raw images were captured using Ramé-Hart’s 200-F4 Goniometer with Standard DropImage software. These images were then fit to circle profiles representing the syringe cross-section and the partial water droplet using a MATLAB program. The final contact angles were extracted from the angles between their tangent lines at user-defined contact points. For example, an intact, well-lubricated glass syringe as received from the manufacturer showed a WCA of ∼108.6 ± 2.7° (Figure 1). For syringes with filled solutions, the plunger was first pulled off from the barrel’s flange end and the solution was poured out. The emptied syringes were then rinsed thrice with water and air-dried over 24 h. The WCA was then measured from the dried, empty syringes. Three WCA replicates were measured for each DOE sample.

The water contact angle (WCA) of a well-lubricated, fully siliconized syringe (empty, as received) is approximately 108.6° ± 2.7°.
Quantification of Surfactants for Chemical Stability Determination
In a surrogate method for PS80, total oleic acid (TOA) and hydrolyzed (or free) oleic acid (FOA) content were quantified via reversed-phase HPLC with an ultraviolet (UV) detector. PS80 was hydrolyzed using base and heat, and the TOA was quantified by comparing its content values against an internal standard curve. The internal standards were prepared using the same method and conditions with fresh PS80. Second, the FOA content was quantified similarly, only without hydrolysis. Therefore, it represented the amount of PS80 that had already been hydrolyzed under stability conditions before any analytical testing (19).
Based on the available literature (20), reversed-phase separation with a restricted access media column and an acetonitrile gradient was used to reach the signal peak for P188. Detection was achieved with a charged aerosol detector, and the samples were injected into an Agilent 1100 HPLC system with a binary pump, refrigerated autosampler (at 5°C), and column heater (50°C). Quantitation was performed relative to the commercial standard of 10% P188, diluted within a range of 0.01% to 1.0% (w/v) with purified water.
Results and Discussion
DOE Testing Results and Analysis
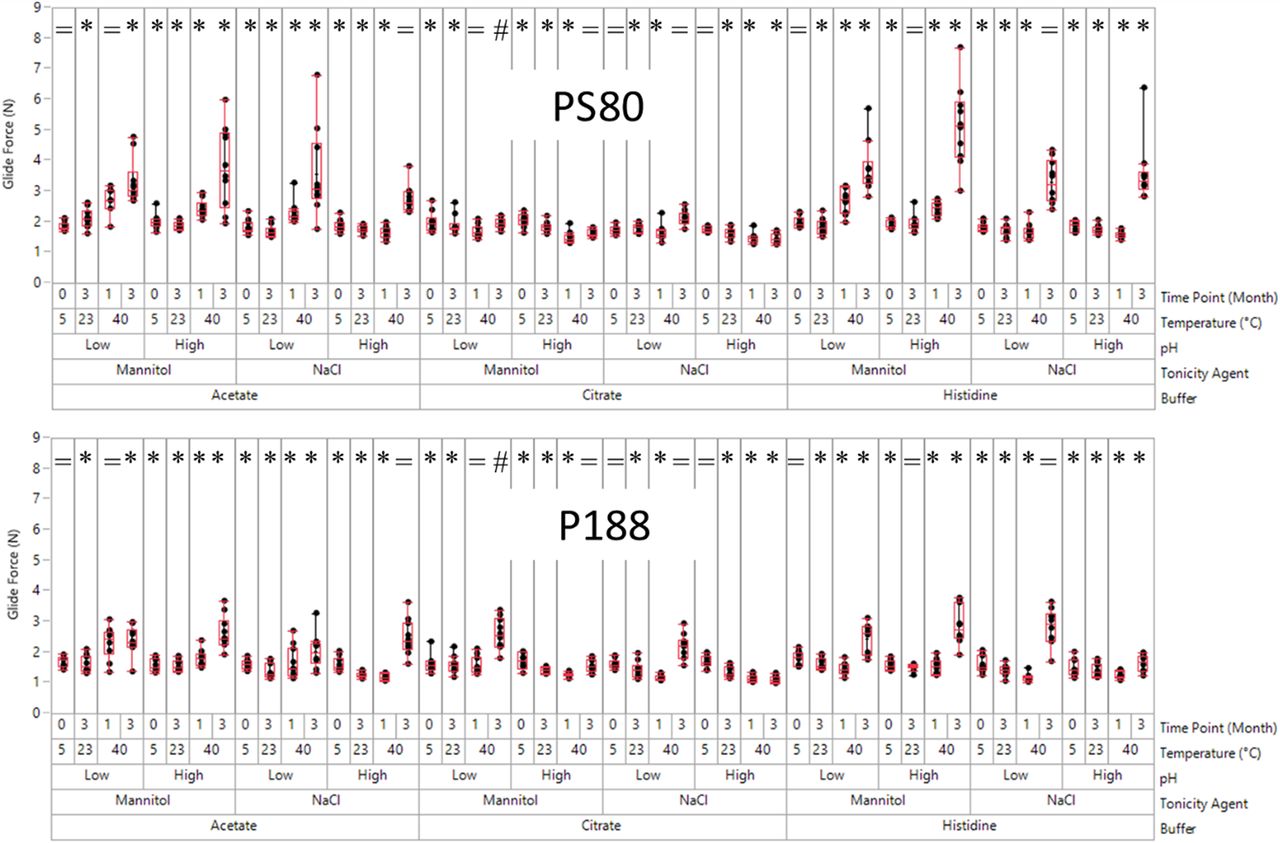
When compared with PS80, P188 demonstrated an obvious advantage in a relatively consistent and low GF. As shown in Figure 2, all conditions with significantly higher GF (P < 0.05 by t test) in PS80 samples than that in P188 samples are marked by *. All conditions with similar GF (P > 0.05 by t test) for PS80 and P188 samples are marked by =. Only one condition had a significantly higher GF (P < 0.05 by t test) in the P188 sample than that in the PS80 sample (marked by #). This special condition was citrate buffer with mannitol at low pH after 3 months at 40°C, and the result could be related to PS80 hydrolysis as discussed in the following parts. In acetate buffers and histidine buffers, PS80 samples showed significantly greater increase in GF when compared with that of the P188 samples for most of the conditions. Only 3 out of 16 conditions/time points had similar GF (=) between PS80 and P188 samples for each of the buffers.

Glide force (GF) box plots for 12 formulations with polysorbate 80 (PS80, top) and poloxamer 188 (P188, bottom) as the surfactant. The whiskers correspond to the minimum and maximum GF over 10 replicates excluding outliers. The box ends correspond to the upper and lower quartiles, and the horizontal line indicates the median. “*” signs: higher GF for PS80 (P < 0.05). “#” signs: higher GF for P188 (P < 0.05). “=” signs: similar GF between PS80 and P188.
For citrate buffers, the GF increase was not as significant as in acetate buffers or histidine buffers after aging, regardless of the surfactant type, pH, and tonicity agents used. The advantage of P188 over PS80 in citrate buffer was not as significant as in acetate or histidine buffers. Five out of 16 conditions/time points had similar GF (=) between PS80 and P188 samples, and 1 out of 16 conditions/time points had higher GF (#) for P188 samples compared with that of PS80. The difference in different buffer systems was related to the chemical stability of the surfactants (discussed in the following parts).
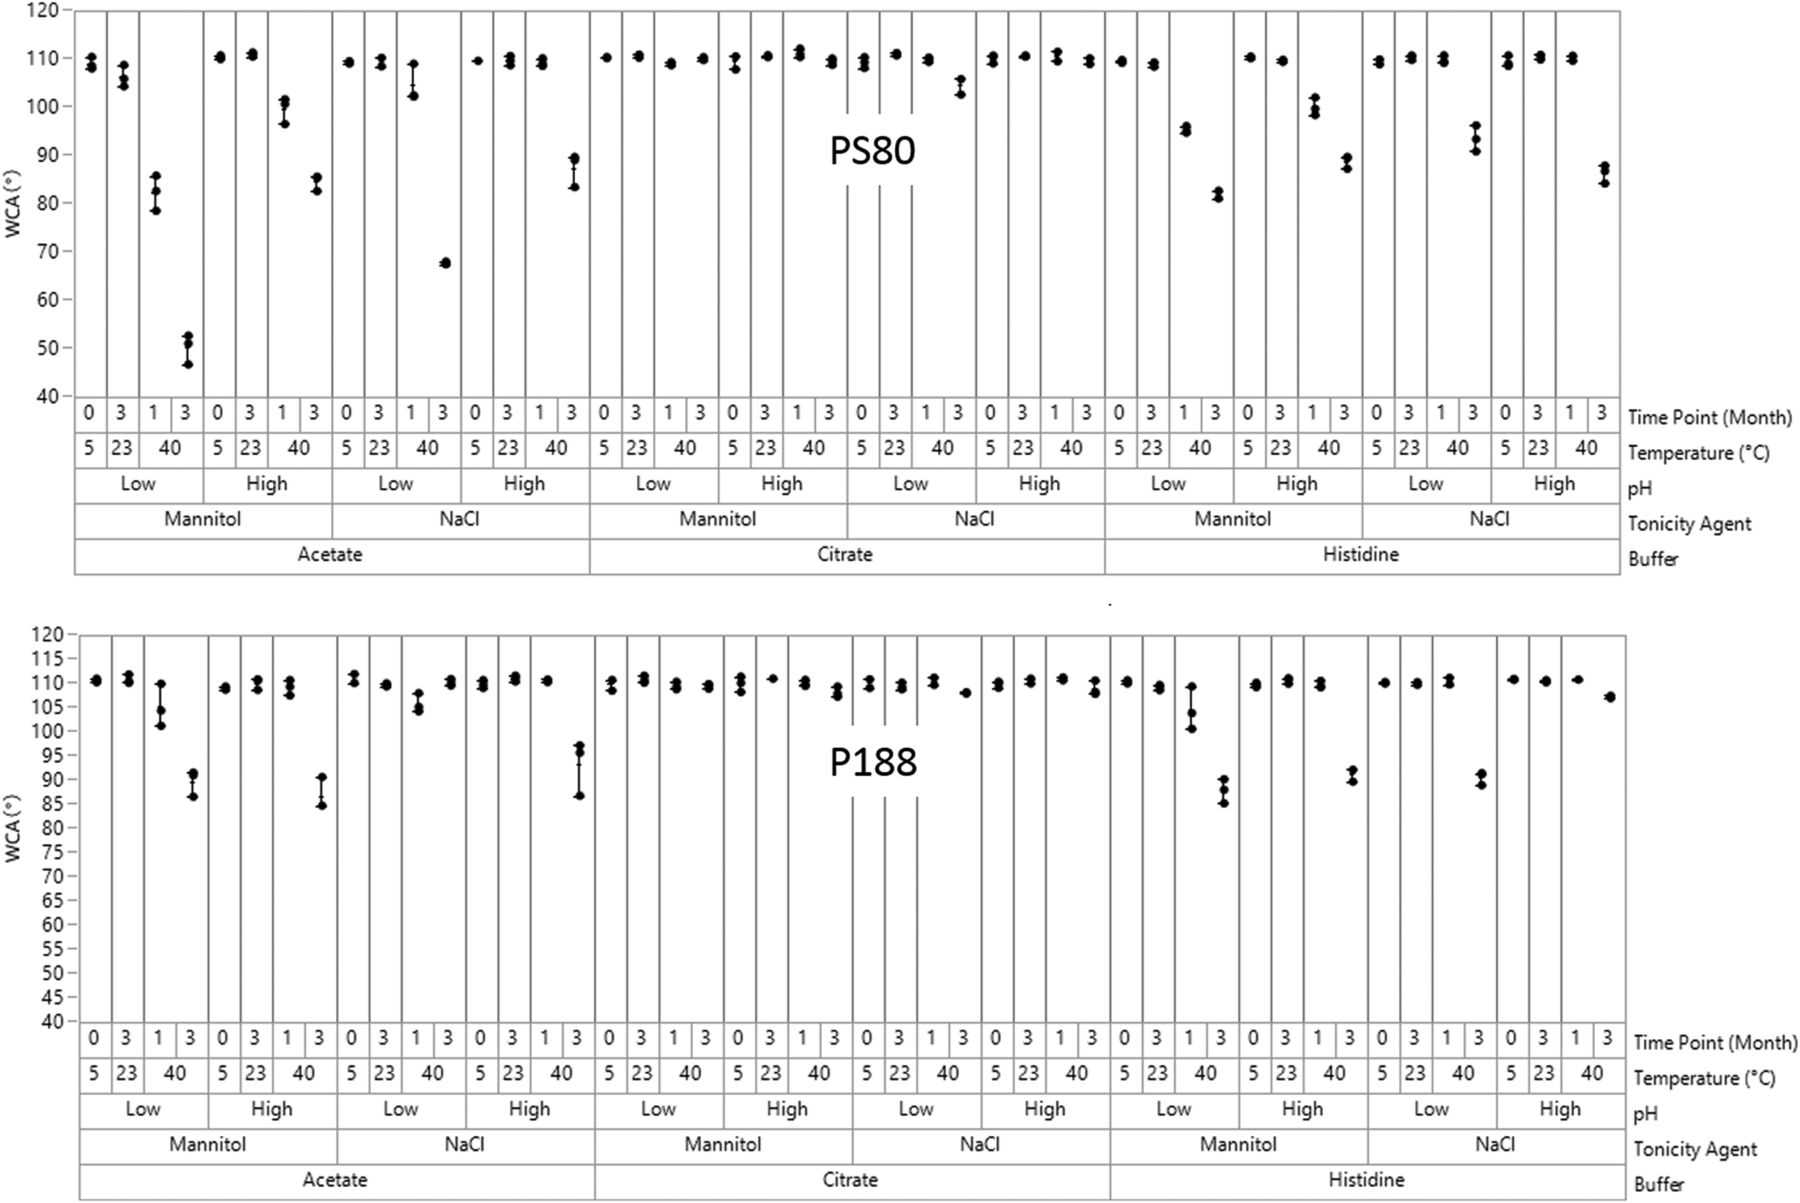
The results for WCA for glass syringes under all storage conditions and each time point showed differences among the formulations (Figure 3). At T = 0 (5°C) and after 3 months (23 °C), all WCAs measured were close to that of an unfilled, empty syringe (108.6 ± 2.7°), which indicated an intact silicone oil layer. After aging at 40°C and 75% RH, all citrate buffer samples also retained WCAs near 108.6°, whereas a significant decrease was observed for all acetate and histidine buffer samples (P < 0.05). Overall, the degree of decrease in WCA in the three buffers followed the trend of acetate > histidine > citrate. Additionally, WCA decreased more significantly for the PS80 samples when compared with that of the P188 samples, especially in low pH acetate buffer (P < 0.05).

Water contact angle (WCA) plots for 12 formulations with polysorbate 80 (PS80, top) and poloxamer 188 (P188, bottom) as the surfactant.
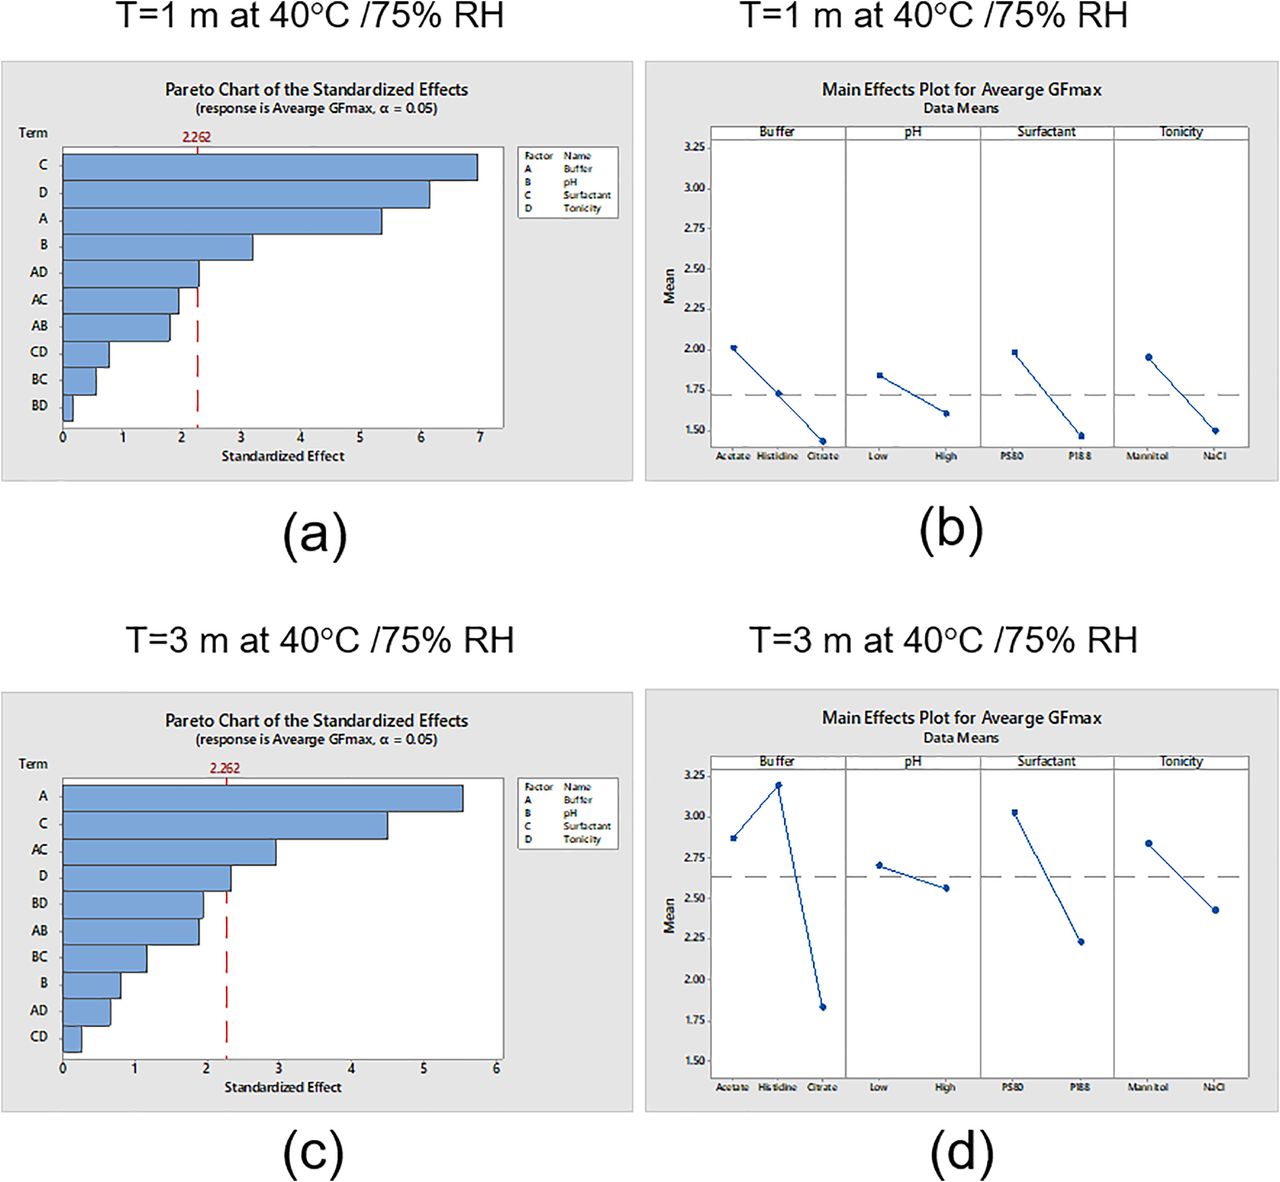
DOE analysis for GF at two different time points (T= 1 month at 40°C and 75% RH and T = 3 months at 40°C and 75% RH) was conducted (Figure 2). Compared with T0, no significant change in GF was observed after 3 months at 23°C. However, a significant change in GF was observed after 1 month at 40°C and 75% RH (Figure 2) for some conditions. Pareto charts showed the absolute values of the standardized effects sorted by descending magnitude with a reference line separating statistically significant and insignificant factors. As shown in Figure 4a, all individual factors could significantly change the GF. The largest impacting factor was surfactant, followed by tonicity agent, buffer, and pH level. A MINITAB main effects plot displayed the average standardized effect of each group within specific factors (buffer, surfactant, tonicity agent, or pH). The horizontal line indicated the absence of change in GF. Figure 4b showed that the increase in GF followed the trend (a) PS80 > P188; (b) mannitol > NaCl; (c) acetate > histidine > citrate; and (d) low pH > high pH.

Design of experiment analysis of average glide force (GF) at two different time points (1 month and 3 months at 40°C and 75% relative humidity [RH]). (a) Pareto chart of the standard effects after 1 month at 40°C and 75% RH. (b) Main effects plot for GF after 3 months at 40°C and 75% RH. (c) Pareto chart of the standard effects after 1 month at 40°C and 75% RH. (d) Main effects plot for GF after 3 months at 40°C and 75% RH.
After 3 months at 40°C and 75% RH, as shown in Figure 4c, buffer became the most important factor impacting the increase in GF, followed by surfactant and then tonicity agent. The level of pH alone did not have a significant impact on the increase in GF. The buffer–surfactant interaction was also an important factor affecting GF. Except for buffers, all the trends observed in the main effects plot after 3 months were similar to those observed after 1 month at 40°C and 75% RH. The order by which the buffers affected the GF now changed to histidine > acetate > citrate. This change in buffer order was related to buffer–surfactant interactions and surfactant degradation as discussed in the following parts.
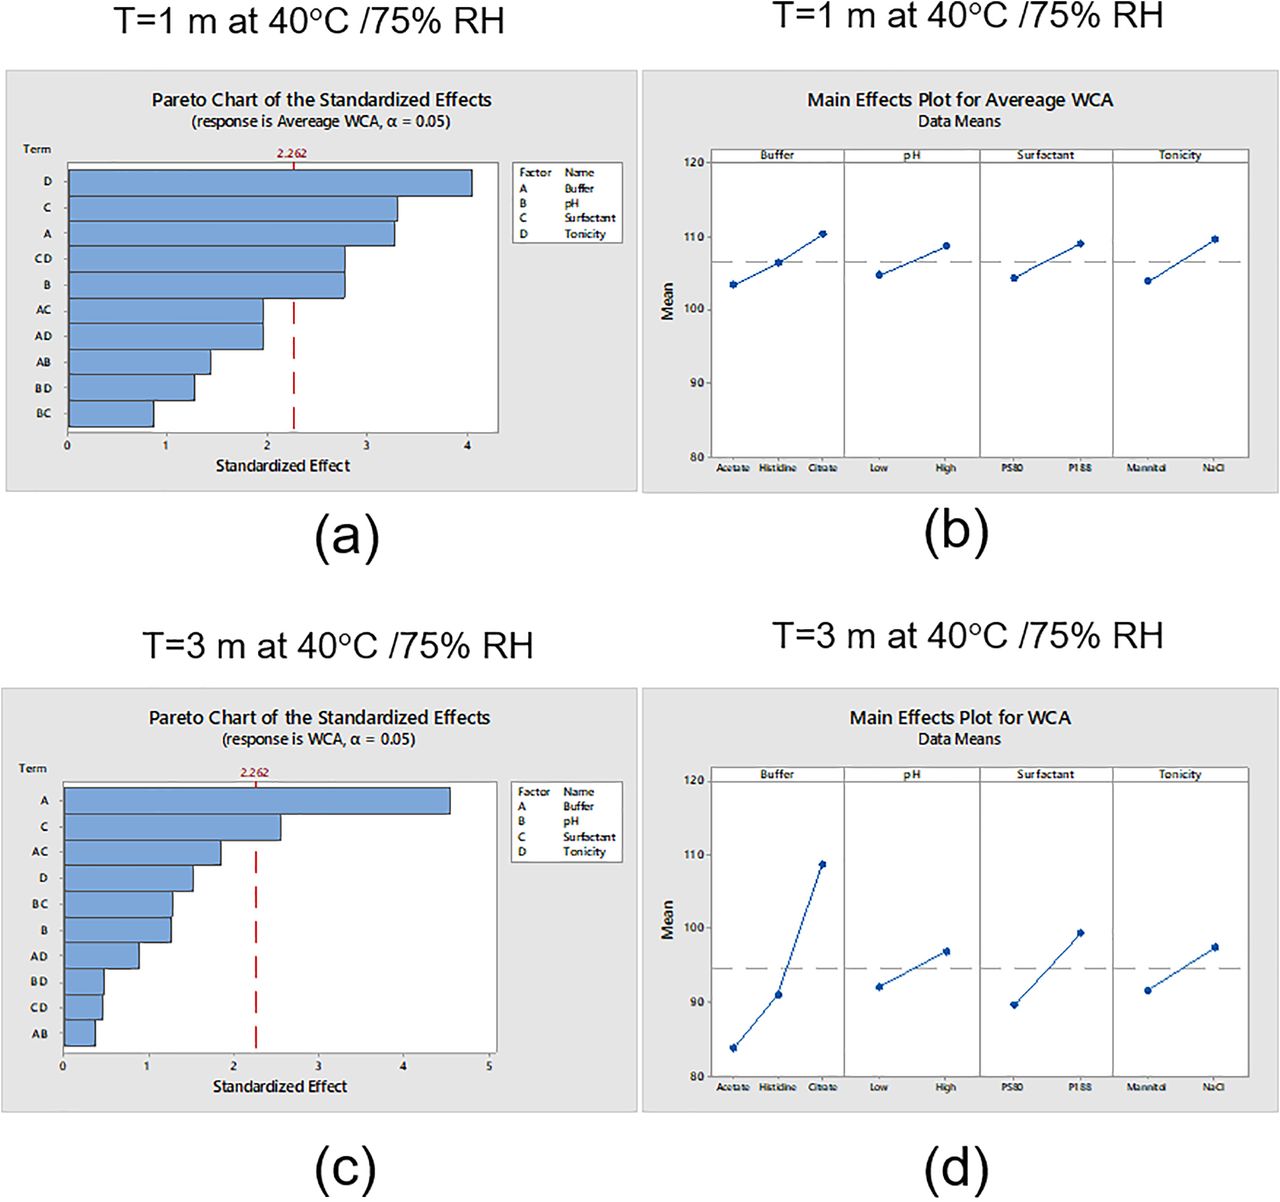
Compared with T0, no significant change in WCA was observed after 3 months at 23°C. However, significant changes (P < 0.05) were observed at selected conditions after 1 month at 40°C and 75% RH (Figure 3). Figure 5 shows the results of DOE analysis for the average WCA at two different time points. As shown in the Pareto chart (Figure 5a), tonicity agent, surfactant, buffer, and pH, as well as the combined surfactant–tonicity agent factor, significantly impacted the decrease in WCA after 1 month at 40°C and 75% RH. The largest difference in WCA was because of (in order of significance) tonicity agents, surfactants, buffers, buffer–tonicity agent interactions, and pH. Meanwhile, the main effects plot in Figure 5b shows the impact of individual factors that followed the trend (a) mannitol > NaCl; (b) PS80 > P188; (c) acetate > histidine > citrate; and (d) low pH > high pH. This trend of decrease in WCA was consistent with the trend of increase in GF after 1 month at 40°C and 75% RH. The correlation between the reduction in WCAs and increase in GFs could be attributed to reduced silicone layer coverage and loss of lubricity because of excipient interactions.

Design of experiment results for average water contact angle (WCA) at two different time points (1 month and 3 months at 40°C and 75% relative humidity [RH]). (a) Pareto chart of the standard effects after 1 month at 40°C and 75% RH. (b) Main effects plot for WCA after 3 months at 40°C and 75% RH. (c) Pareto chart of the standard effects after 1 month at 40°C and 75% RH. (d) Main effects plot for WCA after 3 months at 40°C and 75% RH.
As seen in the Pareto chart of standardized effects in Figure 5c, buffer and surfactant became the only significant factors impacting WCA after 3 months at 40°C and 75% RH. As shown in Figure 5d, the extent of decrease in WCA followed the trend (a) acetate > histidine > citrate and (b) PS80 > P188. The difference in significance of the buffer–surfactant product, as plotted in the Pareto charts of Figures 4c and 5c, suggested that buffer and surfactant interactions do not impact WCA as strongly as they impacted GF.
HSP Elucidation
Based on the HSP theory, the cohesive energy of a solvent or polymer can be broken into three components mathematically expressed by:
 (1)where δt is the total solubility parameter. The HSP three-dimensional coordinates included δd, δp, and δh; δd is the nonpolar/dispersion component, δp is the polar component, and δh is the hydrogen-bonding component (15). The calculated solvent–polymer HSP coordinate distances (referenced herein as “distance” or “HSP distance”) are predictive of the solvent–polymer interaction intensity. Shorter HSP distances suggest stronger physical interactions and can be expressed as
 (2)where (δd1, δp1, δh1) and (δd2, δp2, δh2) are the HSP coordinates for the solvent and polymer, respectively (15). A scaling factor of four was retained in eq 2 to compensate for the nondirectionality of nonpolar/nonpolar physical interactions (15).
In prefilled siliconized glass syringes, solution and primary packaging material interactions consist of: (a) glass–silicone; (b) silicone–solvent; (c) silicone–excipients; (d) glass–excipients; (e) glass–solvent; and (f) excipient–excipient systems. HSP distances in Table III were calculated using eq 2 and the coordinates listed in Table I. HSP distances were evaluated to predict the relative intensities of the previously mentioned interactions. However, because the HSP concept primarily applies to molecules, only acetic acid, histidine, and citric acid buffers were considered. Also, accepted practices dictate an 8 MPa1/2 distance as a threshold for optimal solvent compatibility with typical polymers (17). Thus, the interactions between two materials were arbitrarily categorized into three levels: strong (<8 MPa1/2), medium (8–15 MPa1/2), and weak (>15 MPa1/2).
Hansen Solubility Parameter Distances (MPa1/2) between Key Excipients, Silicone Oil, Water, and Borosilicate Glass Demonstrating Strong (italic), Medium (bold), and Weak (bold-italic) Interactions
Multiple mechanisms have been proposed for excipient–silicone oil interactions (21). In a “delube” mechanism, the excipients “contaminate” the silicone layer by adsorbing onto silicone oil or by penetrating the polymeric silicone molecule chain. Excipients could further emulsify the silicone layer into droplets, which are then removed from the glass surface in a “wash” mechanism. Additionally, excipients can compete with silicone oil for glass surfaces and reduce the silicone oil–glass contact area in a “dewet” mechanism.
PS80 and P188 were the only two excipients that strongly interacted with silicone oil, according to HSP theory (Table III). This was not surprising, because both surfactants are able to interact and emulsify silicone oil into small oil droplets inside aqueous solutions (22). When compared with P188, PS80 had a shorter HSP distance and a stronger interaction with silicone oil via the “emulsify/delube first then wash away from glass surface” mechanisms (21). Additionally, as shown in Table III, PS80 more strongly interacted with glass and had the potential to “dewet” the silicone oil from the glass surface. The presence of PS80 further reduced the WCA on the inner surfaces of the glass syringe and increased the GF. Similar changes in GF and WCA were observed in PS80 DOE samples.
The buffers listed in order of increasing HSP distance from silicone oil were acetic acid, histidine, and citric acid. Thus, acetic acid had stronger direct interactions with silicone oil (via the “delube” mechanism) than histidine and citric acid did (22). Additionally, the trend in buffers with increasing HSP distances from glass was acetic acid ≪ histidine < citric acid, wherein acetic acid maintained much shorter distances. Thus, acetate buffer was more likely than histidine and citrate buffers to “dewet” the silicone oil from the glass surface. With both stronger “delube” and “dewet” effects, acetate buffer could induce the highest changes in GF and WCA, followed by histidine buffer and citrate buffer. As shown in the main effects plot in Figures 3 and 4, most of the trends were consistent with the HSP predictions, except for GF after 3 months at 40°C and 75% RH. This one exception was related to the chemical degradation of the surfactants (which is explained in the next part).
Chemical Degradation of Surfactants
As PS80 and P188 are nonionic surfactants, they have a propensity to be oxidized, thereby reducing their content value (TOA) (19, 23⇓–25).
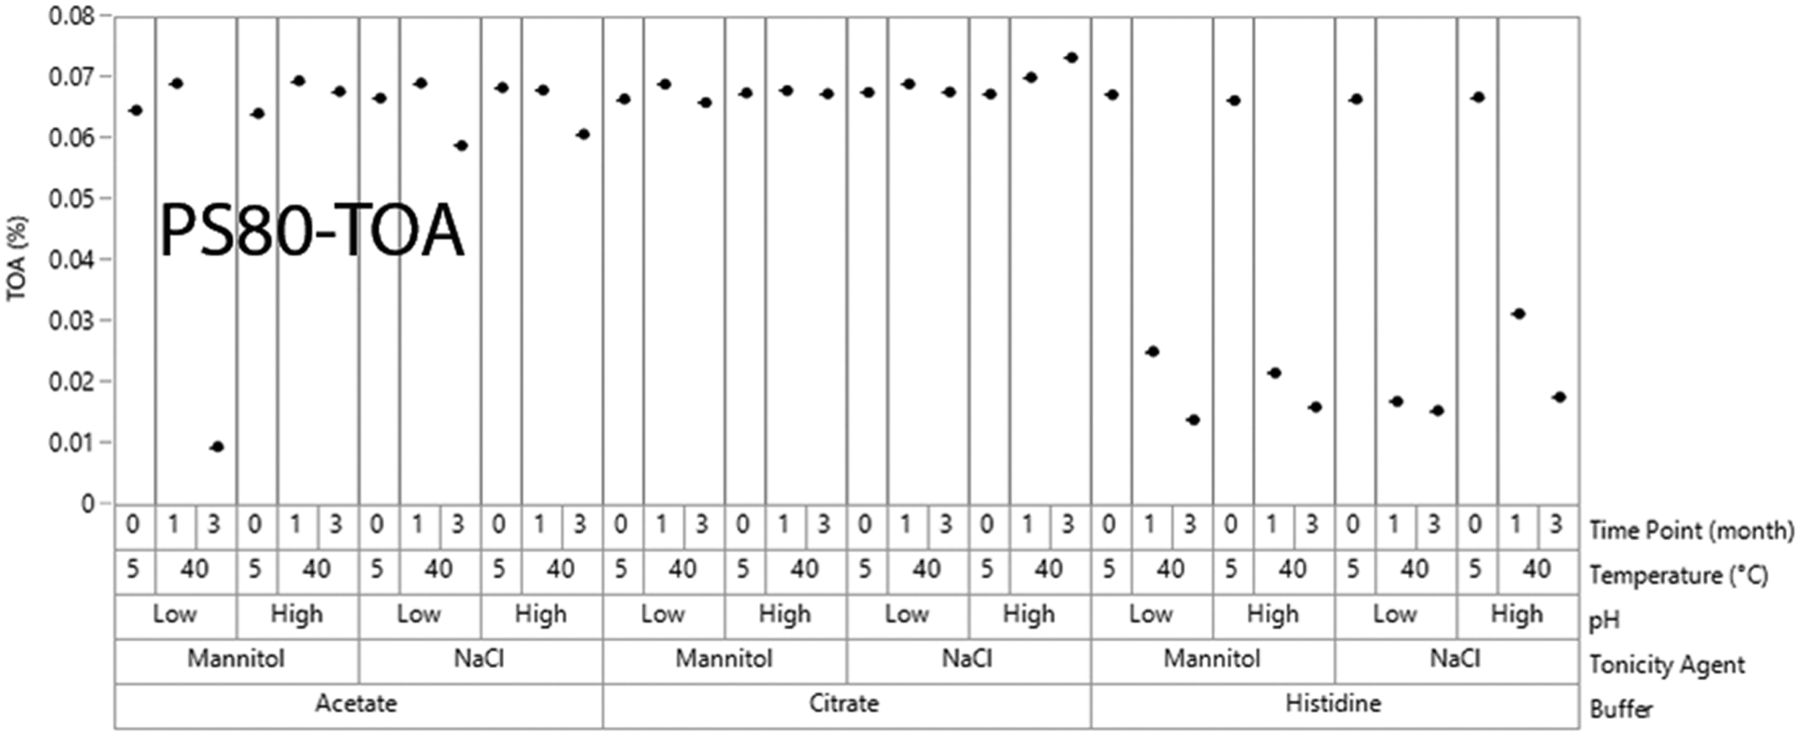
The TOA analysis for stressed PS80 at T0 and 40°C showed the difference in its stability in different formulations (Figure 6). For PS80, a significant reduction in TOA was observed in the histidine buffer at all formulation conditions. A lower reduction of TOA was observed in the acetate buffer whereas the citrate buffer showed the least reduction of TOA. This observation was consistent with the literature report by Doyle et al. (26), which stated that histidine buffer can promote, and citrate buffer can quench the oxidation of PS80. The fast rate of oxidation of PS80 in histidine might be the reason that the GF increased more in histidine than in the other two buffers after 3 months at 40°C and 75% RH.

Total oleic acid (TOA) content values from polysorbate 80 (PS80) solutions.
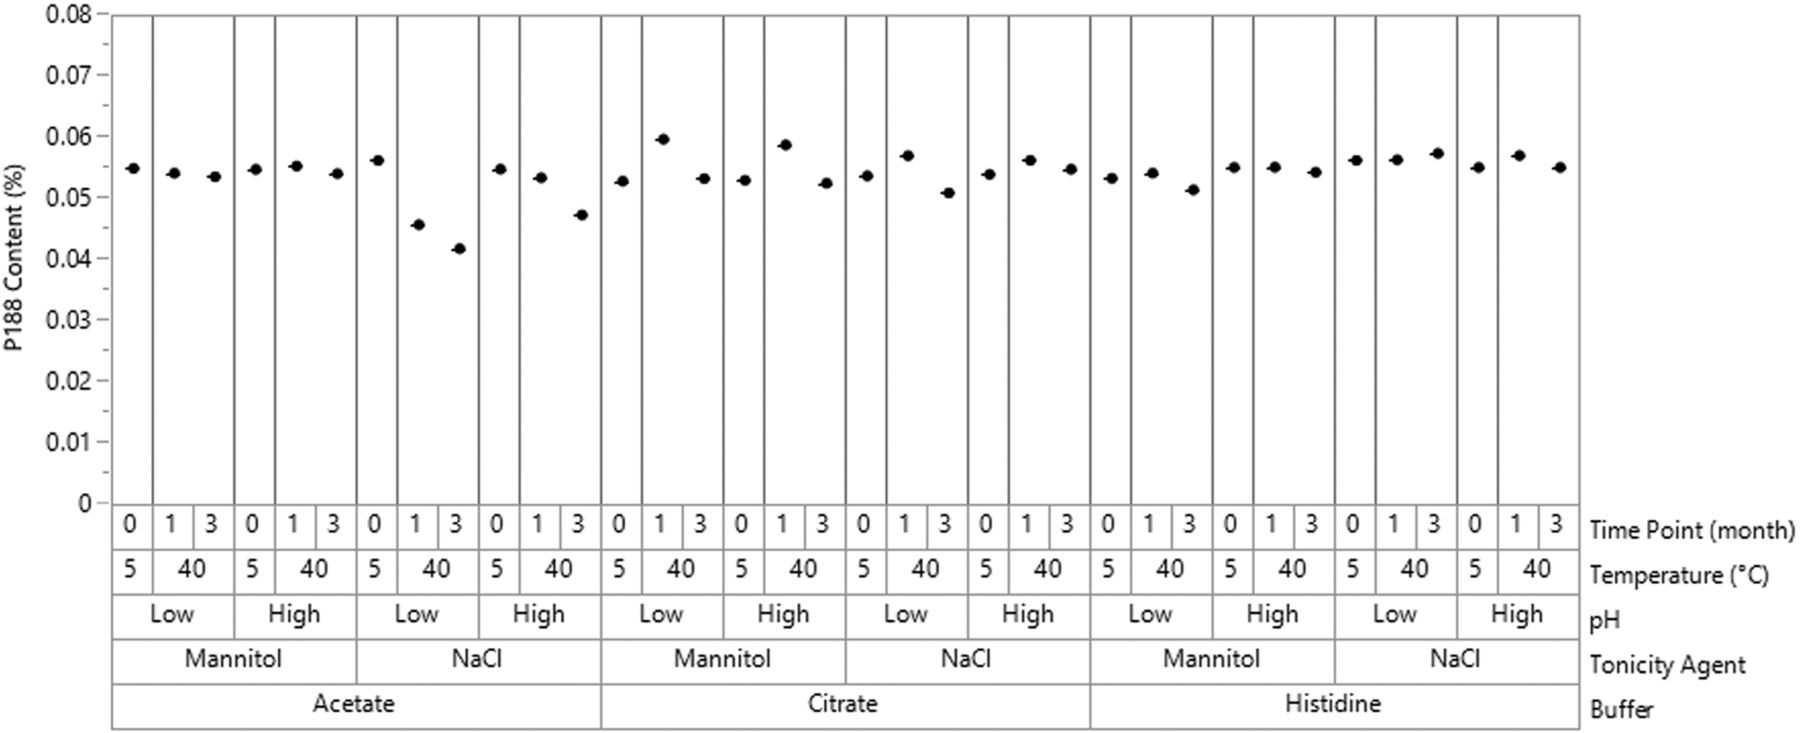
Oxidation of PS80 can produce an extensive variety of products through (a) the oxidation of either double bonds or allylic and bis-allylic methylene groups present on the fatty acids and (b) the oxidation of the polyoxyethylene chains. Oxidation of PS80 reportedly increased the surface activity (27), although it is unclear which degradation product caused this change. This provided additional evidence to our hypothesis that PS80 oxidation degradants (via increased surface activity) led to a higher increase in GF in histidine buffer systems. In contrast, the content of P188 does not significantly change in any of the buffer conditions, except for a small drop in low pH acetate buffer with NaCl (Figure 7). Thus, P188 is chemically more stable than PS80.

Total poloxamer 188 (P188) concentrations in design of experiment solutions at different time points.
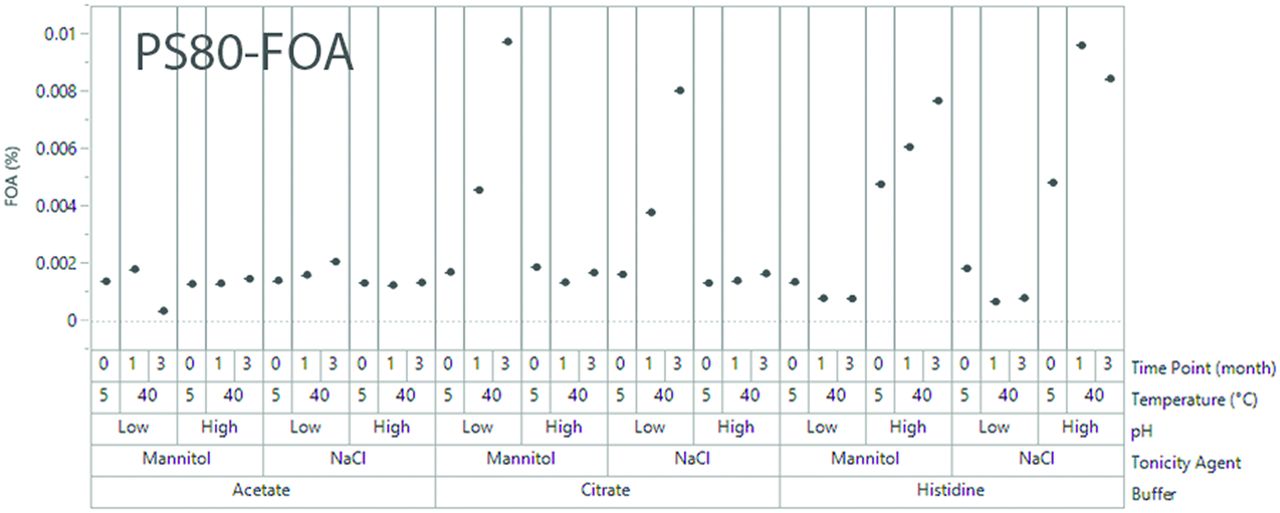
In addition to oxidation, PS80 can also be hydrolyzed, either enzymatically in the presence of protein (28⇓⇓–31), or chemically, albeit much slower (32), depending on the buffer conditions. PS80 hydrolysis products mainly include free fatty acids, which have less surface activity (27). The impact of surface activity from hydrolysis is less significant compared to that of oxidation. As shown in Figure 8, significant hydrolysis was observed in citrate buffers at low pH and in histidine buffers at high pH. Because the impact of oxidation dominated in histidine buffers, a high GF increase was observed for PS80 samples in histidine buffers (Figure 2). However, in citrate buffers, PS80 only underwent hydrolysis, not oxidation. Thus, a slight quenching effect on the GF increase was observed for PS80 samples in citrate buffers (Figure 2). As a result, the advantage of P188 over PS80 on GF control in citrate buffer was not as significant as that in acetate or histidine buffers. Also, Because of significant hydrolysis and its quenching effect on the GF increase of PS80 in citrate buffer with mannitol at low pH, PS80 formulations had less GF increase after 3 months at 40°C

Free oleic acid (FOA) content values from polysorbate 80 (PS80) solutions.
Conclusions
This DOE study demonstrated the impact of formulation excipients on syringe functionality and performance. Common excipients used for parenteral biological drug products, including buffers, tonicity agents, and surfactants, can increase the GF, and the relative significance of their impact may vary with time. Generally, the effect of the excipient on the increase in the GF follows the trend: (a) PS80 > P188; (b) acetate > histidine > citrate; and (c) Mannitol > NaCl.
The ranking of excipients on the trend for the WCA was the reverse of the trend for the GF.
The WCA decreased with an increase in the GF because of the loss of lubricity along the syringe barrel via silicone oil layer disruption by the formulation excipients. A recent publication that demonstrated that silicone oil removal can lead to subvisible particle increase and GF increase (14) supported our hypothesis that material with a low HSP distance and a stronger capability of interacting with silicone oil will lead to a higher GF increase.
HSP distances were used to predict the relative interactions among the excipients, silicone oil, and glass. Based on these compatibility predictions, PS80 and acetic acid had stronger interactions with silicone oil when compared with those of P188 and histidine/citric acid, respectively. Thus, HSP distance could computationally explain why some excipients induced more changes in syringe functionality than others did. Notably, after 3 months at 40°C and 75% RH, histidine samples showed greater increase in GF when compared with that of those containing acetate buffer. This prediction of deviation from the HSP distance correlated with the loss of PS80 content (TOA) from oxidation and other potential chemical degradation. The oxidation of PS80 thus leads to the formation of other chemical species with more surface activity that are not covered by HSP distance prediction.
Despite the slight discrepancy between the HSP model prediction and the experimental data for the PS80/histidine combination, the HSP model could predict a more consistent GF in siliconized syringes with P188 formulations when compared with PS80 formulations. In future studies, the HSP model can be used to predict the impact of a greater number of other excipients on the functional performance of the syringe. From a higher-level point of view, drug formulators need to pay attention to materials contained in primary container closures, such as silicone oil, and consider them as pseudo “excipients” in the drug formulation. This consideration is necessary and should be done at the early stage of formulation development, when the drug formulators still have the freedom of choice of other excipients, for example, between PS80 and P188. Delaying this consideration will add risk to the development of the final combination products. The functional performances of the combination products (such as a parenteral drug contained in an autoinjector), thereby could be negatively affected by the interaction between the drug products and the primary packaging materials. Likewise, device developers need to also fully understand the impact of device interactions on the drug product. In the end, the patients will be the final beneficiary of this scientific insights-based approach, because they will receive benefits from both a safe and efficacious drug product and a well-functioning device such as an autoinjector.
Conflict of Interest Declaration
The authors declare that they have no competing interests related to this article.
Acknowledgements
The authors would like to acknowledge Le Ho, Lloyd Waxman, and Cathy Zhao for their contributions to the study. The authors would like to thank Daniel Bantz, Angela Bertagni, Tara Haarlander, and Allison Radwick from West Pharmaceuticals and Services, Inc, for thorough review of the manuscript. The authors would like to thank Drs. David Allen, Michael De Felippis, Vincent Corvari, Natarajan Rajagopalan, David S Collins, and Ron Iacocca from Eli Lilly and Company for thorough review of the manuscript.
- © PDA, Inc. 2021


